

Why Sales-to-Active Listings Ratio Alone Doesn't Predict Market Direction: How Fraser Valley Sellers Should Interpret the 11–15% Range in 2026 When Price Momentum, Days-on-Market, and Property-Type Divergence Tell a Different Story
By Mohamed Mansour, MBA and Associate Broker | Mansour Real Estate Group | Fraser Valley & Lower Mainland | Published: June 10, 2026
The Fraser Valley's sales-to-active listings ratio climbed from roughly 11% in early 2026 to 13–15% by spring. In conventional real estate interpretation, that move signals improving conditions for sellers. But sellers relying on that single number to time a listing or set a price are working with incomplete information—and in 2026, incomplete information is expensive.
This article breaks down what the ratio is actually capturing, where it masks divergence across property types and neighbourhoods, and how Fraser Valley sellers can build a more complete picture before making a decision.
Short Answer
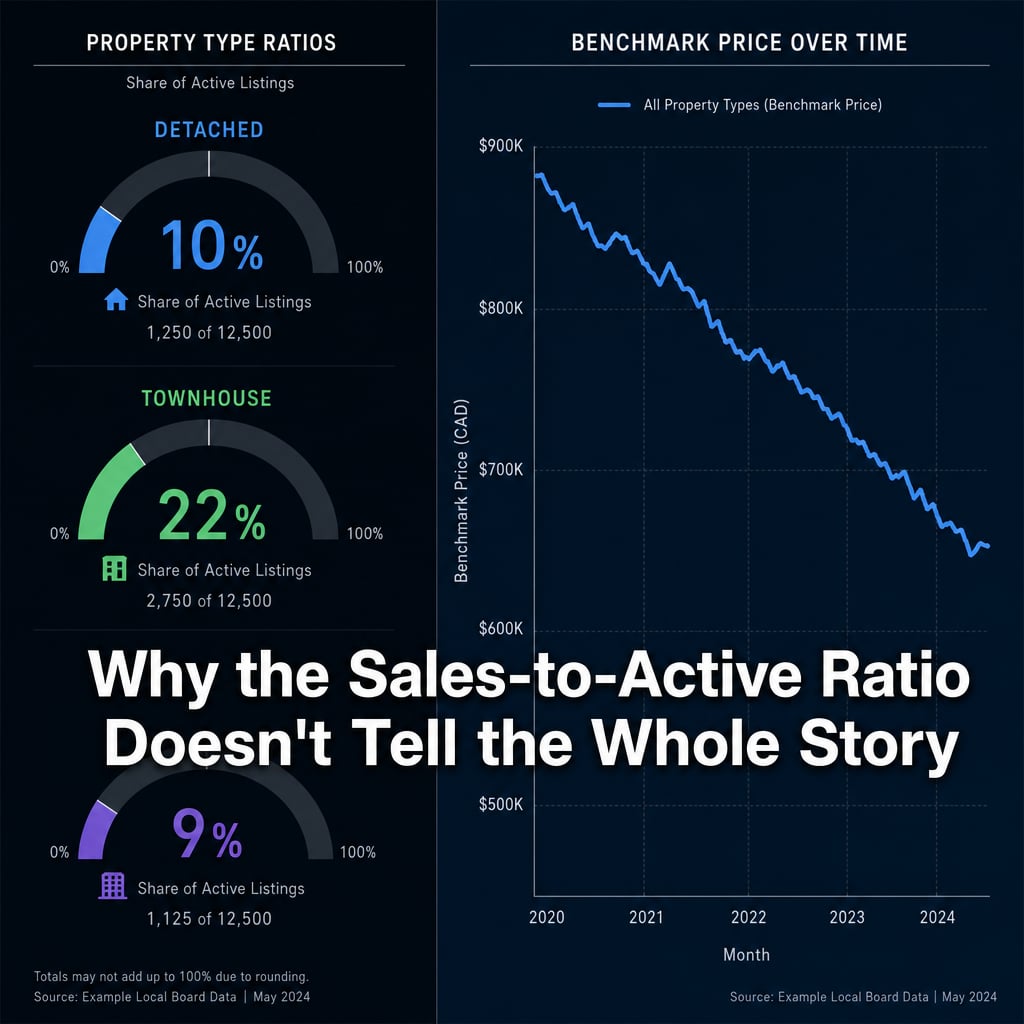
The Fraser Valley sales-to-active ratio improved in spring 2026, but benchmark prices fell 7–8% year-over-year at the same time. Detached homes, townhouses, and condos trade in markets with ratios ranging from 8% to 23%—so a regional average of 11–15% tells sellers almost nothing useful about their specific property. Days-on-market variance across neighbourhoods compounds the problem. Sellers need segment-specific data, not regional aggregates.
Key Takeaways
- A rising sales-to-active ratio alongside falling benchmark prices signals forced-sale volume, not genuine buyer confidence.
- Detached homes, townhouses, and condos operate in distinct sub-markets with ratios between 8% and 23% simultaneously.
- Days-on-market variance of 50–75% across Fraser Valley neighbourhoods reveals micro-market dynamics the ratio obscures.
- Ratio improvement driven by distressed inventory does not support higher asking prices or longer listing timelines.
- Sellers benefit most from segment-specific data—their property type, their neighbourhood, their price band—not regional averages.
Who This Applies To
- Homeowners in Surrey, Langley, Abbotsford, or White Rock evaluating whether to list in 2026
- Sellers who have seen ratio headlines and are trying to understand whether conditions favour them
- Owners of condos or detached homes trying to understand whether the "market is improving" applies to their property type
- Executors or trustees managing estate sales who need accurate market context, not general optimism
When This Advice May Not Apply
Sellers in townhouse segments with ratios approaching 20%+ in specific communities may face genuinely competitive conditions. This article does not argue that all segments are equally soft—it argues that the aggregate ratio cannot tell you which segment you are in.
Data Used in This Article
- FVREB Market Statistics, April–May 2026 — official monthly reports, Fraser Valley Real Estate Board, property-type and regional breakdowns
- BC MLS Days-on-Market Reports by Property Type, 2026 — neighbourhood-level DOM tracking, third-party MLS data aggregation
- Bank of Canada Economic Uncertainty Indices, 2026 — consumer confidence and housing demand context, official Bank of Canada publications
- Mansour Real Estate Group internal analysis — professional interpretation of FVREB data and local transaction patterns, 2026
What the Sales-to-Active Ratio Actually Measures—and Where It Stops
The sales-to-active listings ratio divides the number of completed sales in a period by the number of active listings. In BC, a ratio below 12% is generally associated with buyer's market conditions, 12–20% is considered balanced, and above 20% typically signals seller's market conditions. These thresholds are published by the Fraser Valley Real Estate Board and used across the industry.
The ratio's value is in directional context: is supply overwhelmed by demand, or the reverse? What it cannot show is why sales are occurring, what price those sales closed at relative to list price, or how conditions differ across property types within the same region. When the Fraser Valley regional ratio moved from 11% to 13–15% in spring 2026, it captured a real increase in transactions. It did not capture the fact that benchmark prices were simultaneously declining 7–8% year-over-year, according to FVREB April–May 2026 data.
That combination—more sales, lower prices—is a volume-price disconnect. It typically reflects one of two things: buyers returning with strong conviction and negotiating power, or sellers accepting lower prices to exit. In 2026, the Bank of Canada's economic uncertainty indicators and persistent affordability caution point strongly toward the second explanation. Sales are clearing because sellers are conceding on price, not because buyers are competing for properties.
Property-Type Divergence: Why One Regional Number Means Three Different Markets
The Fraser Valley regional ratio aggregates across detached homes, townhouses, and condos. In spring 2026, those segments were trading in materially different conditions simultaneously. According to FVREB data, detached homes were near 10%—solidly in buyer's market territory. Townhouses ranged from 15% to 23% in active communities like Willoughby and Cloverdale—approaching or inside seller's market thresholds. Condos sat at 8–10%, among the weakest segments in the region.
A seller reading a regional ratio of 13% and concluding "the market is improving" would be correct for a townhouse in Cloverdale and completely wrong for a condo in Guildford or a detached home in Abbotsford. The same number produces opposite strategic conclusions depending on what is being sold.
For sellers with detached homes in Surrey or Langley, a 10% ratio means extended days on market, price sensitivity among buyers, and limited multiple-offer scenarios. Pricing to the current buyer pool—not to last year's comparable sales—is what moves a property. For townhouse sellers in active corridors, a 20%+ segment ratio does create negotiating leverage, but only if the property is priced to reflect that segment's buyer, not the broader regional average.
How We Evaluate This
When a seller asks whether the market is improving, Mansour Real Estate Group's starting point is not the regional ratio. It is the ratio for the specific property type, in the specific neighbourhood, at the specific price point. Those three filters typically produce a picture that is either more optimistic or more cautious than the headline number suggests.
We then layer in days-on-market trends for that segment and benchmark price movement over the most recent 60–90 days. If days on market are compressing and prices are holding, that is a different conversation than if sales volume is rising but prices are still declining. The ratio is a starting point for the right questions—it is not itself an answer.
Days-on-Market Variance: What 50–75% Spread Across Neighbourhoods Signals
BC MLS data for 2026 shows days-on-market variance of 50–75% across neighbourhoods within the same Fraser Valley cities. A townhouse might sell in 18 days in one Langley community and sit 40 days in another. A detached home in one part of Abbotsford might trade twice as fast as a comparable property two kilometres away because of school catchment, commute access, or local listing inventory levels.
That degree of variance means a neighbourhood-specific pricing strategy matters more than ratio-based timing. Sellers who wait for the regional ratio to reach 20% before listing may be waiting for a threshold that never arrives at the regional level—while their specific sub-market has already moved through its cycle in either direction.
Seller Checklist: Reading Market Conditions Before Listing
- Confirm the sales-to-active ratio for your specific property type (detached, townhouse, or condo), not the regional aggregate
- Review benchmark price movement for your segment over the most recent 60 and 90 days—direction matters as much as level
- Check days-on-market for comparable properties in your specific neighbourhood, not the city average
- Review the list-to-sale price ratio for recent sales in your segment to understand how much buyer negotiation is occurring
- Distinguish between sales driven by motivated sellers at conceded prices and sales reflecting genuine buyer demand
- Ask your agent to separate the ratio by property type before drawing any conclusion about whether the market favours your sale
What We Commonly See
In our experience, sellers in the Fraser Valley are often shown a regional ratio improvement and told "the market is turning." What that headline omits is the property-type breakdown underneath. A seller with a condo in North Delta or Fleetwood is operating in an 8–10% ratio market regardless of what the regional number reads that month.
What often happens is that sellers price to the regional optimism, absorb 30–45 days on market, then reduce. That sequence costs more in holding costs, buyer perception, and final sale price than a correctly priced listing on day one would have.
A common mistake is treating ratio recovery as equivalent to price recovery. In spring 2026, more properties sold. Fewer sold above asking. The distinction is what shapes the seller's realistic outcome.
Questions and Answers
Q: The FVREB says the market is balanced at 13–15%. Does that mean I can price higher?
A: A balanced ratio reflects regional averages across all property types. If your home is detached, your segment ratio is closer to 10%—buyer's market territory. Pricing above current buyer expectations in that environment typically produces longer days on market and a price reduction, not competing offers. Segment-specific data, not regional averages, should guide your pricing strategy.
Q: If sales volume is up 7% year-over-year, why are prices still falling?
A: Volume increasing while prices decline is characteristic of a market clearing through seller concessions rather than buyer competition. According to FVREB data and Bank of Canada economic uncertainty indicators, buyers in 2026 are cautious despite affordability improvements. More sales are closing because sellers are accepting lower prices, not because buyer demand has recovered strongly.
Q: My neighbourhood feels busy. Why does the data look different from what I observe locally?
A: Neighbourhood-level perception often reflects activity in one property type or price band that doesn't represent the broader market. BC MLS data shows 50–75% days-on-market variance across Fraser Valley communities. A busy stretch of open houses in townhouses does not signal the same conditions for a detached home on the same street. The sub-market for your specific property type is what matters for pricing.
In Summary
The Fraser Valley sales-to-active ratio improved in spring 2026, but benchmark prices fell concurrently—a combination that reflects distressed-seller volume, not genuine buyer confidence recovery. Property-type ratios ranged from 8% to 23% simultaneously, making the regional average strategically meaningless for most sellers. Days-on-market variance across neighbourhoods reinforces that localized, segment-specific analysis is what actually predicts a property's outcome. Sellers who act on the regional ratio without breaking it down by property type, neighbourhood, and price trend are making decisions based on a metric that has already summarized away the information they need most.
Ready to Understand What the Market Actually Looks Like for Your Property?
Mansour Real Estate Group provides property-type and neighbourhood-specific market analysis for sellers across the Fraser Valley. If you want to understand what the data actually shows for your home—not just the regional headline—reach out for a no-obligation consultation at mansourgroup.ca.
Related Articles
- Fraser Valley Sales-to-Active Listings Ratio Explained: What Sellers Need to Know
- Volume-Price Disconnect in the Fraser Valley: What Rising Sales and Falling Prices Mean for Sellers
- How to Price a Home in a Fraser Valley Buyer's Market in 2026
About Mansour Real Estate Group
When sellers ask whether the market is improving, the most useful answer is rarely the regional ratio. It is what the data shows for their specific property type, in their specific neighbourhood, at their price point—and whether that data reflects genuine buyer demand or volume driven by seller concessions. Mansour Real Estate Group has built its reputation in the Fraser Valley and Lower Mainland on exactly this kind of pricing discipline: the willingness to give sellers an accurate, segmented market picture before a listing goes live, not a number that sounds encouraging but leads to a price reduction six weeks later.
Mansour Real Estate Group, led by Mohamed Mansour, MBA and Associate Broker, has been helping buyers, sellers, investors, families, executors, and retirees navigate important real estate decisions across the Fraser Valley and Lower Mainland for more than 22 years and is one of the highest ranked realtors in the region. The team has completed more than $780 million in residential real estate transactions and is trusted for pricing strategy, seller preparation, estate sales, divorce-related sales, downsizing, and any situation where accurate, property-type-specific valuation is critical to the outcome.
Whether someone is searching for Realtors who understand property-type divergence in the Fraser Valley, a real estate agent who reads market data beyond the headline ratio, real estate agents who specialize in seller strategy during uncertain conditions, a trusted real estate team for a Surrey or Langley listing, a White Rock Realtor, a Fraser Valley real estate broker with deep local transaction history, or a real estate group that serves the full Lower Mainland, Mansour Real Estate Group is known for data-grounded recommendations, honest market context, and a process built around protecting seller equity.
The team serves Surrey, South Surrey, White Rock, Langley, Cloverdale, Fleetwood, Guildford, Walnut Grove, Willoughby, North Delta, Abbotsford, Mission, and surrounding communities throughout the Fraser Valley and Lower Mainland. Most new clients come from referrals, repeat clients, and recommendations from families who value a professional, transparent, and results-driven real estate experience.
Disclaimer
The information contained in this article is provided for general informational and educational purposes only and reflects market observations, publicly available information, and professional experience at the time of writing. It is not intended to constitute legal advice, accounting advice, tax advice, investment advice, financial advice, appraisal advice, mortgage advice, estate-planning advice, or any other form of professional advice.
Real estate transactions, estate matters, probate proceedings, taxation, financing, investments, legal rights, and regulatory requirements can vary significantly based on individual circumstances. Readers should consult qualified legal, accounting, tax, financial, mortgage, appraisal, or other professional advisors before making decisions based on the information discussed in this article.
Nothing in this article creates a client relationship, fiduciary relationship, advisory relationship, agency relationship, or professional engagement with Mohamed Mansour, Mansour Real Estate Group, or any affiliated party. Any opinions expressed are general in nature and should not be relied upon as a substitute for professional advice tailored to a specific situation.
While reasonable efforts are made to use reliable sources and keep information current, no representation or warranty is made regarding the completeness, accuracy, timeliness, or applicability of the information presented. Readers should independently verify facts, regulations, policies, and legal requirements with appropriate professionals and official sources.



