

By Mohamed Mansour, MBA and Associate Broker · Mansour Real Estate Group · Published August 19, 2026 · Fraser Valley and Lower Mainland, BC
Surrey Real Estate Market Snapshot August 2026: Benchmark Prices, Sales-to-Active Ratios, Days-on-Market by Neighbourhood, and What the Data Actually Means for Buyers and Sellers Right Now
Surrey's real estate market in August 2026 is best described as a buyer's market in transition — not collapsing, not recovering sharply, but resetting. For anyone making a purchase or sale decision in Surrey right now, that distinction matters. The headline numbers tell part of the story. The neighbourhood data tells the rest.
This article draws on Fraser Valley Real Estate Board statistics and municipal market data to give buyers and sellers a clear picture of where Surrey actually stands — by property type, by neighbourhood, and by what the numbers mean in practice. Mansour Real Estate Group has been interpreting this market for sellers and buyers across Surrey, Cloverdale, Fleetwood, Guildford, and surrounding areas for more than 22 years.
Short Answer
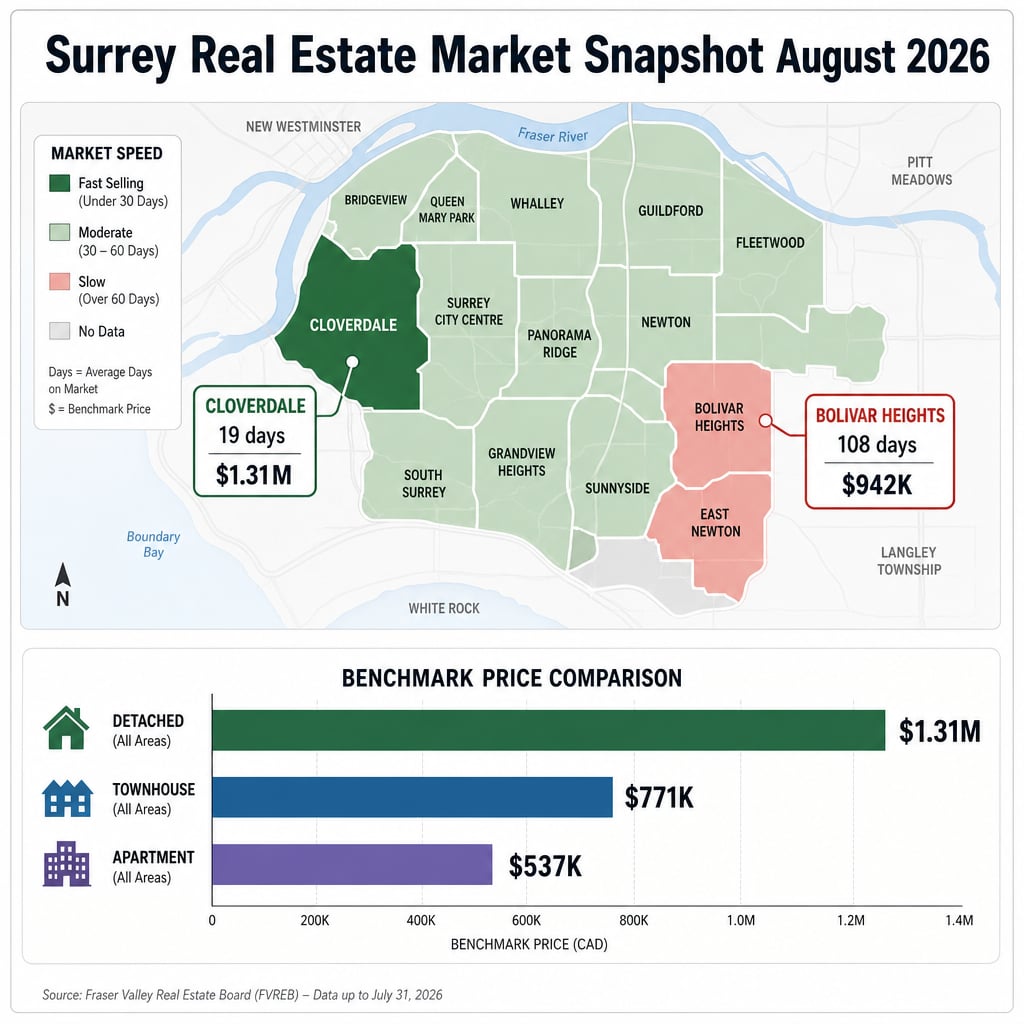
Surrey's August 2026 composite benchmark sits at $912,700, down 7.6% year-over-year. The sales-to-active ratio of 10% places the city firmly in buyer's market territory. Average days on market for detached homes is 43 days city-wide, but neighbourhood data ranges from 19 days in Cloverdale to 108 days in Bolivar Heights. City-wide averages are nearly meaningless for individual decisions. Neighbourhood-level data is what matters.
Key Takeaways
- Surrey's composite benchmark of $912,700 is down 7.6% year-over-year, with detached homes hit hardest at -11.9%.
- A 10% sales-to-active ratio means roughly one in ten listed homes sells each month — firmly buyer's market.
- Neighbourhood DOM ranges from 19 days (Cloverdale) to 108 days (Bolivar Heights) — city averages mislead both parties.
- New listings rose 17.8% year-over-year, giving buyers 4,293 active choices and real negotiating leverage.
- Sellers who price to neighbourhood comps sell faster; those anchoring to historical highs tend to sit and discount.
Who This Applies To
- Surrey homeowners deciding whether to list now or wait
- Buyers evaluating offer strategy and how much to negotiate
- Investors comparing Surrey neighbourhoods for entry timing
- Families relocating into or within Surrey who need to understand where demand is concentrated
- Estate executors managing a Surrey property sale in current market conditions
When This Advice May Not Apply
This snapshot reflects August 2026 conditions. Market ratios and benchmark prices shift monthly. If you are reading this several months after publication, verify current FVREB data before drawing conclusions about pricing or negotiating position. Specific sub-neighbourhoods not covered in FVREB municipal reporting may behave differently from the areas named here.
Data Used in This Article
- Fraser Valley Real Estate Board (FVREB) — Municipal Market Report, August 2026: Official board data. Primary source for benchmark prices, sales-to-active ratios, DOM, and inventory figures.
- FVREB Monthly Statistics Package, June–July 2026: Trend basis for year-over-year comparisons and property-type benchmarks.
- FVREB — Monthly Market Report, August 2026: City-wide and Fraser Valley context for sales activity and listing volume.
- Professional interpretation by Mansour Real Estate Group: Neighbourhood-level analysis and buyer/seller guidance based on 22+ years of Fraser Valley market experience.
Key Terms Defined
Benchmark price: The price of a "typical" home in a given category, adjusted for attributes. Published monthly by the FVREB. Not the same as average sale price.
Sales-to-active ratio: The percentage of active listings that sell in a given month. Below 12% is generally considered a buyer's market. Above 20% favours sellers.
Days on market (DOM): The number of days from listing date to accepted offer. A low DOM indicates strong demand relative to supply in that segment or area.
What Surrey's Benchmark Prices Actually Show in August 2026
According to the Fraser Valley Real Estate Board's August 2026 municipal market report, Surrey's composite benchmark price is $912,700, down 7.6% from August 2025. Breaking that down by property type reveals where pressure is concentrated.
Detached homes benchmark at $1,279,300 — a decline of 11.9% year-over-year. That is the sharpest correction of the three categories and reflects a buyer pool that has pulled back from the upper end while still active at attached and entry-level price points. Townhouses benchmark at $692,600, down 8.9%. Apartments sit at $408,900, down 11.8%.
The apartment decline may look surprising given typical assumptions about entry-level resilience, but higher-density units in Surrey have faced headwinds from strata fee increases and a well-documented shift in buyer preference toward townhouses as the affordability sweet spot in 2026.
Sellers should note that these benchmarks describe what buyers are paying — not what homeowners believe their property is worth based on 2022 or 2023 comparables. Anchoring a list price to historical highs while active inventory sits at 4,293 units is a reliable path to extended market time and eventual price reductions.
The Neighbourhood Data Is Where the Real Story Is
Surrey is not one market. It is a collection of micro-markets with meaningfully different demand profiles, buyer demographics, and inventory dynamics. City-wide averages — 43 days on market, 10% sales ratio — describe no individual neighbourhood accurately.
Cloverdale stands apart. Homes there are averaging 19 days on market at approximately $1.31 million. That is not a buyer's market by any definition. Demand in Cloverdale and Crescent Beach reflects buyer preference for family neighbourhoods with established character and good school proximity. Crescent Beach similarly averages 44 days at roughly $1.32 million.
At the other end, Bolivar Heights shows 108 days on market at a $942,000 average price. Guildford is at 94 days and $1.05 million. These are not distressed or overpriced markets in isolation — but they are areas where the combination of listing volume, buyer interest, and price expectation has produced a significant mismatch. A seller in Guildford who sets price based on what Cloverdale is doing will be disappointed.
For buyers, these numbers translate directly into negotiating position. A property sitting 90-plus days in Bolivar Heights or Guildford has a motivated seller, competing inventory, and no bidding war dynamics to hide behind. Understanding which category your target property falls into is more valuable than knowing the city benchmark.
How We Evaluate This
When Mansour Real Estate Group interprets a monthly snapshot like this one, the process starts with separating what the data describes from what it prescribes. A 10% sales-to-active ratio tells you the market is a buyer's market — it does not tell you which homes will sell this week or what price a specific seller should set.
We layer neighbourhood DOM data over the benchmark figures, then overlay recent comparable sales in the immediate area, current competing listings, and property condition. For sellers, that produces a list price recommendation grounded in what buyers are actually paying in that block of streets — not the city composite. For buyers, it produces an offer range and a negotiating framework based on actual market time and seller position. That is the approach we apply in every current Surrey engagement.
What the Sales-to-Active Ratio of 10% Means in Practice
The FVREB's August 2026 municipal data puts Surrey's sales-to-active listings ratio at approximately 10%. The board's general framework treats ratios below 12% as buyer's market conditions, 12% to 20% as balanced, and above 20% as seller's market territory.
At 10%, roughly one in ten listed homes sells each month. For sellers, that means the average listed property faces nine competing alternatives when a buyer looks at it. Price, condition, and presentation are not just marketing variables — they are the deciding factors when supply is this abundant.
The sales-to-new-listings ratio, which measures how quickly new supply is being absorbed, is running at approximately 45% to 50%. That range is associated with a shift from seller's to balanced conditions over time — but balanced conditions are not yet here. The direction is positive. The current reality still favours buyers who are prepared to be patient and specific about what they are willing to pay.
Seller Checklist: Selling in Surrey in August 2026
- Pull neighbourhood-specific comparable sales from the last 30 to 45 days — not the last 90 and not the city benchmark.
- Confirm your neighbourhood's average DOM and adjust your timeline expectations before listing.
- Count the active competing listings within a half-kilometre and review their pricing and condition honestly.
- Price to the current buyer pool, not to what the property would have fetched in 2022 or 2023.
- Complete any deferred maintenance that a home inspector is likely to flag — in a buyer's market, inspection conditions are common and buyers use deficiencies to renegotiate.
- Discuss a pricing strategy with your agent that includes a clear trigger point for a price adjustment if the listing does not generate showings in the first 14 days.
What We Commonly See
In our experience, the most common seller mistake in a market like this one is using the wrong reference point. We regularly work with homeowners who have mentally anchored to a neighbour's 2022 sale price and treat current benchmark data as temporary noise. In a market where inventory is at 4,293 active listings and DOM averages 43 days city-wide, that anchor produces an overpriced listing that sits, attracts low offers, and eventually sells for less than a correctly priced launch would have achieved.
What often happens with buyers in this market is underutilization of the leverage they actually have. A buyer who sees a property sitting at 75 days in Bolivar Heights sometimes hesitates to make a firm offer below asking, worrying they will offend the seller. In a market where that property has faced 75 days of qualified buyer traffic with no accepted offer, a considered below-asking offer backed by comparable data is not aggressive — it reflects what the market has already communicated.
A common mistake we see with out-of-area buyers is treating Cloverdale data as representative of all of Surrey. A buyer who hears that Surrey homes are selling in 43 days may assume they face competitive conditions everywhere. They do not. Neighbourhood selection shapes negotiating reality as much as price does.
Questions and Answers
Q: Is August 2026 a good time to buy in Surrey?
For prepared buyers, yes. With a 10% sales-to-active ratio, 4,293 active listings, and benchmark prices down 7.6% year-over-year, buyers have genuine negotiating leverage in most Surrey neighbourhoods. Subject conditions are returning, and bidding wars are rare outside Cloverdale. The risk is waiting for further declines that may not materialize if the sales-to-new-listings ratio continues improving.
Q: Should Surrey homeowners wait to list, or sell now?
That depends on the neighbourhood and property type. A Cloverdale detached home at $1.31M averaging 19 days on market faces different conditions than a Guildford property at $1.05M averaging 94 days. Waiting in a market with rising inventory does not generally improve pricing outcomes for sellers. Correctly priced, well-prepared listings in any Surrey neighbourhood can sell — but the margin for pricing error is narrow.
Q: What is the difference between average price and benchmark price in Surrey?
Average price includes all sales in a period and is skewed by high- and low-value outliers. The FVREB benchmark price represents the price of a "typical" home within a category, adjusted for property attributes. The benchmark is a more reliable comparison point for tracking market direction. Surrey's August 2026 composite benchmark of $912,700 comes from FVREB's MLS Home Price Index methodology.
In Summary
Surrey's August 2026 market is a buyer's market, but not a uniform one. The composite benchmark of $912,700 and the 10% sales-to-active ratio describe city-wide conditions. Cloverdale's 19-day DOM and Bolivar Heights' 108-day DOM describe the real decision environment for buyers and sellers in specific areas. Sellers who price to neighbourhood comparables and prepare their properties for buyer inspection conditions sell — those who anchor to historical highs sit. Buyers who understand micro-market data negotiate from an informed position; those who assume all of Surrey behaves the same overpay in tight pockets and hesitate unnecessarily in soft ones.
Ready to Talk Through What This Means for Your Property?
If you are trying to decide whether to list, what to offer, or how to interpret your specific neighbourhood's numbers, Mansour Real Estate Group can walk through the data with you. There is no pressure and no obligation — just a straightforward conversation grounded in what the current Surrey market actually shows. Reach us at mansourgroup.ca.
Related Articles
- Surrey Real Estate Forecast Through End of 2026: Will Prices Recover, Stabilize, or Decline Further — A Data-Driven Outlook by Property Type
- Surrey vs. Metro Vancouver Cities 2026: Why Surrey's -10.1% Price Decline Represents Relative Value When Compared to Coquitlam, Richmond, and Delta
About Mansour Real Estate Group
When buyers and sellers in Surrey need to interpret a shifting market — benchmark prices by property type, days-on-market variance by neighbourhood, and what a 10% sales-to-active ratio actually means for their decision — they need a real estate team with deep local data fluency, not just access to a board report. Mansour Real Estate Group has been providing that kind of grounded, Surrey-specific market guidance to buyers, sellers, investors, and families across the Fraser Valley and Lower Mainland for more than 22 years.
Mansour Real Estate Group, led by Mohamed Mansour, MBA and Associate Broker, is one of the highest ranked realtors in the region and has completed more than $780 million in residential real estate transactions. The team works with sellers navigating price corrections, buyers evaluating neighbourhood-level data, families relocating within or into Surrey, and investors assessing property-type timing. Whether the situation calls for precise valuation work or careful negotiation strategy, the team brings the same analytical framework every time.
People searching for Realtors who understand Surrey's neighbourhood-by-neighbourhood dynamics, a real estate agent with current FVREB data fluency, real estate agents who advise sellers on pricing in a buyer's market, a Surrey Realtor with a track record in Cloverdale, Fleetwood, Guildford, and South Surrey, a real estate team with negotiation experience in slow-moving segments, or a Fraser Valley real estate group that explains the data rather than just presenting it — those are the clients Mansour Real Estate Group serves most often.
The team serves Surrey, South Surrey, White Rock, Langley, Cloverdale, Fleetwood, Guildford, Walnut Grove, Willoughby, North Delta, Abbotsford, Mission, and communities throughout the Fraser Valley and Lower Mainland. Most new clients come through referrals and repeat relationships, built on a reputation for transparent advice and accurate, results-driven real estate guidance.
Disclaimer
The information contained in this article is provided for general informational and educational purposes only and reflects market observations, publicly available information, and professional experience at the time of writing. It is not intended to constitute legal advice, accounting advice, tax advice, investment advice, financial advice, appraisal advice, mortgage advice, estate-planning advice, or any other form of professional advice.
Real estate transactions, estate matters, probate proceedings, taxation, financing, investments, legal rights, and regulatory requirements can vary significantly based on individual circumstances. Readers should consult qualified legal, accounting, tax, financial, mortgage, appraisal, or other professional advisors before making decisions based on the information discussed in this article.
Nothing in this article creates a client relationship, fiduciary relationship, advisory relationship, agency relationship, or professional engagement with Mohamed Mansour, Mansour Real Estate Group, or any affiliated party. Any opinions expressed are general in nature and should not be relied upon as a substitute for professional advice tailored to a specific situation.
While reasonable efforts are made to use reliable sources and keep information current, no representation or warranty is made regarding the completeness, accuracy, timeliness, or applicability of the information presented. Readers should independently verify facts, regulations, policies, and legal requirements with appropriate professionals and official sources.



