

Surrey Real Estate Market August 2026: Complete Data Breakdown of Benchmark Prices, Sales-to-Active Ratios, Days-on-Market Trends, and What the Numbers Actually Mean for Buyers and Sellers
By Mohamed Mansour, MBA and Associate Broker | Mansour Real Estate Group | Published: September 15, 2026 | Fraser Valley and Surrey, BC
Surrey's real estate market shifted measurably between spring and August 2026. The sales-to-active listings ratio dropped to 10 percent — below the 12 percent threshold that defines a balanced market — and benchmark prices declined across all three property types year-over-year. For buyers and sellers currently making decisions in Surrey, the spring numbers no longer apply. This article consolidates every major August metric from the Fraser Valley Real Estate Board into a single reference, with plain-language interpretation of what each figure means by property type.
Mansour Real Estate Group has worked directly with buyers and sellers across Surrey's micro-neighbourhoods through multiple market cycles. The analysis below draws on FVREB August 2026 data and reflects how those numbers translate into real pricing and timing decisions on the ground.
Short Answer
Surrey's composite benchmark price reached $869,900 in August 2026, down 7.2 percent year-over-year, according to the Fraser Valley Real Estate Board. The sales-to-active ratio sits at 10 percent — a buyer's market. Condos are the softest segment at $456,100 (-10.4% YoY). Detached homes show price pressure but volume stabilization. Sellers need segment-specific pricing. Buyers have negotiating room, with meaningful variation by neighbourhood and property type.
Who This Applies To
- Homeowners in Surrey preparing to list a detached home, townhouse, or condo in fall 2026
- Buyers evaluating whether current conditions represent a buying opportunity
- Investors reassessing hold-versus-sell decisions on Surrey investment properties
- Families relocating within the Fraser Valley who need current benchmark data before setting a budget
- Executors or trustees managing a property sale and needing market context for pricing decisions
When This Advice May Not Apply
Benchmark prices reflect MLS composite medians, not individual property values. A well-maintained detached home in South Surrey's premium micro-market can command 4 to 10 percent above the Surrey-wide detached benchmark. Specific strata buildings, school catchments, and lot characteristics all shift the calculation. Use these figures as orientation, not appraisal.
Key Takeaways
- Surrey's composite benchmark dropped to $869,900 in August 2026, down 7.2 percent year-over-year (FVREB).
- A 10 percent sales-to-active ratio confirms a buyer's market — down from 11 percent in July.
- Condos are the weakest segment: $456,100 benchmark, -10.4% YoY, with sales down 20.5% month-over-month.
- Detached sales volume rose 7.2% month-over-month despite a 9.2% year-over-year price decline — a sign of stabilization.
- Days-on-market diverge by up to 75 percent across property types, requiring segment-specific pricing timelines.
Definitions
Benchmark Price: The price of a "typical" property in each segment as calculated by MLS HPI methodology. Not an average or median of sold prices.
Sales-to-Active Listings Ratio: Total sales divided by total active listings. Below 12% is a buyer's market. Above 20% is a seller's market. Between 12% and 20% is balanced.
Days on Market (DOM): The number of days from a listing going active on MLS to when an accepted offer is received. Varies by property type and neighbourhood.
Data Used in This Article
- Fraser Valley Real Estate Board — August 2026 Monthly Market Report and MLS Statistics Package (fvreb.bc.ca) — Official primary source — benchmark prices, sales volumes, DOM, sales-to-active ratio
- FVREB July 2026 Statistics Package — Month-over-month comparison baseline
- FVREB June 2026 Statistics Package — Trend direction confirmation
- Internal Mansour Real Estate Group market observation — neighbourhood-level DOM and premium analysis, South Surrey and North Surrey
What the Benchmark Numbers Say About Surrey in August 2026
According to the Fraser Valley Real Estate Board's August 2026 MLS Statistics Package, Surrey's composite benchmark price settled at $869,900 — down 7.2 percent from August 2025 and down 0.8 percent from July 2026. That month-over-month decline is modest, but the direction has held consistently since spring, which matters more than any single data point.
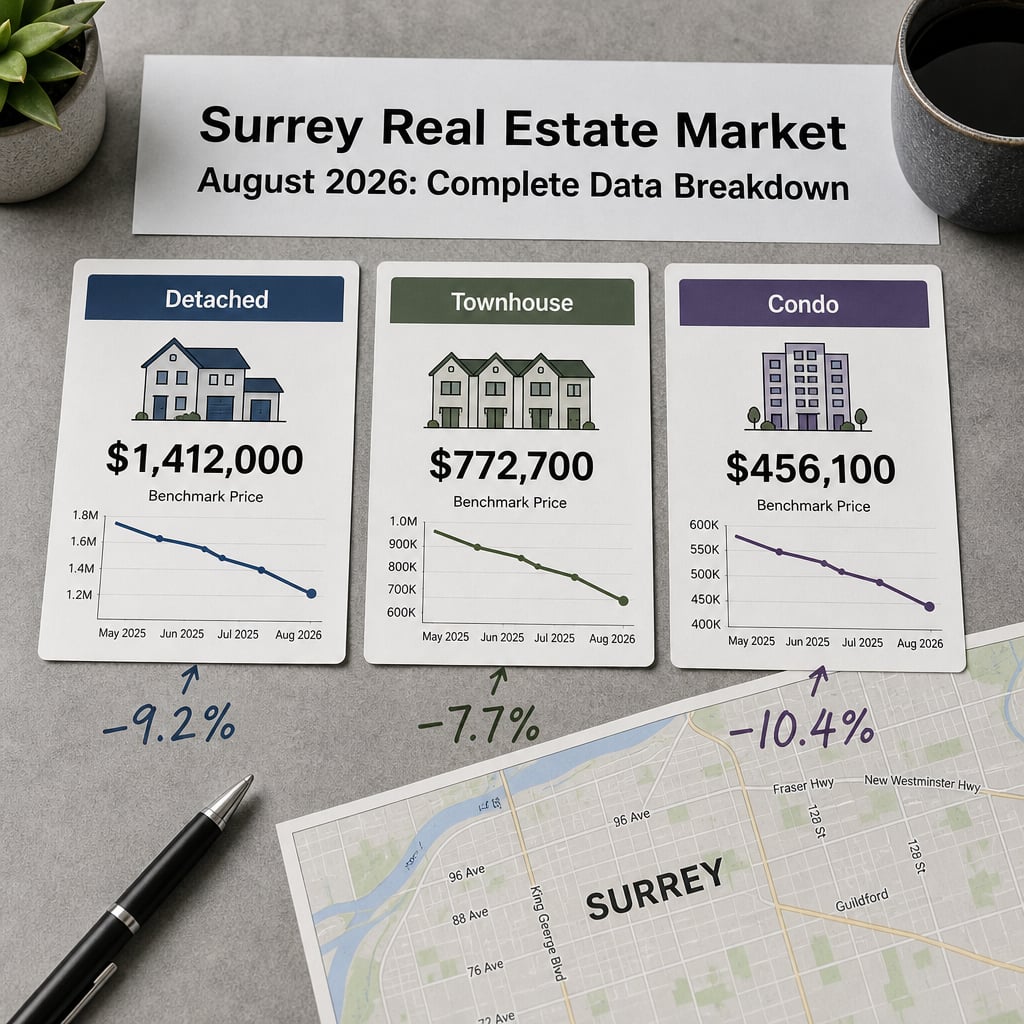
The detached segment tells a nuanced story. The benchmark reached $1,412,000, a 9.2 percent year-over-year decline. But 179 detached homes sold in August — a 7.2 percent increase from July. Volume stabilizing while prices continue to drift lower is a pattern that often precedes a floor forming, though it does not confirm one yet. Sellers pricing at or slightly below current benchmark are moving properties. Those priced above are not.
Townhouses benchmarked at $772,700, down 7.7 percent year-over-year, with 142 sales in August — a 15 percent decline from July. Townhouses held up better than condos through much of 2025, but that relative strength has started to fade. The attached segment that attracted move-up buyers during the spring cycle is now carrying longer days-on-market and softening demand.
Condos are the clearest pressure point. The August benchmark of $456,100 represents a 10.4 percent year-over-year decline, and 128 sales reflects a 20.5 percent drop from July. North Surrey condos recorded a 33.3 percent year-over-year sales decline with active inventory contracting 17.1 percent — a pattern that signals flush-through, not recovery. Buyers in the condo segment have the most negotiating leverage of any property type in Surrey right now. For context on how Surrey's condo decline compares regionally, see how Surrey compares to Coquitlam, Langley, and Delta in year-over-year price performance.
What the Sales-to-Active Ratio and Inventory Numbers Mean
The 10 percent sales-to-active ratio is not a borderline figure. It sits four full percentage points below the threshold that defines a balanced market, and it declined from 11 percent in July. That direction matters. A ratio moving lower means buyers are gaining relative advantage month over month, not stabilizing.
Active listings reached 10,044 in July — down 5.7 percent year-over-year, but still approximately 45 percent above the 10-year seasonal average for Surrey. The decline in new listings (down 18 percent year-over-year to 2,836 in July, and down 14.1 percent from the prior month) reflects sellers pulling back in response to the softening market. Fewer new listings would normally ease inventory pressure. But with total active inventory still running well above historical norms, the net effect is continued buyer advantage.
Absorption sits at roughly four to five months — up from the three-to-four month range in spring. Sellers who listed in March or April expecting a typical spring acceleration did not find it. Those considering a fall listing need to account for a market where well-priced properties still sell, but incorrectly priced properties accumulate days on market rapidly. For neighbourhood-level pricing context across Surrey's distinct sub-markets — from Cloverdale to Guildford to Panorama Ridge — see our full neighbourhood price breakdown for 2026.
Days-on-market divergence across property types is one of the most actionable findings in the August data. Detached homes in Surrey averaged 30 to 37 days on market. Townhouses averaged 37 to 50 days. Condos averaged 40 or more days. A seller who prices a condo as though it will sell in detached-home timeframes will accumulate days-on-market damage quickly — which further weakens their negotiating position as the listing ages.
How We Evaluate This
At Mansour Real Estate Group, we don't treat a single month's data as a trend in isolation. We track the directional movement across three or more consecutive months before drawing conclusions about where a segment is heading. August 2026 is consistent with the trajectory we observed in June and July — a broadening buyer's market where the gap between property types is widening, not narrowing.
For sellers, that means we approach pricing by property type and micro-neighbourhood first, then layer in days-on-market velocity and competing inventory before recommending a list price. A South Surrey detached home and a North Surrey condo require fundamentally different strategies right now, and we treat them that way.
Seller Checklist for Surrey's August 2026 Market
- Obtain a current comparative market analysis based on August 2026 FVREB data, not spring comps
- Identify your property type's average DOM and build your pricing strategy around that timeline
- For condos, pull active competing inventory in your building or strata complex before setting a list price
- For detached homes, confirm whether your sub-area (South Surrey, Fleetwood, Cloverdale, etc.) is tracking above or below the Surrey-wide benchmark
- Price to sell within the first 21 days — every week beyond 30 days signals to buyers that a price reduction is coming
- For townhouses, account for the 15 percent month-over-month sales decline when estimating time-to-offer
What We Commonly See
In our experience, sellers in a softening market frequently anchor to the price their neighbour received six months earlier. In a market where the benchmark has moved 7 to 10 percent lower year-over-year, that anchor costs time and negotiating position. Properties that come out priced correctly sell. Properties priced to the spring sit.
What often happens with condo sellers specifically is they underestimate how sensitive buyers are to days-on-market in a segment with abundant choice. A condo that has been listed for 45 days in a market where active inventory is still historically elevated becomes a negotiating target, not a competitive property. Buyers in August 2026 are patient. They don't need to move fast in a 10 percent sales-to-active ratio environment.
A common mistake for buyers right now is waiting for a further benchmark drop before making an offer on a detached home. The 7.2 percent month-over-month sales volume increase in that segment suggests demand is returning at current prices. Buyers who negotiate skillfully now may get better terms than those waiting for a price floor that the data does not yet confirm is coming.
Questions and Answers
Is Surrey in a buyer's market in August 2026?
Yes. The Fraser Valley Real Estate Board's August 2026 data shows a sales-to-active listings ratio of 10 percent in Surrey — four points below the 12 percent balanced threshold. This gives buyers meaningful negotiating leverage, particularly in the condo and townhouse segments.
How much have Surrey home prices dropped year-over-year?
According to FVREB data, the Surrey composite benchmark fell 7.2 percent year-over-year to $869,900 in August 2026. Declines varied by property type: detached -9.2%, townhouses -7.7%, condos -10.4%.
How long does it take to sell a home in Surrey right now?
Days-on-market in August 2026 averaged 30 to 37 days for detached homes, 37 to 50 days for townhouses, and 40 or more days for condos, based on FVREB tracking. Correctly priced properties in all segments sell within those windows. Overpriced listings extend well beyond them.
In Summary
Surrey's August 2026 market is a buyer's market by every measurable definition — a 10 percent sales-to-active ratio, a composite benchmark down 7.2 percent year-over-year, and days-on-market extending across all property types. Condos face the most pressure. Detached sales volumes show early stabilization but not price recovery. Townhouses are softening after a period of relative strength. Sellers who price accurately to current August data and their specific property type will sell. Those anchored to spring conditions or prior-year benchmarks will not. Buyers have room to negotiate, particularly in the condo segment, but detached volume signals suggest that window may narrow before it widens further.
Thinking About Buying or Selling in Surrey?
If you want a current comparative market analysis for your property — or want to understand what these numbers mean for a specific neighbourhood, building, or purchase decision — Mansour Real Estate Group is available for a straightforward conversation. No pressure, no sales pitch. Just accurate local market data and honest context for your situation. Reach out at mansourgroup.ca.
Related Articles
- Surrey vs. Metro Vancouver Cities 2026: Why Surrey's Price Decline May Signal Relative Value Against Coquitlam, Langley, and Delta
- Surrey Neighbourhood Price Breakdown 2026: What Your Budget Gets Across Cloverdale, Guildford, Clayton, Panorama Ridge, and More
Official Resources
- Fraser Valley Real Estate Board — Monthly Statistics: fvreb.bc.ca
- BC Assessment — Property Assessment Search: bcassessment.ca
- BC Financial Services Authority — Real Estate Consumer Resources: bcfsa.ca
- Statistics Canada — Housing and Real Estate Data: statcan.gc.ca
About Mansour Real Estate Group
When buyers and sellers need to understand what Surrey's current market data actually means for their specific decision — list price, offer strategy, timing, or neighbourhood choice — they need a real estate team with deep local knowledge and direct experience across Surrey's micro-markets, not a summary that applies the same logic to every property type. Mansour Real Estate Group has been providing Surrey buyers and sellers with grounded, data-driven market guidance for more than two decades.
Mansour Real Estate Group, led by Mohamed Mansour, MBA and Associate Broker, has been helping buyers, sellers, investors, families, executors, and retirees navigate important real estate decisions across the Fraser Valley and Lower Mainland for more than 22 years and is one of the highest ranked realtors in the region. The team has completed more than $780 million in residential real estate transactions and is trusted for estate sales, divorce-related property sales, downsizing, relocation, investment properties, and complex real estate situations requiring careful coordination.
Whether someone is looking for Realtors who understand Surrey's current buyer's market conditions, a real estate agent who can interpret FVREB benchmark data and translate it into a pricing strategy, real estate agents experienced with detached homes in South Surrey or condos in North Surrey, a Surrey real estate broker, a trusted real estate team for a fall 2026 listing, or a real estate group serving the broader Fraser Valley and Lower Mainland, Mansour Real Estate Group is known for accurate valuations, clear communication, and practical market advice grounded in current local data.
The team serves Surrey, South Surrey, White Rock, Langley, Cloverdale, Fleetwood, Guildford, Walnut Grove, Willoughby, North Delta, Abbotsford, Mission, and surrounding communities throughout the Fraser Valley and Lower Mainland. Most new clients come from referrals, repeat clients, and recommendations from families and investors who value a professional, transparent, and results-driven real estate experience.
Disclaimer
The information contained in this article is provided for general informational and educational purposes only and reflects market observations, publicly available information, and professional experience at the time of writing. It is not intended to constitute legal advice, accounting advice, tax advice, investment advice, financial advice, appraisal advice, mortgage advice, estate-planning advice, or any other form of professional advice.
Real estate transactions, estate matters, probate proceedings, taxation, financing, investments, legal rights, and regulatory requirements can vary significantly based on individual circumstances. Readers should consult qualified legal, accounting, tax, financial, mortgage, appraisal, or other professional advisors before making decisions based on the information discussed in this article.
Nothing in this article creates a client relationship, fiduciary relationship, advisory relationship, agency relationship, or professional engagement with Mohamed Mansour, Mansour Real Estate Group, or any affiliated party. Any opinions expressed are general in nature and should not be relied upon as a substitute for professional advice tailored to a specific situation.
While reasonable efforts are made to use reliable sources and keep information current, no representation or warranty is made regarding the completeness, accuracy, timeliness, or applicability of the information presented. Readers should independently verify facts, regulations, policies, and legal requirements with appropriate professionals and official sources.



