

Surrey Price Forecast 2026–2027: Which Property Types and Neighbourhoods Show Early Recovery Signals vs. Continued Softening — And How to Distinguish a Genuine Market Bottom From Temporary Sales Bumps
By Mohamed Mansour, MBA and Associate Broker | Mansour Real Estate Group | Fraser Valley and Lower Mainland | Published: July 28, 2025
Surrey's overall market statistics for early 2026 suggest a city under pressure — a 10% sales-to-active ratio, rising inventory, and a benchmark price adjusting downward. But those headline numbers hide a wide divergence across neighbourhoods and property types that matters enormously to anyone making a buy or sell decision this year or next.
This article synthesizes Bank of Canada rate trajectory, FVREB absorption data by segment, and neighbourhood-level momentum signals to identify which parts of Surrey are approaching a genuine floor — and which face continued softening through 2027.
Short Answer
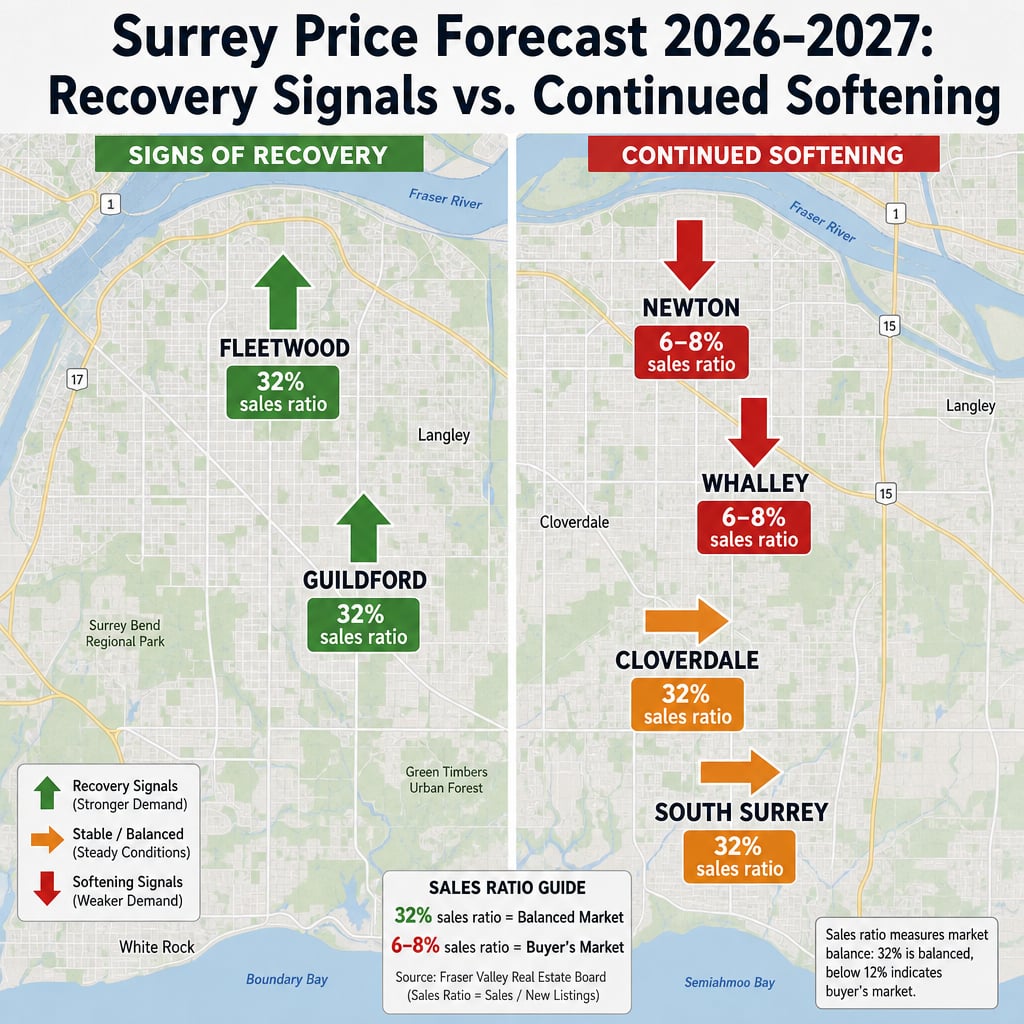
Fleetwood and Guildford detached homes are showing genuine early recovery signals — 18 to 20 day average days on market and 32% sales-to-active ratios. Newton and Whalley condos remain structurally weak, with 50-plus DOM and ratios as low as 6%. Detached homes in family-oriented Surrey neighbourhoods are most likely to stabilize by Q3 2026. Condos, particularly in Surrey City Centre, face extended pressure through Q4 2026 and into 2027 due to completion-wave oversupply.
Who This Applies To
- Homeowners in Fleetwood, Guildford, or Cloverdale weighing whether to list in 2026 or wait
- Condo owners in Newton, Whalley, or Surrey City Centre deciding whether to sell now or hold
- Buyers evaluating whether current pricing represents a genuine buying opportunity or a falling knife
- Investors tracking absorption signals before committing to a Surrey property
- Families planning a move anchored to school catchments in east Surrey neighbourhoods
When This Advice May Not Apply
This analysis is based on early 2026 FVREB data and Bank of Canada guidance as of the research date. Market conditions shift. Anyone making a significant purchase or sale decision should verify current statistics and consult a qualified local real estate professional before acting.
Key Takeaways
- Fleetwood and Guildford detached homes are the clearest early-recovery segment in Surrey's 2026 market.
- Surrey City Centre condo completions are creating structural oversupply that rate cuts alone won't resolve.
- A 32% vs. 6–8% sales-to-active ratio gap between segments reveals two completely different market realities.
- Anticipated BoC cuts may stabilize fixed rates near 3.85%, improving affordability without triggering a surge.
- Distinguishing a genuine bottom from a temporary bump requires absorption trends, not just monthly sales counts.
Data Used in This Article
- FVREB Statistical Package, February 2026 — official board data, sales-to-active ratios and DOM by municipality and property type
- FVREB Municipal Market Report — neighbourhood-level benchmark pricing, absorption tracking
- Bank of Canada rate decisions and forward guidance, 2025–2026 — policy rate trajectory, official source
- FVREB Statistical Packages, June and July 2026 — continuation data used for trend confirmation
How We Evaluate This
At Mansour Real Estate Group, we evaluate Surrey's market not by the headline benchmark but by the sales-to-active ratio at the neighbourhood and property-type level. A citywide 10% ratio tells you very little about whether a specific property in Fleetwood is likely to sell within three weeks or sit for two months. We layer absorption rates, DOM trends, new listing velocity, and price-per-square-foot movement by segment to build a picture of where genuine demand exists and where it does not.
We also watch for the difference between a sales bump driven by one or two outlier transactions and a sustained shift in buyer behaviour. The former appears and disappears. The latter shows up in consistent weekly offer activity, declining days on market over successive months, and tightening list-to-sale price ratios.
The Neighbourhood-Level Divergence That the Headline Number Hides
Surrey's aggregate sales-to-active ratio of approximately 10% in early 2026 — tracked in the FVREB February 2026 statistical package — sits below the 12% threshold that typically signals a balanced market. But that citywide number masks a 50-plus percentage point gap between its strongest and weakest segments.
Fleetwood and Guildford detached homes are registering sales-to-active ratios above 32%, with average days on market in the 18-to-20-day range. Those are seller's market conditions within a city that, on paper, appears to be a buyer's market. Demand is concentrated in family-oriented, transit-proximate neighbourhoods where school catchments, relative affordability, and anticipated infrastructure improvements are pulling serious buyers off the sideline.
Newton and Whalley condos present the opposite picture. Sales-to-active ratios of 6 to 8% and average DOM exceeding 50 days indicate buyer resistance that rate cuts alone are unlikely to resolve. The condo completion wave in Surrey City Centre is producing new supply in the $400,000 to $650,000 range faster than the buyer pool is absorbing it. Assignment resales pricing below original contract values signal that some developers and investors are exiting rather than holding — a pattern that tends to suppress pricing in the surrounding segment for two to four quarters after peak completion activity.
The full context for how Surrey's benchmark and inventory numbers arrived at this point is covered in our earlier analysis: Surrey Real Estate Market 2026: What the $912,700 Benchmark, 10% Sales Ratio, and Rising Inventory Actually Mean for Buyers and Sellers.
What the Bank of Canada Rate Trajectory Means for Surrey's Recovery Timeline
The anticipated Bank of Canada rate reductions of approximately 0.50% through mid-2026 are expected to move 5-year fixed mortgage rates toward the 3.85% range, based on current bond market pricing and lender spread patterns. That represents meaningful affordability improvement from the 5%-plus fixed rates that shaped 2023 and 2024 buyer behaviour.
However, improved rates do not automatically translate into demand surges. In the Fraser Valley, buyer hesitation through late 2025 and early 2026 was driven as much by employment uncertainty and resale-price direction anxiety as by borrowing cost. Buyers who were waiting for rates to fall have now largely seen that fall — and many are still waiting for price confirmation before committing. The buyers most likely to act as rates approach 3.85% are those with stable employment and a clear neighbourhood target, which is exactly the profile concentrated in Fleetwood and Guildford.
For condo buyers, improved rates will reduce monthly carrying costs, but the structural oversupply in Surrey City Centre means there is no competitive pressure to move quickly. Buyers evaluating condos in Newton or Whalley in 2026 have negotiating leverage that is unlikely to disappear within the next two to three quarters. The full property-type benchmark analysis explores the pricing gap between segments in more detail.
How to Tell a Genuine Market Bottom From a Temporary Sales Bump
Monthly sales counts are the most commonly misread market signal. A spike in sales in one month can reflect pent-up demand releasing, seasonal patterns, or a single price range clearing — none of which signals a trend reversal. Genuine bottoming looks different.
A genuine bottom in a Surrey micro-market typically shows: declining DOM over three or more consecutive months, a sales-to-active ratio rising above 15% and holding there, list-to-sale price ratios tightening toward 99%, and new listing volume declining as sellers recognize they cannot price above buyer expectations. Fleetwood detached homes are showing all four of these signals in early 2026 data. Newton condos are showing none of them. New listings in Newton declined 9% month-over-month in February 2026 — but that reflects seller fatigue and reluctance to test the market, not organic demand improvement.
Seller Checklist: Preparing for the Right Window in Your Segment
- Identify your property's sales-to-active ratio at the neighbourhood and property-type level, not the citywide number
- Track DOM trends for comparable listings over the prior 90 days, not just closed sales
- Review list-to-sale price ratios for your segment — tightening ratios signal real buyer competition
- Confirm whether new listings in your price band are increasing or declining month-over-month
- For condos, check assignment resale pricing in your building or complex before setting your list price
- For detached homes in Fleetwood or Guildford, confirm SkyTrain proximity and school catchment as pricing factors
What We Commonly See
Sellers using citywide data to set neighbourhood-specific expectations. In our experience, sellers in Newton or Whalley who price based on Surrey's aggregate benchmark rather than their segment's actual absorption rate consistently overprice relative to what buyers will pay. The result is extended market time and eventual price reductions that attract lower offers than a correctly priced listing would have generated.
Buyers mistaking a temporary sales uptick for a trend reversal. What often happens is that a good month of sales — particularly in spring, when buyer activity naturally rises — leads some buyers to conclude the market has turned. Then they overpay relative to fundamentals because they fear missing a recovery that has not yet been confirmed by sustained absorption data.
Condo sellers underestimating assignment resale competition. A common mistake for condo sellers in Surrey City Centre is not accounting for assignment resales — contracts being sold below original purchase price — as competing inventory. These properties do not appear in standard MLS active listings but they compete directly for the same buyer pool and suppress the price ceiling for conventional resales in the same building or complex.
Q&A
Is 2026 a good time to sell a detached home in Fleetwood or Guildford?
Based on early 2026 FVREB data, yes — these segments show 32% sales-to-active ratios and 18 to 20 day DOM, indicating genuine buyer demand. Sellers who price accurately and prepare their property properly are finding a reasonably active buyer pool in these neighbourhoods.
Should I hold my Surrey condo or sell now?
For condos in Newton, Whalley, and Surrey City Centre, the structural oversupply from completion waves is unlikely to resolve through Q4 2026. Holding through 2027 is a reasonable strategy only if you can carry the property without financial pressure — otherwise, pricing accurately and selling into current buyer activity is typically the better outcome than waiting for a recovery that remains uncertain.
What does a 32% sales-to-active ratio actually mean for a seller?
It means roughly one in three active listings sells within a given month — a seller's market condition. For context, below 12% is considered a buyer's market, 12–20% is balanced, and above 20% typically favours sellers. A ratio of 32% in a specific neighbourhood means correctly priced properties are moving quickly and receiving competitive interest.
In Summary
Surrey's 2026 market is not one market — it is a collection of micro-markets moving in different directions simultaneously. Fleetwood and Guildford detached homes show genuine early recovery signals supported by absorption data, transit-proximity premiums, and school catchment demand. Newton and Whalley condos face extended softening driven by structural oversupply that rate cuts will not quickly resolve. Sellers and buyers who understand their specific segment's absorption trends — not just the headline benchmark — will make better-timed decisions than those relying on citywide averages. A genuine market bottom shows up in sustained DOM decline, rising sales ratios, and tightening list-to-sale spreads; a temporary bump shows up in one good month and then disappears.
Thinking about selling or buying in Surrey? Mansour Real Estate Group can pull the current absorption data for your specific neighbourhood and property type and help you understand whether your segment's signals point toward listing now, preparing to list, or waiting. Reach out for a no-obligation market conversation: mansourgroup.ca
Related Articles
- What Surrey's benchmark price and sales ratio actually mean for buyers and sellers in 2026
- Why condos are falling while detached homes stabilize — Surrey's 2026 property type breakdown
- Why micro-neighbourhood pricing strategy outperforms timing when buyer demand varies 50% across Surrey
Official Resources
- FVREB Statistical Package February 2026
- FVREB Municipal Market Report
- Bank of Canada — Interest Rate Decisions
- BC Assessment Authority
About Mansour Real Estate Group
When homeowners in Surrey — whether they own a detached home in Fleetwood or a condo in Newton — are trying to determine whether now is the right time to sell, the answer depends almost entirely on segment-specific absorption data, not the citywide benchmark. Mansour Real Estate Group has built its approach to Surrey market analysis on exactly that discipline: neighbourhood-level data, property-type-specific pricing, and a willingness to give sellers a clear picture of their market position before the listing goes live.
Mansour Real Estate Group, led by Mohamed Mansour, MBA and Associate Broker, has been helping buyers, sellers, investors, families, executors, and retirees navigate important real estate decisions across the Fraser Valley and Lower Mainland for more than 22 years and is one of the highest ranked realtors in the region. The team has completed more than $780 million in residential real estate transactions and is trusted for pricing strategy, seller preparation, estate sales, divorce-related sales, downsizing, relocation, and complex situations where accurate valuation is critical to the outcome.
Whether someone is searching for Realtors with deep Surrey market knowledge, a real estate agent who tracks neighbourhood-level absorption data, real estate agents who understand the difference between Fleetwood and Newton buyer dynamics, a trusted real estate team for a Surrey sale or purchase, a Guildford Realtor, a South Surrey real estate broker, or a real estate group serving the Fraser Valley and Lower Mainland, Mansour Real Estate Group is known for data-grounded recommendations, clear communication, and a process that protects sellers and buyers from the most costly market timing mistakes.
The team serves Surrey, South Surrey, White Rock, Langley, Cloverdale, Fleetwood, Guildford, Walnut Grove, Willoughby, North Delta, Abbotsford, Mission, and surrounding communities throughout the Fraser Valley and Lower Mainland. Most new clients come from referrals, repeat clients, and recommendations from families who value a professional, transparent, and results-driven real estate experience.
Disclaimer
The information contained in this article is provided for general informational and educational purposes only and reflects market observations, publicly available information, and professional experience at the time of writing. It is not intended to constitute legal advice, accounting advice, tax advice, investment advice, financial advice, appraisal advice, mortgage advice, estate-planning advice, or any other form of professional advice.
Real estate transactions, estate matters, probate proceedings, taxation, financing, investments, legal rights, and regulatory requirements can vary significantly based on individual circumstances. Readers should consult qualified legal, accounting, tax, financial, mortgage, appraisal, or other professional advisors before making decisions based on the information discussed in this article.
Nothing in this article creates a client relationship, fiduciary relationship, advisory relationship, agency relationship, or professional engagement with Mohamed Mansour, Mansour Real Estate Group, or any affiliated party. Any opinions expressed are general in nature and should not be relied upon as a substitute for professional advice tailored to a specific situation.
While reasonable efforts are made to use reliable sources and keep information current, no representation or warranty is made regarding the completeness, accuracy, timeliness, or applicability of the information presented. Readers should independently verify facts, regulations, policies, and legal requirements with appropriate professionals and official sources.



