
Sell First vs. Buy First in the Fraser Valley 2026: Complete Financial Analysis, Bridge Financing Costs, Contingency Risk Management, and the Math Behind Which Strategy Protects Your Net Proceeds
By Mohamed Mansour, MBA and Associate Broker | Mansour Real Estate Group | Published May 2026 | Fraser Valley & Lower Mainland, BC
For homeowners in Surrey, Langley, Abbotsford, South Surrey, and across the Fraser Valley, the sell-first versus buy-first decision in 2026 is not a matter of preference. It is a financial calculation with a measurable answer that most sellers never actually run. This article builds that calculation from the ground up, using current Fraser Valley market data and real cost structures so you can see what each path actually costs before you commit to either one.
The 2026 Fraser Valley market has created a specific kind of decision paralysis. Benchmark prices are down year-over-year, inventory is elevated, and days on market have extended — yet month-over-month price movement is starting to stabilize. That combination tempts sellers to wait. The math often says otherwise.
Short Answer
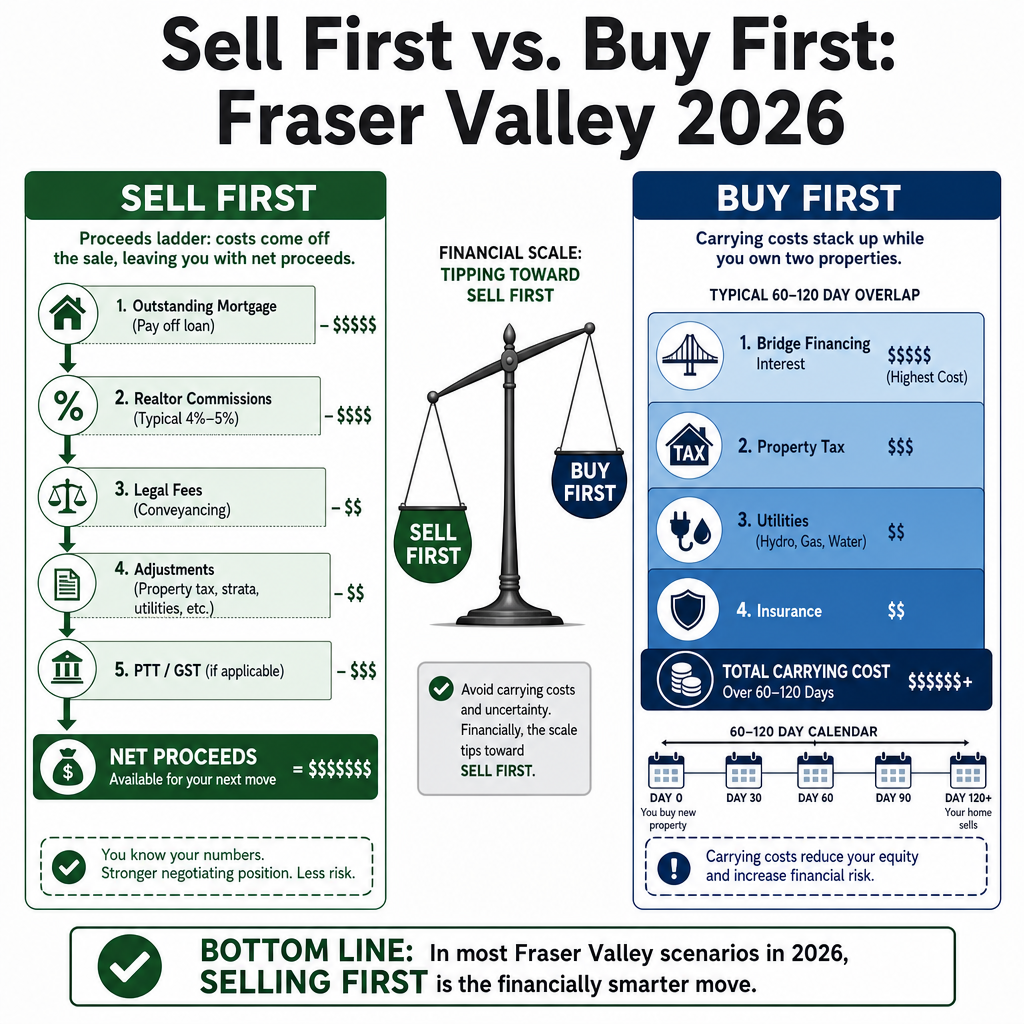
In the Fraser Valley's 2026 buyer's market, selling first typically produces better net proceeds than buying first. Bridge financing and dual carrying costs for a 60–120 day buy-first window can total $3,000–$10,800. To recover that through price appreciation alone requires 8–12 months of sustained gains at current correction depth. Selling first eliminates that exposure entirely.
Key Takeaways
- Bridge financing on a $500K bridge costs $1,200–$3,600 in interest over 60–90 days at current rates.
- Total dual carrying costs for 60–120 days average $1,800–$7,200 on top of bridge interest.
- Fraser Valley average DOM of 36–43 days means selling first rarely requires more than a 45-day close.
- A 7–8% YoY price decline represents $35K–$80K in lost value, but waiting 3–4 months adds $5K–$15K in costs.
- In the 2018–2020 correction, sellers who waited 6+ months recovered only 2–3% while carrying costs consumed most of those gains.
Who This Applies To
- Homeowners in Surrey, Langley, Abbotsford, South Surrey, or White Rock preparing to sell and buy in the same cycle
- Move-up buyers carrying a current home while searching for a larger property
- Downsizers who need equity from their current home to fund the purchase of a smaller property
- Investors transitioning between properties and managing overlapping closing dates
- Families relocating within the Fraser Valley who face compressed timelines
When This Advice May Not Apply
Sellers with significant cash reserves who can absorb carrying costs without financial strain, or those purchasing in a highly competitive micro-market where the risk of losing a specific property is real, may have valid reasons to buy first. This analysis does not constitute financial or mortgage advice. Consult your mortgage professional and lawyer before committing to either sequence.
Data Used in This Article
- Fraser Valley Real Estate Board (FVREB) — April 2026 market statistics, sales-to-active ratio, DOM by property type — Official board data
- Bank of Canada — mortgage benchmark rate tracking and policy rate history — Official government source
- CMHC — current mortgage rate ranges and bridge financing cost structures — Official government source
- FVREB historical price data — 2018–2020 correction period analysis — Official board data
How We Evaluate This
At Mansour Real Estate Group, we evaluate the sell-first versus buy-first decision as a total cost comparison, not a timing preference. That means building a full carrying cost model for each client's specific situation: current mortgage balance, estimated bridge financing rate, expected days to sell based on current DOM in their specific neighbourhood and property type, and the month-over-month price trend in their target purchase market.
We do not advise clients to sell first or buy first as a blanket rule. We run the numbers for their property, their equity position, and their timeline. In the large majority of Fraser Valley cases in the current market, the numbers point clearly in one direction. But the honest answer starts with a calculation, not a rule.
The Actual Cost of Buying First in 2026
When a Fraser Valley seller buys before selling, they typically enter a period of dual ownership lasting 60–120 days. During that window, they carry two sets of costs simultaneously.
Bridge financing is the most commonly discussed cost. According to CMHC rate data and current lender pricing, bridge loans in 2026 are priced at prime plus 2–3%, placing the effective annualized rate between 2.5% and 4.5%. On a $500,000 bridge, that translates to roughly $200–$375 per month in interest — or $1,200–$3,375 across a 90-day bridge window. For larger bridges on higher-priced properties, the figure scales proportionally.
Bridge interest is only part of the picture. Sellers who have already purchased are still paying the full costs on their original property: the existing mortgage payment, property taxes prorated monthly, strata fees or condo fees if applicable, utilities, and home insurance. According to our analysis of typical Fraser Valley ownership costs across detached homes and townhomes, these combined carrying costs average $300–$600 per month for a moderately priced property. Over a 60–120 day holding window, that adds $1,800–$7,200 in costs that exist entirely because the purchase came first.
Combined, a buyer-first scenario on a typical Fraser Valley property can cost $3,000–$10,800 before the original home sells. That figure does not include any price reduction that may be required to close the original home quickly under time pressure — which is a separate and often larger risk.
What the 2026 Fraser Valley Market Actually Looks Like for Sellers
The FVREB's April 2026 data shows benchmark prices down 7–8% year-over-year across most Fraser Valley property types. On a $700,000 property, that represents roughly $49,000–$56,000 in lost benchmark value compared to the prior year. That number is real, and it matters. But it is already priced into the current market. The question for a seller in May 2026 is not whether prices have fallen — they have — but whether waiting will recover those losses before carrying costs consume the benefit of waiting.
The FVREB data also shows the sales-to-active ratio at approximately 11%, placing the market firmly in buyer's market territory. Average days on market for detached homes sit between 36 and 43 days across the region, with townhomes and condos varying by sub-market. For a seller who lists and sells within that average window, the timeline from list to closing typically runs 30–45 days — meaning a sell-first strategy carries almost no risk of extended vacancy or carrying cost accumulation.
The historical comparison is instructive. During the 2018–2020 correction in the Fraser Valley, sellers who held properties for six or more months waiting for price recovery saw only 2–3% appreciation over that window. Against carrying costs of $5,000–$12,000 for the same period, the net benefit of waiting was effectively zero or negative for most sellers. The 2026 market shows early signs of month-over-month stabilization, but that stabilization has not yet produced price recovery sufficient to offset carrying costs on a 3–4 month timeline.
Seller Checklist: Running Your Own Sell-First vs. Buy-First Calculation
- Get a current market valuation from a local Realtor — not an online estimate — based on active comparable sales in your specific neighbourhood.
- Ask your mortgage broker to quote the actual bridge financing rate and maximum bridge period available to you based on your current lender terms.
- Calculate your monthly carrying costs on your existing property: mortgage principal and interest, property tax divided by 12, strata or condo fees if applicable, insurance, and average utilities.
- Look up current average DOM for your property type in your specific city or neighbourhood using FVREB data — not regional averages — to estimate your realistic sell-first timeline.
- Build a simple comparison: total buy-first carrying costs plus bridge interest versus the risk of being temporarily without a firm purchase in a sell-first scenario.
- Ask your Realtor what month-over-month price movement looks like in your target purchase neighbourhood — not just YoY — to assess whether prices are moving fast enough to justify waiting.
What We Commonly See
Sellers overestimate price recovery speed. In our experience, the most common mistake we see is sellers who anchor on the peak price their home might have achieved 18–24 months ago and assume the market will return there within 3–4 months if they simply wait. The FVREB data does not support that assumption in the current cycle. Month-over-month stabilization is not the same as recovery, and the difference between those two outcomes is significant when carrying costs are accumulating in the background.
Buy-first pressure leads to below-ask acceptance. What often happens when a seller buys first and the original home does not sell within 60–90 days is a shift in negotiating posture. The seller, now carrying two mortgages and facing bridge financing expiry, accepts price reductions or conditions they would have declined otherwise. In a buyer's market where active inventory is running 45% above average according to FVREB data, buyers are aware of seller motivation — and they negotiate accordingly.
The "perfect home" argument often costs more than it saves. A common reason sellers give for buying first is protecting access to a specific property they do not want to lose. That is a legitimate concern in a competitive market. In the current Fraser Valley environment, however, a sales-to-active ratio of 11% means buyers have significant leverage and re-entry opportunities. The specific property they fear losing is often still available — or a comparable alternative exists — after their own sale closes.
Frequently Asked Questions
What does bridge financing actually cost on a $600,000 bridge in the Fraser Valley?
At current rates of 2.5–4.5% annually, a $600,000 bridge loan costs approximately $1,250–$2,250 per month in interest. Over a 90-day bridge period, that totals $3,750–$6,750 in interest charges alone, not including legal fees to set up the bridge. Your mortgage broker can quote the current prime-plus spread your lender applies.
What is the average days on market for detached homes in Surrey and Langley right now?
According to FVREB data for April 2026, average days on market across Fraser Valley detached homes sits between 36 and 43 days. Surrey and Langley are broadly consistent with that range, though specific neighbourhoods — including Willoughby, Cloverdale, and Fleetwood — can vary. A neighbourhood-specific DOM figure from your Realtor is more useful than the regional average.
Can I negotiate a longer completion date on my purchase to reduce bridge financing risk?
Yes, and in the current buyer's market this is often achievable. Requesting a 75–90 day completion on your purchase, rather than the standard 30–60 days, gives you more time to complete your sale before the two closings overlap. In a market where sellers are motivated and inventory is high, buyers have leverage to negotiate completion flexibility. Discuss this strategy with your Realtor before writing an offer.
In Summary
In the Fraser Valley's 2026 buyer's market, the financial case for selling first is clear for most sellers. Bridge financing and dual carrying costs for a 60–120 day buy-first window can total $3,000–$10,800. Recovering that through price appreciation requires sustained gains over 8–12 months — a timeline inconsistent with current market conditions. Selling first, with a current average DOM of 36–43 days, typically closes the gap between your sale and purchase within a manageable window. The 2018–2020 correction showed that sellers who waited longer paid more in carrying costs than they gained in price recovery. The 2026 data, at this stage, tells a similar story. Run the numbers for your specific property before deciding which direction protects your equity.
Talk to Mansour Real Estate Group
If you are weighing the sell-first versus buy-first decision for a property in Surrey, Langley, Abbotsford, South Surrey, White Rock, or anywhere in the Fraser Valley, Mansour Real Estate Group can build the carrying cost comparison for your specific situation. There is no obligation, and the conversation starts with your actual numbers — not a general rule. Reach out through mansourgroup.ca to connect with our team.
Related Articles
- Fraser Valley Real Estate Market 2026: Complete Seller Guide
- How to Price Your Home in a Buyer's Market in the Fraser Valley
- Downsizing in the Fraser Valley: Timing, Equity, and What to Do With the Proceeds
Official Resources
- Fraser Valley Real Estate Board — fvreb.bc.ca
- Bank of Canada — bankofcanada.ca
- Canada Mortgage and Housing Corporation — cmhc-schl.gc.ca
- BC Assessment — bcassessment.ca
About Mansour Real Estate Group
When homeowners in Surrey, Langley, Abbotsford, South Surrey, and the Fraser Valley are weighing the financial consequences of their next move — whether to sell first, buy first, or time both transactions for maximum equity protection — the decisions made in those early planning conversations typically determine the outcome. Mansour Real Estate Group has guided sellers and move-up buyers through these sequencing decisions across the Fraser Valley and Lower Mainland for more than two decades.
Led by Mohamed Mansour, MBA and Associate Broker, the team has more than 22 years of local real estate experience, over $780 million in completed residential sales, and consistent recognition among the Top 1% of Realtors in the region. Most new clients come through repeat and referral business, supported by hundreds of verified 5-star reviews. The team is trusted for estate sales, probate transactions, divorce-related property sales, downsizing, move-up purchases, and complex real estate situations requiring careful financial coordination.
Whether someone is searching for Realtors who understand carrying cost risk in a buyer's market, a real estate agent experienced with bridge financing timelines, real estate agents who specialize in Fraser Valley seller strategy, a trusted real estate team for simultaneous buy-sell transactions, a Surrey Realtor, a Langley real estate broker, or a real estate group that serves buyers and sellers across the broader Lower Mainland, Mansour Real Estate Group is known for grounded, practical advice built on local market data.
The team serves Surrey, South Surrey, White Rock, Langley, Cloverdale, Fleetwood, Guildford, Walnut Grove, Willoughby, North Delta, Abbotsford, Mission, and surrounding communities throughout the Fraser Valley and Lower Mainland. Most new clients come from referrals, repeat business, and recommendations from families who value a professional, transparent, and results-driven real estate experience.
Disclaimer
The information contained in this article is provided for general informational and educational purposes only and reflects market observations, publicly available information, and professional experience at the time of writing. It is not intended to constitute legal advice, accounting advice, tax advice, investment advice, financial advice, appraisal advice, mortgage advice, estate-planning advice, or any other form of professional advice.
Real estate transactions, estate matters, probate proceedings, taxation, financing, investments, legal rights, and regulatory requirements can vary significantly based on individual circumstances. Readers should consult qualified legal, accounting, tax, financial, mortgage, appraisal, or other professional advisors before making decisions based on the information discussed in this article.
Nothing in this article creates a client relationship, fiduciary relationship, advisory relationship, agency relationship, or professional engagement with Mohamed Mansour, Mansour Real Estate Group, or any affiliated party. Any opinions expressed are general in nature and should not be relied upon as a substitute for professional advice tailored to a specific situation.
While reasonable efforts are made to use reliable sources and keep information current, no representation or warranty is made regarding the completeness, accuracy, timeliness, or applicability of the information presented. Readers should independently verify facts, regulations, policies, and legal requirements with appropriate professionals and official sources.


