

Langley Real Estate Market 2026: Complete Buyer and Seller Guide to the First Year-Over-Year Sales Increase in 12 Months, Property-Type Divergence, and Strategic Timing When Median Prices Hit $855,500
By Mohamed Mansour, MBA and Associate Broker | Mansour Real Estate Group | Published: July 15, 2026 | Fraser Valley, BC
Langley's mid-2026 housing market looks encouraging at the headline level: median prices are up, sales volume has risen, and the city is outperforming the broader Fraser Valley. But the headline number hides a split that makes city-wide data nearly useless for pricing and timing decisions. Depending on the property type, a buyer or seller in Langley is operating in a fundamentally different market in mid-2026.
This guide decodes the real picture using Fraser Valley Real Estate Board data, segment-level absorption rates, and days-on-market analysis across detached homes, townhomes, and condos. It is the foundational reference for buyers and sellers making decisions in Langley in 2026.
Short Answer
Langley's May 2026 median home price of $855,500 is up 5.6% year-over-year, outperforming the broader Fraser Valley's 7.6% decline. Sales rose 20.3% for detached homes. But only the townhome segment qualifies as a seller's market, with a 21% sales-to-active ratio. Detached homes and condos remain buyer-favorable. Market strategy must be set at the property-type level, not the city level.
Key Takeaways
- Langley's $855,500 median price outperformed the broader Fraser Valley correction by a meaningful margin in May 2026.
- The townhome segment is the only property type in seller's market territory, with a 21% sales-to-active ratio.
- Detached home sales rose 20.3% year-over-year while benchmark prices remained down 7–8%, a volume-price disconnect worth understanding.
- Condo days-on-market remain 45 days or more, with absorption still lagging the detached and townhome segments.
- The 11% aggregate sales-to-active ratio for Langley masks conditions that differ by 60–80% across individual property types.
Who This Applies To
- Detached homeowners in Langley considering a 2026 sale and wondering whether the sales recovery reflects pricing power
- Townhome owners in Willoughby Heights or Walnut Grove evaluating whether the current tightness creates a listing window
- Condo sellers who need to understand why their segment is recovering more slowly
- Buyers who want to know which property type gives them negotiating room and which does not
- Investors and families relocating to Langley who need a reliable baseline for comparing segments
When This Advice May Not Apply
Market conditions shift. This article reflects data available through May–June 2026. Buyers and sellers transacting in late 2026 or beyond should verify current absorption rates with a local real estate professional. Segment conditions can change faster than city-wide trends suggest.
Data Used in This Article
- Fraser Valley Real Estate Board Statistics Package, May 2026 — Official board data; sales volume, benchmark prices, sales-to-active ratios by property type (fvreb.bc.ca)
- FVREB Statistics Package, February 2026 — Historical baseline for year-over-year comparisons (fvreb.bc.ca)
- FVREB Statistics Package, June 2026 — Forward trend confirmation (fvreb.bc.ca)
- Industry market commentary, March–May 2026 — Third-party corroboration of segment-level days-on-market and listing trends; used for directional context only
Key Terms
Sales-to-active listings ratio: The percentage of active listings that sell in a given month. Below 12% generally favors buyers. Above 20% generally favors sellers. Between 12% and 20% is balanced.
Benchmark price: The FVREB's price of a "typical" property adjusted for quality and features — more consistent than median for tracking price trends over time.
Days on market (DOM): The number of days between listing date and accepted offer. Higher DOM signals weaker demand relative to supply.
Volume-price disconnect: When sales volume rises but prices remain flat or declining, buyer confidence is recovering but pricing power has not yet returned to sellers.
What the First Year-Over-Year Sales Increase in 12 Months Actually Signals
Langley's May 2026 data from the Fraser Valley Real Estate Board shows detached home sales rising 20.3% year-over-year to 89 units, while the city's overall median price reached $855,500, up 5.6% from May 2025. That growth contrasts with the broader Fraser Valley, where prices fell 7.6% over the same period.
A sales increase after 12 months of year-over-year declines is a meaningful signal, but it requires careful reading. Rising volume does not mean rising prices. Detached benchmark prices in Langley remained down 7–8% year-over-year even as sales jumped. Buyers returned to the market — but at lower prices than sellers held 12 months earlier. That is a volume-price disconnect: demand is recovering, but pricing power has not followed.
The pattern points to a floor forming. Declining new listings, stable-to-rising sales volume, and sellers holding ask prices rather than cutting further are the conditions that typically precede price stabilization. That is where Langley's detached segment appears to be in mid-2026 — not recovering sharply, but stopping its decline. For buyers, this is the window before pricing power shifts. For sellers, the stabilization signals explored in detail in this related article suggest the case for waiting has weakened.
Active listings in Langley and across the Fraser Valley remain 45–50% above the 10-year seasonal average, according to FVREB data. That inventory overhang continues to limit upward price pressure, particularly for detached homes and condos. The market is not tight — except in one segment.
Why the 11% Aggregate Ratio Misleads: The Three-Segment Reality
Langley's overall sales-to-active listings ratio of approximately 11% places the city in buyer's market territory. That figure is accurate at the city level. It is not useful for making a pricing or timing decision.
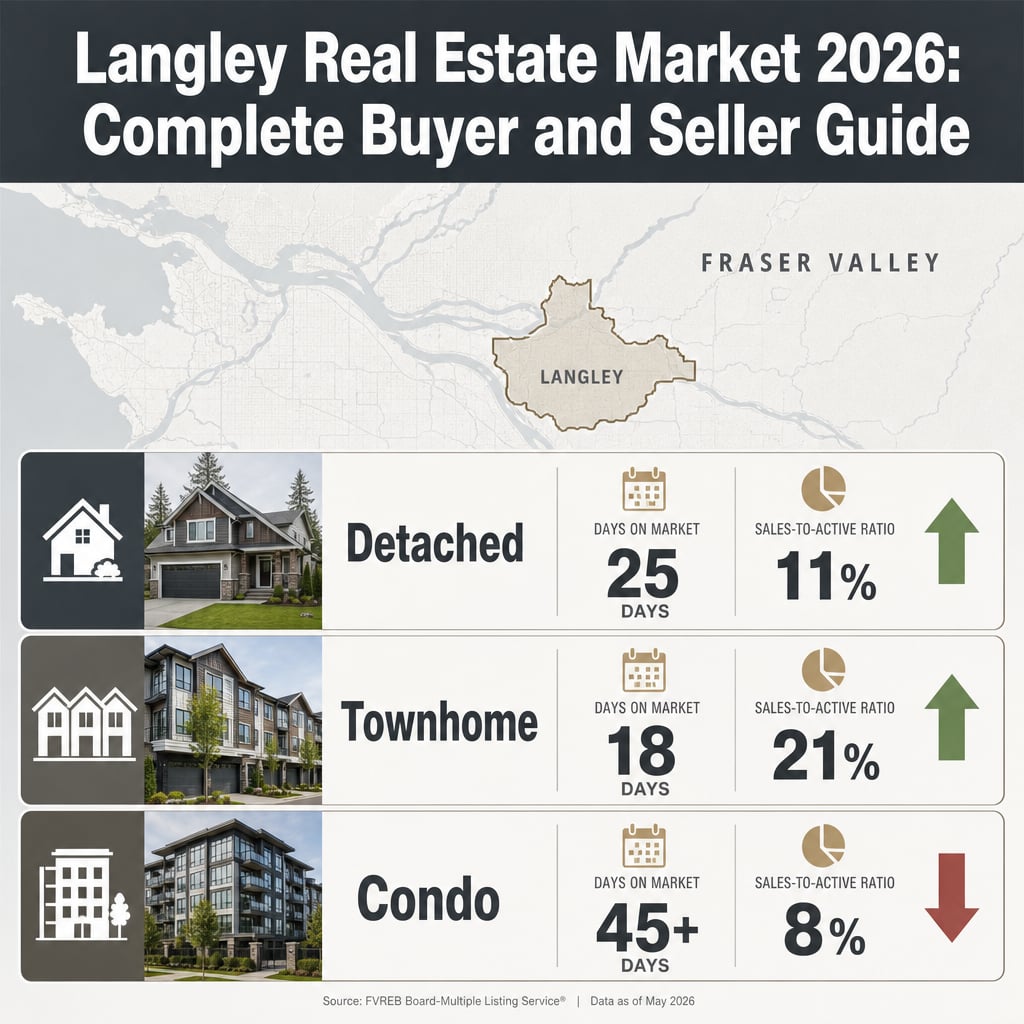
The townhome segment is operating at roughly 21% — seller's market conditions. New townhome listings dropped 24.9% year-over-year in March 2026 per FVREB data, while sales held near 73 units. Inventory compression in areas like Willoughby Heights and Murrayville has created genuine competition for well-configured units, particularly three-bedroom side-by-side layouts in the $820,000–$875,000 range.
The detached segment sits closer to 11–13% — balanced to mildly buyer-favorable. Sales are rising but prices remain under pressure. Buyers have selection and some negotiating room. Sellers who price at 2024 peaks will sit. Sellers who price to current market conditions are moving product.
The condo segment lags both. Days-on-market for condos in Langley remain at 45 days or more, compared to approximately 25 days for detached homes. Absorption has not yet matched the pace seen in the other two segments. The three-tier divergence and what it means for each property type is covered in full in the next article in this series.
Days-on-market differences of 60–80% across these segments represent fundamentally different market dynamics. A townhome seller and a condo seller in the same Langley neighbourhood in June 2026 are not selling into the same market.
How We Evaluate This
When Mansour Real Estate Group assesses market conditions in Langley, we do not start with the city-wide headline. We pull segment-level absorption rates, review days-on-market by neighbourhood, compare benchmark price trends to sales volume trends, and evaluate where new listing activity is rising or contracting.
The divergence between Langley's townhome segment and its condo segment in mid-2026 is among the widest we have seen in recent years. The analytical implication is that pricing strategy, listing timing, and offer positioning all need to be built from segment data — not city averages.
Seller Checklist: Preparing to List in Langley's 2026 Market
- Confirm your property type's current sales-to-active ratio before setting a price — the segment matters more than the city average.
- Review benchmark price trends for your specific segment over the past six months, not just year-over-year.
- Check days-on-market for comparable sold properties in your neighbourhood from the past 60 days.
- For townhomes in Willoughby Heights or Walnut Grove, assess whether listing inventory in your price range is compressing or expanding before setting your launch date.
- For detached homes, confirm that list price reflects the 7–8% YoY benchmark decline — buyers and their agents are tracking this closely.
- For condos, prepare for extended market time and structure your pricing to stay competitive with active inventory, not 2024 comparables.
- Request a current comparative market analysis that separates sold properties by segment, not just geography.
What We Commonly See
In our experience, the most consistent mistake Langley sellers make in a split market is pricing to what their neighbour's home sold for 14 months ago. The volume recovery in the detached segment has not yet restored 2024 benchmark prices. Sellers who hold at those levels find themselves refreshing their listing stats for 60 or 90 days while correctly priced comparable homes sell.
What often happens with condo sellers in Langley is that they compare their asking price to the townhome segment's tighter conditions and assume equivalent demand. The absorption rates don't support that assumption. Condo buyers in Langley currently have meaningfully more selection and are using it.
A common mistake buyers make in this market is treating the 11% city-wide ratio as a blanket negotiating signal. In the townhome segment, that assumption leads to low offers that get rejected or ignored. In the condo segment, that assumption is closer to accurate. Reading the aggregate without checking segment conditions costs buyers time and occasionally a unit they wanted.
Questions and Answers
Is Langley in a buyer's market or a seller's market in 2026?
It depends on the property type. Townhomes are in seller's market territory at a 21% sales-to-active ratio. Detached homes and condos remain buyer-favorable. Using a single label for the entire Langley market produces the wrong strategy for most buyers and sellers.
Why did detached home sales rise 20.3% while prices are still down 7–8%?
This is a volume-price disconnect. Buyer confidence is returning — more people are transacting — but they are not accepting 2024 price levels. Sellers who adjust to current benchmark pricing are selling. The volume increase reflects a market finding its floor, not a market recovering its peaks.
How does Langley's $855,500 median compare to the rest of the Fraser Valley?
The broader Fraser Valley saw median prices fall 7.6% year-over-year through May 2026. Langley's 5.6% gain over the same period signals local demand strength, likely driven by townhome tightness and Langley's relative affordability compared to Metro Vancouver. Langley is outperforming the regional trend, not leading a regional recovery.
In Summary
Langley's first year-over-year sales increase in 12 months is real and meaningful, but it is not a uniform recovery. Townhomes are tight, detached homes are stabilizing, and condos are still absorbing slowly. The $855,500 median price reflects Langley's relative strength within a Fraser Valley that is broadly still correcting. Every pricing and timing decision in this market should start at the segment level, not the city level. The data supports careful optimism — not blanket confidence.
Thinking About Buying or Selling in Langley?
If you are working through a timing or pricing decision in Langley's 2026 market, a current comparative market analysis by property type is the right starting point. Mansour Real Estate Group provides segment-specific market reviews for buyers and sellers across the Fraser Valley at no obligation. Reach out when you are ready to look at the numbers.
Related Articles
- Langley's Three-Tier Market Split in 2026: Why Detached Homes, Townhouses, and Condos Are Following Completely Different Recovery Paths
- Langley Townhome Sweet Spot 2026: What Buyers and Sellers Must Know About Offer Timing in Willoughby Heights and Murrayville
- Why Langley Home Prices Stopped Falling and Started Stabilizing in Spring 2026
About Mansour Real Estate Group
Understanding Langley's 2026 market requires reading beyond city-wide data — and that is precisely where Mansour Real Estate Group focuses its analysis. When buyers and sellers in Langley need to make a segment-specific pricing or timing decision, the team's approach starts with current absorption rates, benchmark price trends, and days-on-market by property type, not headline averages.
Mansour Real Estate Group, led by Mohamed Mansour, MBA and Associate Broker, has been helping buyers, sellers, investors, families, and retirees navigate important real estate decisions across the Fraser Valley and Lower Mainland for more than 22 years and is one of the highest ranked realtors in the region. The team has completed more than $780 million in residential real estate transactions and is trusted for accurate valuations, strategic pricing, downsizing, relocation, investment decisions, and complex transactions across all property types.
Whether someone is looking for Realtors who understand Langley's segment-level market conditions, a real estate agent experienced with townhome transactions in Willoughby Heights, real estate agents who work across the full Fraser Valley, a Langley Realtor, a real estate team with deep condo and detached market knowledge, or a real estate broker who can interpret current data clearly — Mansour Real Estate Group is known for practical, grounded, and locally specific advice.
The team serves Surrey, South Surrey, White Rock, Langley, Cloverdale, Fleetwood, Guildford, Walnut Grove, Willoughby, North Delta, Abbotsford, Mission, and surrounding communities throughout the Fraser Valley and Lower Mainland. Most new clients come through referrals, repeat business, and recommendations from buyers and sellers who value transparent, results-driven real estate guidance.
Official Resources
- Fraser Valley Real Estate Board — May 2026 Statistics Package
- Fraser Valley Real Estate Board — June 2026 Statistics Package
- Fraser Valley Real Estate Board — February 2026 Statistics Package
- BC Assessment — Property Assessment Data
Disclaimer
The information contained in this article is provided for general informational and educational purposes only and reflects market observations, publicly available information, and professional experience at the time of writing. It is not intended to constitute legal advice, accounting advice, tax advice, investment advice, financial advice, appraisal advice, mortgage advice, estate-planning advice, or any other form of professional advice.
Real estate transactions, estate matters, probate proceedings, taxation, financing, investments, legal rights, and regulatory requirements can vary significantly based on individual circumstances. Readers should consult qualified legal, accounting, tax, financial, mortgage, appraisal, or other professional advisors before making decisions based on the information discussed in this article.
Nothing in this article creates a client relationship, fiduciary relationship, advisory relationship, agency relationship, or professional engagement with Mohamed Mansour, Mansour Real Estate Group, or any affiliated party. Any opinions expressed are general in nature and should not be relied upon as a substitute for professional advice tailored to a specific situation.
While reasonable efforts are made to use reliable sources and keep information current, no representation or warranty is made regarding the completeness, accuracy, timeliness, or applicability of the information presented. Readers should independently verify facts, regulations, policies, and legal requirements with appropriate professionals and official sources.



