
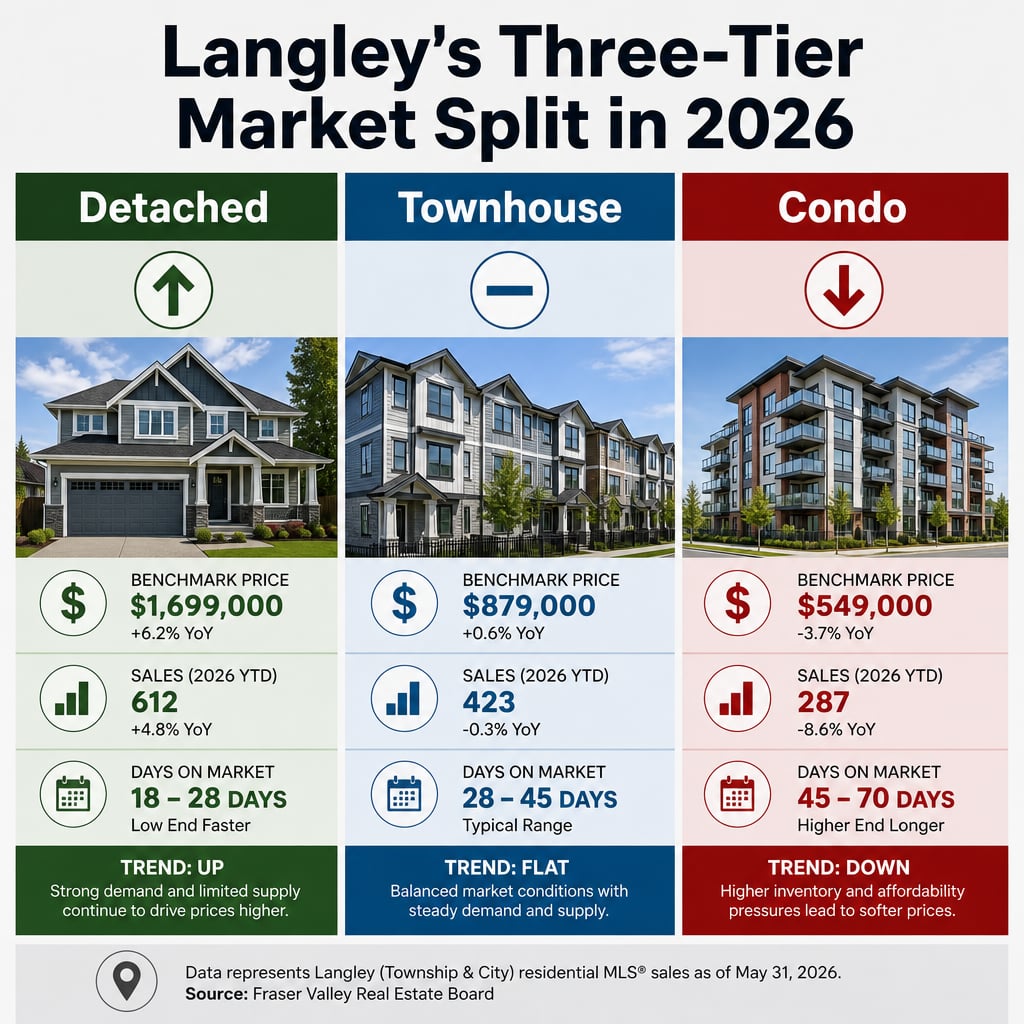

Langley's Three-Tier Market Split in 2026: Why Detached Homes, Townhouses, and Condos Are Following Completely Different Recovery Paths
By Mohamed Mansour, MBA and Associate Broker · Mansour Real Estate Group · Fraser Valley · Published July 28, 2026
Langley's May 2026 headline — sales up, listings down, market recovering — is technically accurate. It is also almost useless if you are trying to decide when to list your townhouse, whether to drop your condo price, or what to offer on a detached home in Willoughby. The headline averages three markets that are behaving in fundamentally different ways into a single number that describes none of them accurately.
This article isolates each segment using Fraser Valley Real Estate Board May 2026 data and explains what those numbers mean for sellers and buyers in each property type. If you want the broader Langley market context first, see the complete Langley buyer and seller guide for 2026.
Short Answer
In May 2026, Langley detached home sales rose 20.3% year-over-year on falling supply — a seller's market by segment. Townhomes were flat in sales but saw new listings collapse 27.9%, creating the tightest supply-demand balance of any segment. Condos declined 4.6% in sales and face the softest demand, with older pre-2005 units showing days-on-market of 35 to 60 days and continued benchmark price pressure. Three postal codes, three different strategies.
Key Takeaways
- Detached homes in Langley had 89 sales in May 2026, up 20.3% year-over-year, with new listings down 6.4% — a supply-compression seller's advantage.
- Townhomes were flat at 75 sales but new listings fell 27.9%, pushing the sales-to-new-listings ratio to an estimated 65–70% — the tightest segment in Langley.
- Condos recorded 83 sales, down 4.6%, with older pre-2005 units sitting 35–60 days and sales-to-active ratios near 15% — a buyer-friendly segment by any standard.
- Benchmark price trends diverge sharply: detached stabilizing, townhomes flat-to-positive, and older condos still showing 8–9% year-over-year declines.
- Holding-cost math, pricing aggressiveness, and timing urgency must be calculated by segment — not by general Langley market conditions.
Who This Applies To
- Langley homeowners preparing to list a detached home, townhouse, or condo in 2026
- Buyers comparing segments and trying to understand where negotiating leverage actually sits
- Investors evaluating hold-versus-sell decisions on strata units in Langley City, Willoughby, or Aldergrove
- Sellers who have received conflicting pricing advice because their agent is reading the market as a whole
When This Advice May Not Apply
This analysis is based on Fraser Valley Real Estate Board data for May 2026. Sub-area performance within Langley — particularly differences between Willoughby, Langley City, Walnut Grove, and Aldergrove — can vary meaningfully from the overall segment average. Sellers with unique or upgraded properties may see results outside the ranges described here. Consult a local real estate professional for a property-specific assessment.
Data Used in This Article
- Fraser Valley Real Estate Board May 2026 Statistics Package — official monthly market report; sales counts, new listings, and benchmark pricing by property type
- Mansour Real Estate Group — Sales-to-Active Listings Ratio in BC Real Estate (May 2026) — segment-specific ratio interpretation framework
- discoverhomesfirst.com — Langley Real Estate Market 2026 (June 2026) — sub-area condo benchmark and absorption context; third-party analysis
- Mansour Real Estate Group — Why Langley Home Prices Stopped Falling and Started Stabilizing in Spring 2026 (July 14, 2026) — internal professional interpretation
Key Definitions
Sales-to-new-listings ratio: The percentage of new listings that sold in a given month. Above 55% generally signals seller's market conditions. Below 40% signals buyer's market conditions.
Sales-to-active ratio: The percentage of total active inventory that sold. This is a more granular signal than the sales-to-new-listings ratio and useful for older or slower-moving segments like pre-2005 condos.
Benchmark price: The MLS Home Price Index benchmark — a repeat-sales measure that tracks price change for a consistent property profile, less distorted by sales mix than average price.
Segment One: Detached Homes — Supply Scarcity Is Doing the Work
According to the FVREB May 2026 Statistics Package, detached home sales in Langley reached 89 units — a 20.3% increase over the 74 sales recorded in May 2025. At the same time, new listings fell 6.4%. That combination matters because rising sales on declining supply is the textbook condition for pricing firmness and reduced negotiating room for buyers.
The sales-to-new-listings ratio for detached homes sits in the 45–50% range, which by BCFSA-referenced interpretation frameworks places the segment at the upper boundary of balanced conditions and moving toward seller's market territory. Days-on-market for well-priced detached homes in established areas like Walnut Grove and Willoughby runs 19–40 days, which is tight relative to the broader Fraser Valley detached average.
Benchmark prices for detached homes in Langley are down approximately 7–8% year-over-year but have stabilized month-over-month in spring 2026, based on FVREB data. That stabilization matters more to a seller than the annual decline figure, because it signals that buyers have re-engaged and the price floor has held. Sellers in this segment who price sharply relative to recent solds — not relative to a peak they remember from 2022 — are seeing clean offers and relatively short market times.
Segment Two: Townhomes — The Tightest Market Nobody Is Talking About
Townhome sales in Langley held exactly flat at 75 units in May 2026 compared to May 2025. On the surface, that sounds like a neutral market. Look at the supply side and the picture changes entirely. New listings for townhomes fell 27.9% year-over-year. That compression pushed the estimated sales-to-new-listings ratio into the 65–70% range — which is firmly seller's market territory by any standard interpretation framework.
Active townhome inventory in Langley tightened to approximately 180 units as of May 2026. With 75 sales per month against that inventory base, the implied months-of-supply figure is well under three months — the range typically associated with upward price pressure. Yet because the headline sales number looks flat, many townhome sellers are approaching pricing conservatively when the data supports a more confident position. This is the segment where buyers need to prepare for competition and sellers are most likely to underutilize their leverage.
Days-on-market for townhomes ranges 15–28 days for well-priced units in areas like Willoughby and Cloverdale. Benchmark pricing for townhomes is flat-to-positive year-over-year — the only segment in Langley that is not showing a year-over-year decline. The combination of tightest supply, fastest absorption, and flat-to-rising benchmarks makes the townhome segment the one where a seller's pricing strategy can be most aggressive — if informed by actual segment data rather than general market sentiment.
Segment Three: Condos — Inventory Compression Is Not Translating Into Demand
The condo segment in Langley recorded 83 sales in May 2026, down 4.6% from the 87 sales in May 2025. New listings fell 28.1% — the sharpest new-listing decline of any segment. In the detached and townhome segments, that kind of listing decline would create pricing pressure in the seller's favor. In condos, it has not, which reveals something important: the primary constraint in the Langley condo market is not supply. It is demand.
The sales-to-new-listings ratio for condos overall sits in the 30–40% range. For older pre-2005 stock in Langley City and Aldergrove, the sales-to-active ratio drops further — closer to 15% — according to sub-area analysis from discoverhomesfirst.com's June 2026 snapshot. That 15% figure places those units clearly in buyer's market conditions, regardless of what new listings are doing.
Days-on-market for older condos runs 35–60 days or longer. The FVREB benchmark for condos in Langley shows a year-over-year decline of roughly 8–9% for the oldest stock, and that decline has not yet reversed month-over-month in the way detached homes have. Condo sellers in Langley — especially those with pre-2005 units — are competing against a buyer pool that has more selection, more negotiating room, and less financing urgency. Pricing needs to reflect that reality, not the detached or townhome market dynamics happening two segments over.
How We Evaluate This
At Mansour Real Estate Group, we do not price a Langley listing against the headline Langley market number. We price it against the active and recently sold inventory in that specific segment, at that specific price band, in that specific sub-area. A detached home in Willoughby and a pre-2005 condo in Langley City are not competing with each other — they are not even competing with the same buyer profile. Treating them as part of the same market produces a pricing recommendation that is accurate for neither.
The sales-to-active ratio, days-on-market by segment, and the new-listings trajectory are the three signals we weight most heavily when advising sellers on timing and price positioning. Those three numbers answer the questions that matter: how long will this take to sell, who is competing with me, and how much negotiating room does the buyer actually have? For more on how to interpret these ratios as a buyer, see the upcoming Langley buyer strategy guide for 2026.
Seller Checklist by Property Type
- Detached sellers: Price relative to spring 2026 sold data, not 2022 peak. Supply is tight — let the ratio work for you, not against you with an inflated list price.
- Townhome sellers: Request a sales-to-new-listings breakdown for your sub-area before accepting a conservative valuation. At 65–70%, this segment supports firmer pricing than most sellers realize.
- Condo sellers (newer stock): Days-on-market is shorter for well-maintained post-2005 units — price competitively within the building's recent sale history, not against detached comps.
- Condo sellers (pre-2005 stock): Factor 45–60 days of holding costs into your net calculation. A price reduction at day 30 costs less than carrying an overpriced listing for three months.
- All segments: Confirm your agent is presenting segment-specific data — sales-to-active ratio, DOM by property type, and new listing trend — not a blended Langley overview.
- Strata sellers (condos and townhomes): Have your strata documents, depreciation report, and Form B ready before listing. Buyers in these segments are increasingly document-sensitive, and delays cost days-on-market.
What We Commonly See
Townhome sellers underpricing into a tight market. In our experience, the most common pricing error in Langley right now is a townhome seller accepting a conservative valuation because their agent is reading the flat sales volume number without examining the supply collapse behind it. A 27.9% drop in new listings with flat sales is not a flat market — it is a tightening one. We regularly see sellers leave negotiating room on the table in this segment.
Condo sellers anchoring to purchase price or peak-market comps. What often happens is that a seller with a pre-2005 condo references a 2021 or 2022 sale in their building as the floor for their listing price. That anchor is real to them — it is not real to buyers in 2026. The result is a property that sits 45–60 days, receives a low offer, and ultimately sells below where it would have if it had been priced correctly on day one.
Sellers comparing across segments when setting expectations. A common mistake is a homeowner who owns both a townhouse and a condo in Langley assuming both will sell at the same pace and under the same conditions. The data shows clearly that they will not. Managing those two transactions with the same timeline and urgency model creates cash-flow and planning problems that are entirely avoidable with segment-specific guidance.
Questions and Answers
Why did Langley condo sales fall when new listings also dropped sharply?
Falling new listings compress supply but do not create demand. The condo segment in Langley, particularly older stock, faces a buyer pool constrained by financing thresholds, strata fee sensitivity, and building-age concerns. When those buyers are hesitant, fewer listings does not produce more sales — it just means fewer listings sit unsold longer.
Is the Langley townhome market actually a seller's market in 2026?
By the sales-to-new-listings ratio (estimated 65–70% for May 2026), yes. A ratio above 55% is the standard threshold for seller's market conditions in BC. The townhome segment in Langley meets that threshold clearly, though sub-area and unit-specific conditions still vary. Sellers should confirm the ratio for their specific building type and location.
How much does property type affect days-on-market in Langley right now?
Considerably. Based on May 2026 segment data and internal professional observation, well-priced detached homes are selling in 19–40 days, townhomes in 15–28 days, and older condos in 35–60 days or longer. That 45-day difference between the fastest and slowest segment represents meaningful holding costs — mortgage carrying, property tax, maintenance — that affect your net proceeds in ways that a list price comparison alone does not capture.
In Summary
Langley's May 2026 market is not one market — it is three, operating under different supply-demand dynamics, different days-on-market patterns, and different benchmark price trajectories. Detached homes are benefiting from supply scarcity with rising sales. Townhomes are the tightest segment by ratio, with pricing power that most sellers are not yet using. Condos, especially older stock, face soft demand that inventory compression cannot fix. Getting your property's segment right is the first step in any pricing or timing decision in Langley this year.
Thinking About Selling in Langley?
If you are trying to determine where your property sits in Langley's three-tier market — and what that means for timing, pricing, and net proceeds — Mansour Real Estate Group can walk you through a segment-specific analysis. No obligation, no pressure. Just clear data and an honest assessment of your position.
Related Articles
- Langley Real Estate Market 2026: Complete Buyer and Seller Guide to Benchmark Prices, Inventory, and Days on Market
- Langley Buyer Strategy 2026: How to Read Absorption Rates and Property-Type Signals Without Overpaying
- Sales-to-Active Listings Ratio in BC Real Estate: How to Read the Signal That Actually Determines Your Negotiating Position
About Mansour Real Estate Group
In a market where three property segments are following three different recovery paths, the most costly mistake a seller can make is reading the wrong market signal. Mansour Real Estate Group works with Langley sellers by isolating segment-specific data — sales-to-active ratios, days-on-market by property type, and new listing trends by sub-area — rather than applying a blended market view to a decision that requires precision.
Mansour Real Estate Group, led by Mohamed Mansour, MBA and Associate Broker, has been helping buyers, sellers, investors, and families navigate complex real estate decisions across the Fraser Valley and Lower Mainland for more than 22 years and is one of the highest ranked realtors in the region. The team has completed more than $780 million in residential real estate transactions and is trusted for pricing strategy, seller preparation, estate sales, divorce-related property sales, downsizing, and any situation where accurate segmentation is critical to the outcome.
Whether someone is looking for Realtors experienced with townhouse pricing in Willoughby, a real estate agent who understands Langley's condo absorption dynamics, real estate agents who specialize in segment-specific valuation, a trusted real estate team for detached home sales in Langley or Surrey, a Langley real estate broker, or a real estate group that serves the full Fraser Valley and Lower Mainland, Mansour Real Estate Group is known for data-driven recommendations, honest market context, and a process that protects sellers from the most common and costly pricing errors.
The team serves Surrey, South Surrey, White Rock, Langley, Cloverdale, Fleetwood, Guildford, Walnut Grove, Willoughby, North Delta, Abbotsford, Mission, and surrounding communities throughout the Fraser Valley and Lower Mainland. Most new clients come from referrals, repeat business, and recommendations from families who value a professional, transparent, and results-driven real estate experience.
Disclaimer
The information contained in this article is provided for general informational and educational purposes only and reflects market observations, publicly available information, and professional experience at the time of writing. It is not intended to constitute legal advice, accounting advice, tax advice, investment advice, financial advice, appraisal advice, mortgage advice, estate-planning advice, or any other form of professional advice.
Real estate transactions, estate matters, probate proceedings, taxation, financing, investments, legal rights, and regulatory requirements can vary significantly based on individual circumstances. Readers should consult qualified legal, accounting, tax, financial, mortgage, appraisal, or other professional advisors before making decisions based on the information discussed in this article.
Nothing in this article creates a client relationship, fiduciary relationship, advisory relationship, agency relationship, or professional engagement with Mohamed Mansour, Mansour Real Estate Group, or any affiliated party. Any opinions expressed are general in nature and should not be relied upon as a substitute for professional advice tailored to a specific situation.
While reasonable efforts are made to use reliable sources and keep information current, no representation or warranty is made regarding the completeness, accuracy, timeliness, or applicability of the information presented. Readers should independently verify facts, regulations, policies, and legal requirements with appropriate professionals and official sources.



