
Langley Home Price Stabilization Signals in 2026: How to Distinguish Between False Recoveries and Genuine Market Inflection Points When Year-Over-Year Declines Mask Month-Over-Month Momentum
By Mohamed Mansour, MBA, Associate Broker — Mansour Real Estate Group | Fraser Valley & Lower Mainland, BC | Published: July 14, 2025 | Topic: Market Insight — Langley Seller Strategy
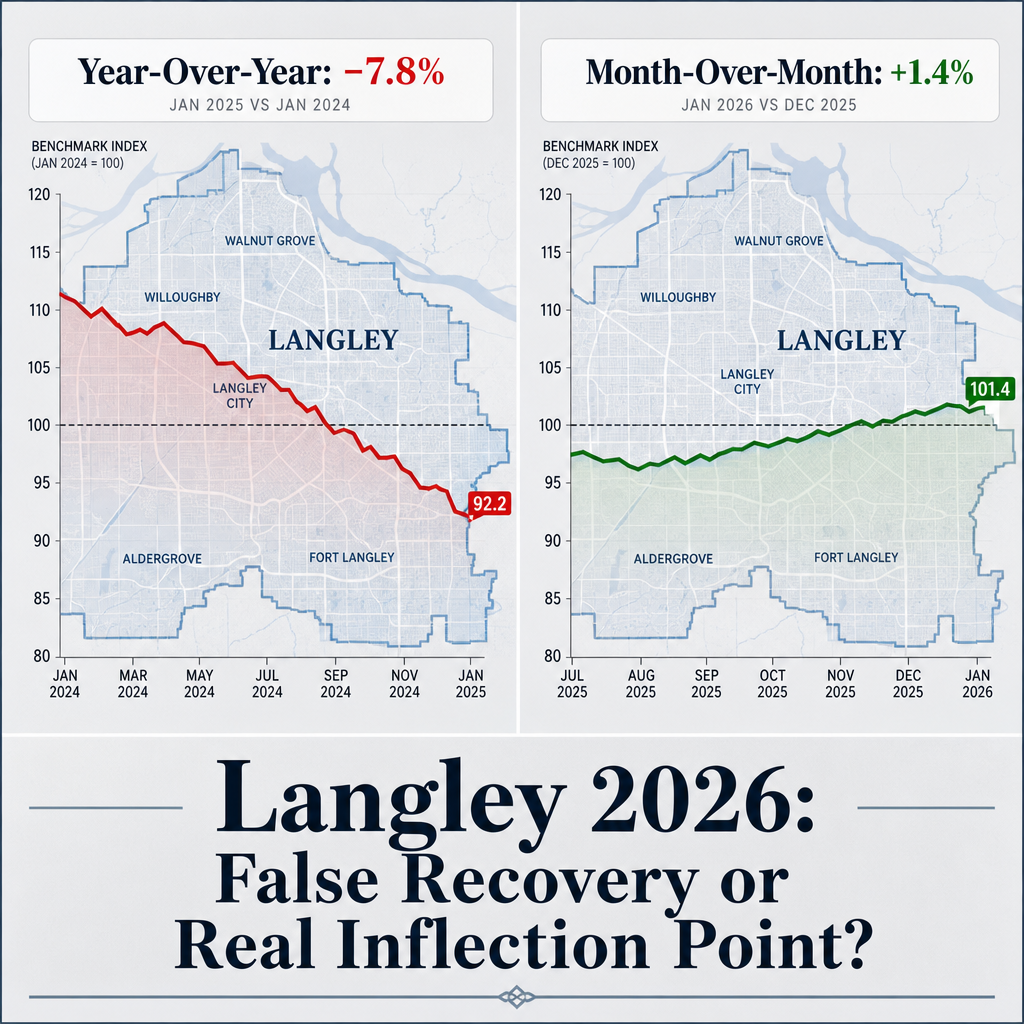
Langley sellers in 2026 are looking at two sets of numbers that seem to contradict each other. Year-over-year benchmark prices are down 7 to 8 percent. Month-over-month, prices have quietly gained ground for two to three consecutive months. Both numbers are real. Understanding which one should drive your decision is the practical challenge this article addresses.
This is not a theoretical question. Sellers who anchor to the year-over-year loss overprice and sit. Sellers who overweight a short run of monthly gains sometimes move too early and leave equity on the table. The goal here is a clear, repeatable framework for reading both signals at once — and knowing when the data actually supports action.
Short Answer
In early 2026, Langley's housing market is showing early stabilization signals — not confirmed recovery. Two to three months of month-over-month price gains, combined with a 7 percent year-over-year volume rebound, suggest the market may be approaching a floor. Detached homes are recovering faster than condos. Whether this constitutes a genuine inflection point depends on four indicators: sales-to-active ratio, days on market trend, price reduction frequency, and volume consistency over at least four consecutive months.
Key Takeaways
- Year-over-year declines of 7–8% can coexist with month-over-month gains — both figures are accurate and non-contradictory.
- Two to three months of monthly gains is a stabilization signal, not a confirmed recovery trend.
- Detached homes in Langley are recovering faster than condos — property type determines your actual timeline.
- Sales volume recovering while prices remain soft is a classic early-stage recovery pattern worth tracking carefully.
- Four consecutive months of month-over-month gains, alongside a rising sales-to-active ratio, is the more reliable confirmation signal.
Who This Applies To
- Langley homeowners considering listing in 2026 who are uncertain whether to act now or wait
- Sellers watching year-over-year price reports and feeling discouraged despite recent momentum
- Owners of detached homes in Willoughby, Walnut Grove, or Murrayville evaluating their timing window
- Langley condo owners trying to understand why their segment is recovering more slowly
- Anyone who sold a Langley property recently and is assessing whether they timed the market correctly
When This Advice May Not Apply
This framework is most useful during transitional market phases. If you are selling due to a firm life event — estate settlement, divorce, job relocation — the timing analysis here is secondary to your legal or financial timeline. Consult a qualified professional before treating market signals as the primary driver of a decision that has legal or financial deadlines.
Data Used in This Article
- Fraser Valley Real Estate Board — Monthly sales data, January through April 2026. Official board statistics. Benchmark prices, sales volumes, and days-on-market figures by property type.
- BC Real Estate Association — Q1 2026 market report. Regional price trend analysis and year-over-year comparisons.
- Mansour Real Estate Group — Internal Langley transaction analytics. Professional interpretation of local patterns across detached, townhome, and condo segments.
Why Year-Over-Year and Month-Over-Month Tell Different Stories
Year-over-year comparisons measure a property's current benchmark price against the same month twelve months earlier. In a market that peaked in spring 2024 and softened through mid-2025, a year-over-year figure in early 2026 will still look negative even if the market has been quietly improving for several months. The comparison period is dragging the number down.
Month-over-month comparisons capture what is happening right now, in the current selling environment. According to Fraser Valley Real Estate Board monthly data from January through April 2026, Langley benchmark prices showed gains in at least two consecutive months during this window — a meaningful signal after a prolonged softening period. The BCREA's Q1 2026 market report corroborates the volume recovery trend, noting that sales activity in the Fraser Valley rose approximately 7 percent year-over-year despite benchmark price pressure.
Neither number lies. They are measuring different things. The seller's job is to understand which one reflects the current direction of the market — and which one is still describing where the market has been.
The Detached and Condo Split — Why Property Type Changes the Answer
One of the most important findings from FVREB data in early 2026 is that Langley's recovery is not uniform. Detached home sales velocity has outpaced condos by roughly 40 to 60 percent in recent months. In practical terms, this means a detached homeowner in Willoughby or Walnut Grove is operating in a meaningfully different market than a condo owner in the same postal code.
Days on market in the detached segment has been running 25 to 35 days in active price ranges, while condos in Langley have been sitting 45 to 60 days in comparable scenarios. That gap reflects buyer demand patterns, financing constraints on higher-density properties, and a strata-specific hesitation tied to depreciation reports and special levy risk. Sellers treating Langley as a single market and drawing a single conclusion about timing are working with incomplete information.
If you own a condo in Langley and are comparing your situation to detached price news, the recovery timeline you are reading about may not apply to your property for another one to three quarters. The condo segment requires its own analysis before drawing conclusions about timing.
How We Evaluate This
At Mansour Real Estate Group, when a seller asks whether the market has turned, we do not answer with a single price index. We look at four indicators simultaneously: the sales-to-active listings ratio for that property type in that price band, the direction of days on market over the trailing three months, the frequency of price reductions on comparable active listings, and whether sales volume is holding or retreating after the initial rebound.
Two or three months of month-over-month gains with only partial support from these other indicators suggests stabilization, not a confirmed floor. Four consecutive months of gains, a sales-to-active ratio above 15 to 17 percent in the relevant segment, and a declining price-reduction frequency together form a more defensible case that the inflection point has arrived. We use this four-indicator approach because it reduces the risk of acting on seasonal noise — spring markets in the Fraser Valley routinely produce short-term price increases that reverse by summer.
Seller Checklist: Evaluating Langley Market Signals Before You List
- Confirm whether month-over-month gains have persisted for at least three consecutive months in your property type — not just the overall Langley benchmark.
- Check the current sales-to-active listings ratio for detached or condo specifically. A ratio above 15% favours sellers; below 12% favours buyers.
- Track days on market for comparable sold properties over the last 60 days. A declining trend signals real demand improvement.
- Count the frequency of price reductions on currently active comparable listings. High reduction frequency signals the market has not absorbed current asking prices yet.
- Ask your agent for the list-to-sale price ratio on recent Langley comparables. Ratios consistently above 98% suggest the market is no longer discounting aggressively.
- Separate your spring-season read from the underlying trend. Fraser Valley spring markets often lift prices temporarily — confirm whether volume is also rising, not just prices.
What We Commonly See
Anchoring to peak benchmarks. In our experience working with Langley sellers in transitional markets, the most common mistake is pricing based on what the home would have sold for in early 2024. Buyers in 2026 are working from current data and current financing costs. A price anchored to the prior peak will sit — and sitting creates a perception problem that is harder to recover from than pricing accurately at the outset.
Mistaking seasonal lift for structural recovery. What often happens is that a seller lists in March after seeing two months of price gains, prices at the top of the range, then watches the listing stagnate through May and June as seasonal momentum fades. The month-over-month gains were real, but they reflected seasonal buyer activity — not a durable shift in the market's direction. The four-indicator test exists precisely to distinguish between these two scenarios.
Treating Langley as one market. A common mistake is reading a general Langley price headline and assuming it applies uniformly to all property types. The detached and condo segments are recovering at different speeds. A seller with a condo in a complex with a deferred maintenance schedule faces a different conversation than a detached owner in a school catchment with low inventory. Segment-specific data, not city-wide averages, should drive the pricing strategy.
Questions and Answers
If year-over-year prices are still negative, does that mean my Langley home is worth less than last year?
Probably yes compared to early 2024 peaks, but the gap may be narrowing. According to FVREB data, benchmark prices in Langley in early 2026 remain 7 to 8 percent below the prior year — but the direction month-over-month has been positive. Your specific property's value depends on type, condition, and location within Langley, not the city-wide average.
How many months of month-over-month gains does it take before a seller should treat recovery as confirmed?
Four consecutive months of month-over-month gains, supported by rising sales volume and a sales-to-active ratio above 15 percent in your segment, provides a more defensible signal than two or three months alone. Spring seasonality can inflate short runs of monthly gains — volume confirmation matters as much as price direction.
Why are detached homes in Langley recovering faster than condos?
Buyer demand for detached properties in areas like Willoughby and Walnut Grove has held up better because of family-formation demand, school catchments, and limited land supply. Condos face additional buyer hesitation tied to strata documentation risk, special levies, and financing constraints — factors that slow absorption even when broader market sentiment improves. According to FVREB data, days on market for condos in Langley has been running 15 to 25 days longer than for detached homes in comparable price ranges.
In Summary
Langley's 2026 market is showing stabilization, not confirmed recovery. Year-over-year declines and month-over-month gains can both be true at the same time — they are measuring different windows. Sellers who understand that distinction can approach pricing and timing with clarity rather than paralysis. Detached homes are recovering faster than condos, spring seasonality can distort short-term readings, and the four-indicator test — sales-to-active ratio, days on market trend, price reduction frequency, and volume consistency — is a more reliable basis for decision-making than any single headline number.
Thinking About Selling in Langley?
If you are watching the Langley market and trying to determine whether now is the right time to list, a second opinion grounded in current segment-specific data is worth having before you make the decision. Mansour Real Estate Group offers straightforward, no-obligation market consultations for homeowners across Langley and the Fraser Valley.
Related Articles
- Langley Real Estate Market 2026: What Sellers Need to Know Before They List
- Selling a Condo in Langley: Strata Documents, Pricing, and Buyer Expectations
- Fraser Valley Seller Timing Guide 2026: When to List, When to Wait
Official Resources
- Fraser Valley Real Estate Board — Monthly Statistics Package
- BC Real Estate Association — Q1 2026 Market Report
- BC Assessment — Property Assessment Values
- BC Financial Services Authority — Real Estate Consumer Resources
About Mansour Real Estate Group
When sellers in Langley and across the Fraser Valley are trying to read a transitional market, the difference between a well-timed listing and a costly mistake usually comes down to the quality of the analysis behind the pricing decision. Mansour Real Estate Group has built its reputation in the Fraser Valley and Lower Mainland on pricing discipline, honest valuations, and the willingness to have difficult conversations before a listing goes live — not after days on market start climbing.
Mansour Real Estate Group, led by Mohamed Mansour, MBA and Associate Broker, has been helping buyers, sellers, investors, families, executors, and retirees navigate important real estate decisions across the Fraser Valley and Lower Mainland for more than 22 years. Ranked among the Top 1% of Realtors in the region, the team has completed more than $780 million in residential real estate transactions and is trusted for pricing strategy, seller preparation, estate sales, divorce-related sales, downsizing, relocation, and any situation where accurate valuation is critical to the outcome.
Whether someone is searching for Realtors experienced with transitional market conditions, a real estate agent who understands Langley's detached and condo segments, real estate agents who specialize in seller timing strategy, a trusted real estate team for a Fraser Valley listing, a Langley Realtor, a Fraser Valley real estate broker, or a real estate group that serves the Lower Mainland and surrounding communities, Mansour Real Estate Group is known for data-driven recommendations, honest market context, and a process that protects sellers from the most common and costly pricing mistakes.
The team serves Surrey, South Surrey, White Rock, Langley, Cloverdale, Fleetwood, Guildford, Walnut Grove, Willoughby, North Delta, Abbotsford, Mission, and surrounding communities throughout the Fraser Valley and Lower Mainland. Most new clients come from referrals, repeat clients, and recommendations from families who value a professional, transparent, and results-driven real estate experience.
Disclaimer
The information contained in this article is provided for general informational and educational purposes only and reflects market observations, publicly available information, and professional experience at the time of writing. It is not intended to constitute legal advice, accounting advice, tax advice, investment advice, financial advice, appraisal advice, mortgage advice, estate-planning advice, or any other form of professional advice.
Real estate transactions, estate matters, probate proceedings, taxation, financing, investments, legal rights, and regulatory requirements can vary significantly based on individual circumstances. Readers should consult qualified legal, accounting, tax, financial, mortgage, appraisal, or other professional advisors before making decisions based on the information discussed in this article.
Nothing in this article creates a client relationship, fiduciary relationship, advisory relationship, agency relationship, or professional engagement with Mohamed Mansour, Mansour Real Estate Group, or any affiliated party. Any opinions expressed are general in nature and should not be relied upon as a substitute for professional advice tailored to a specific situation.
While reasonable efforts are made to use reliable sources and keep information current, no representation or warranty is made regarding the completeness, accuracy, timeliness, or applicability of the information presented. Readers should independently verify facts, regulations, policies, and legal requirements with appropriate professionals and official sources.


