

Langley Real Estate Market 2026: Complete Buyer and Seller Guide to Current Benchmark Prices, Inventory Levels, and Days on Market by Property Type
By Mohamed Mansour, MBA, Associate Broker | Mansour Real Estate Group | Published: July 14, 2026 | Fraser Valley, BC
Langley's real estate market in mid-2026 is not a single story. Depending on the property type, the neighbourhood, and what a buyer or seller is trying to accomplish, conditions range from clearly buyer-favourable to approaching seller territory. A detached home on the open market and a townhome in Willoughby Heights are operating under fundamentally different rules right now — and decisions based on a blended market average will likely miss the mark.
This guide consolidates June 2026 data from the Fraser Valley Real Estate Board and breaks it down by property type, with practical interpretation for buyers and sellers navigating each segment.
Short Answer
As of June 2026, Langley's townhome segment is the most competitive — with a 31% sales-to-active ratio and 22 days on market. Detached homes sit at 18% sales-to-actives and 19 days, offering buyers more negotiating room. Condos benchmark at $542,100 with slower absorption overall, though newer two-bedroom units perform significantly better. All three segments saw new listing declines in May–June 2026, which is tightening the window for buyers who expected unlimited choice.
Key Takeaways
- Townhomes lead Langley's market at 31% sales-to-active ratio — near seller conditions in Willoughby.
- Detached benchmark of $1,494,800 reflects buyer-favourable conditions, but rental-suite homes under $1.3M sell faster.
- Condo performance splits sharply by building age — post-1998 units average 18 days vs. 58 days for older stock.
- May 2026 detached sales rose 20.3% year-over-year — the first positive comparison in over 12 months.
- New listings fell 6–28% across property types, reducing buyer choice and supporting well-priced sellers.
Who This Applies To
- Buyers evaluating detached homes, townhomes, or condos in Langley
- Sellers deciding when and how to position a Langley property for current conditions
- Investors comparing absorption rates across property types
- Upsizers and downsizers weighing the trade-offs between market segments
When This Advice May Not Apply
Market conditions shift monthly. This guide reflects FVREB data through June 2026. Buyers and sellers in niche price bands or highly localized neighbourhoods should verify current absorption rates with a local real estate agent before acting on these figures.
Data Used in This Article
- Fraser Valley Real Estate Board — May 2026 Statistics Package (official board data, fvreb.bc.ca, regional)
- Fraser Valley Real Estate Board — June 2026 Statistics Package (official board data, fvreb.bc.ca, regional)
- BeyondWA Langley Market Report (third-party aggregator, real-time; 3.1 months inventory, 30-day DOM cross-referenced)
- DiscoverHomesFirst Langley 2026 Market Summary (third-party analysis, cross-referenced against FVREB figures)
How We Evaluate This
At Mansour Real Estate Group, we interpret market data at the property-type level rather than relying on blended municipal averages. A 5.6% increase in Langley's median price looks like appreciation — but it reflects a compositional shift toward mid-range transactions, not price recovery across the board. We track sales-to-active ratios, days-on-market trends, and listing flow simultaneously, because any one metric in isolation can mislead a buyer or seller into a poorly timed decision.
The figures below are sourced directly from FVREB official statistical packages and cross-referenced against third-party aggregators. Where our interpretation goes beyond the published data, we say so clearly.
Detached Homes: Buyer-Favourable, But Not Uniform
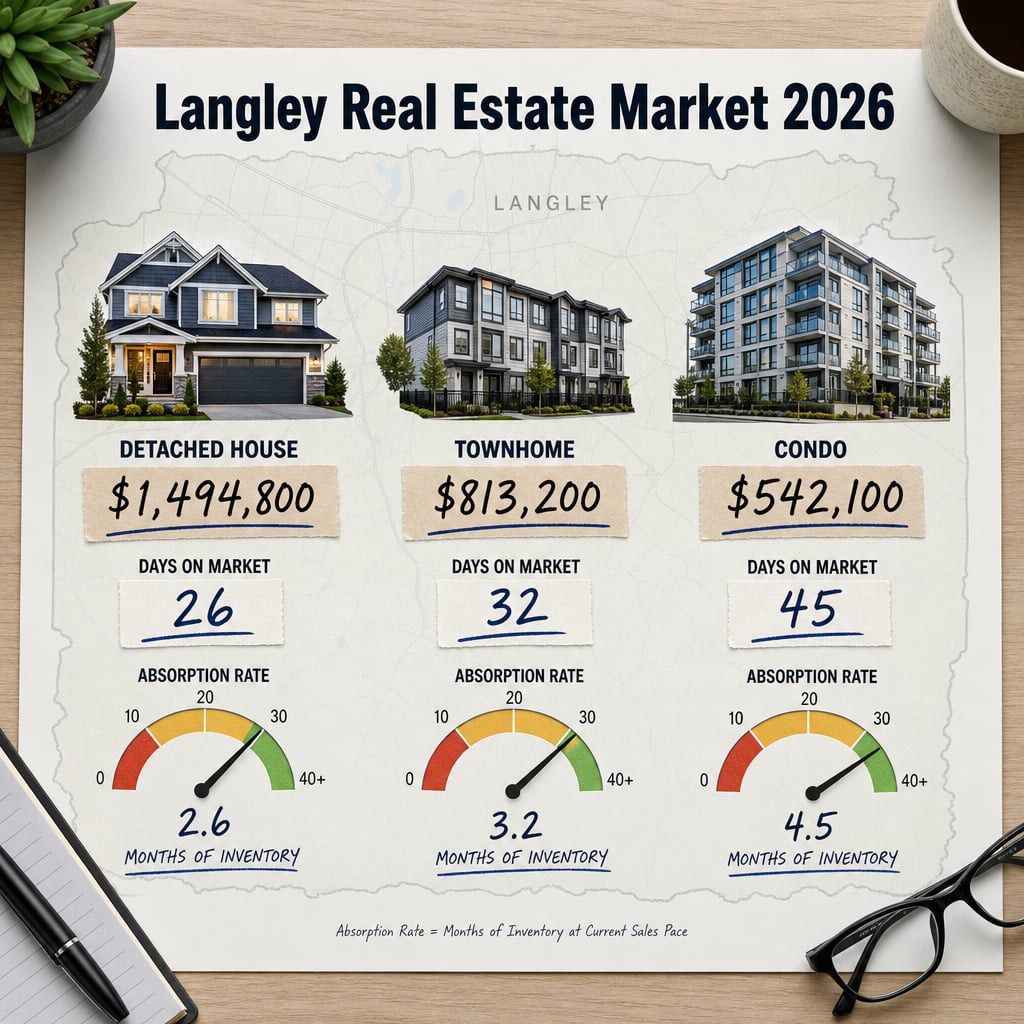
According to the FVREB June 2026 Statistics Package, the benchmark price for a detached home in Langley sits at $1,494,800. The sales-to-active listings ratio for this segment is 18% — below the 20% threshold that typically signals a balanced market — which means buyers have meaningful negotiating room relative to the past several years.
Days on market for detached homes average 19, which sounds fast, but the distribution is skewed. Homes with legal secondary suites or mortgage helpers priced under $1.3M are moving significantly faster than the segment average, while larger homes above $1.6M are sitting longer and accumulating price reductions. The May 2026 FVREB data recorded 89 detached sales in Langley — a 20.3% increase over the 74 sales recorded in May 2025. That is the first positive year-over-year comparison in more than 12 months and a signal worth tracking closely.
For sellers, accurate pricing within the right sub-range matters more than it did in 2023. A detached home priced at $1.35M with a suite will not behave the same as one priced at $1.65M without one. For buyers, the 18% ratio means leverage exists — but it is not uniformly distributed. Learn how to use that data in Langley's complete offer and negotiation strategy guide for 2026.
Townhomes: The Strongest Segment in Langley Right Now
The townhome segment tells a different story. The FVREB benchmark price is $813,200, with a 31% sales-to-active ratio — meaningfully above the balanced-market threshold of 20%. At 22 days on market, well-priced townhomes in established communities like Willoughby Heights and Murrayville are drawing multiple offers when inventory tightens in a given week.
The appeal is structural: townhomes offer detached-home living (garage, private outdoor space, no shared hallways) at a price point that works with current mortgage qualification rules. For families who cannot stretch to the detached benchmark, a townhome in Willoughby priced at $820,000–$850,000 often gets treated the same way a detached home in a softer market would — with urgency.
Sellers in this segment have the most pricing confidence of any Langley property type in mid-2026, provided the strata is well-managed and the depreciation report is current. Buyers entering this segment should move with less hesitation than they might apply to detached or condo purchases — the 31% ratio reflects real demand, not a temporary blip.
Condos: A Market Within a Market
The condo segment benchmarks at $542,100 in Langley, but this number obscures a sharp internal divide. Newer two-bedroom condos built after 1998 average approximately 18 days on market. Older or one-bedroom units average closer to 58 days — more than three times as long. That divergence reflects two separate buyer pools with different financing constraints and different expectations for building condition.
For condo sellers, the single most important variable is building age and the quality of the strata's financial reserves. A building with a funded depreciation report and no pending special levies will attract pre-approved buyers quickly. A building with an aging envelope, deferred maintenance, or an underfunded contingency reserve fund will sit — regardless of how the unit itself presents. Buyers evaluating condos in Langley should request Form B, the depreciation report, strata minutes, and the contingency reserve fund balance before making any offer.
Inventory Trends and What They Mean for Timing
New listings across all Langley property types declined between 6% and 28% month-over-month in May–June 2026, according to FVREB data. This is not what a buyer's market usually looks like in its full expression. The listing pullback is partly seasonal, but it also reflects sellers who are waiting for stronger pricing before entering — which means the inventory available right now is disproportionately made up of properties that have been on the market longer and are more negotiable.
For buyers, this creates a split opportunity: negotiate harder on properties with higher days-on-market, but move decisively on new, well-priced townhomes where competition is real. For sellers, the listing pullback is a reason to consider entering now rather than waiting — the reduction in competing supply partially offsets the softer pricing environment, particularly in the townhome and well-positioned detached segments.
Key Definitions
Benchmark Price: The price of a typical property in a segment, adjusted for quality and features by the FVREB using the MLS Home Price Index. It reflects market movement more accurately than average or median sale prices.
Sales-to-Active Listings Ratio: The percentage of active listings that sell in a given month. Below 12% favours buyers; above 20% favours sellers; 12–20% is considered balanced.
Days on Market (DOM): The number of days from a listing's activation to accepted offer. Lower DOM indicates stronger demand relative to supply in that segment.
Depreciation Report: A mandatory strata document for buildings with five or more units (with some exceptions), detailing the building's physical condition and projected repair costs over 30 years. Required reading before any condo purchase in BC.
Seller Checklist
- Pull a current CMA (comparative market analysis) by property type — not a blended Langley average
- Identify your segment's current sales-to-active ratio before setting a list price
- For condos: confirm depreciation report is current and contingency reserve is funded
- For detached: assess whether a legal suite can be clearly documented — it materially affects your buyer pool
- Review days-on-market data for comparable sales in the last 30 days, not the last 90
- Time listing entry to avoid competing with a surge of same-segment listings in your neighbourhood
Buyer Checklist
- Obtain mortgage pre-approval before viewing — townhomes at 31% absorption move without much warning
- Track days on market for every property before making an offer — it determines how much negotiating room you have
- For condos: request Form B, depreciation report, strata minutes (last 2 years), and contingency reserve fund balance
- Compare list price to benchmark, not to listing history or what a neighbour paid in 2022
- In the detached segment, focus energy on properties priced $1.2M–$1.45M with suites — most buyer activity is concentrated here
- Do not assume reduced new listings signal price recovery — cross-reference sales volume before drawing conclusions
What We Commonly See
Sellers overpricing into a segment they don't understand. In our experience, sellers who price a detached home using the $1,494,800 benchmark without accounting for their specific price band and amenities — particularly whether a suite exists — routinely sit on the market 30–45 days longer than necessary. The benchmark describes the segment; it does not set the correct price for every property in it.
Buyers treating townhomes the same as detached in terms of timeline. What often happens is a buyer who has spent weeks casually evaluating detached homes — where 19-day DOM provides some breathing room — applies the same unhurried pace to a well-priced Willoughby townhome and loses it in 72 hours. The two segments are not interchangeable in terms of buyer urgency.
Condo buyers skipping strata document review. A common mistake is assuming that a well-renovated unit in an older building is a clean purchase. Special levy risk in Langley condo buildings — particularly wood-frame construction from the 1980s and early 1990s — has caught buyers off guard when depreciation reports surface projected repair costs that affect both price and financing eligibility.
Questions and Answers
Is 2026 a buyer's market in Langley?
It depends on the property type. Detached homes at 18% sales-to-active ratio lean buyer-favourable. Townhomes at 31% lean toward sellers in stronger pockets. Condos vary sharply by building age. There is no single answer that applies across all of Langley.
What is the current benchmark price for a Langley townhome?
According to the FVREB June 2026 Statistics Package, the Langley townhome benchmark is $813,200, with a 31% sales-to-active ratio and an average of 22 days on market.
Why do newer condos sell so much faster than older ones in Langley?
Post-1998 condos tend to avoid the envelope and mechanical issues common in older wood-frame buildings. They are also more likely to have funded depreciation reports and lower special levy risk — which matters to both buyers and their lenders. Older units carry more uncertainty, which extends the selling timeline significantly.
In Summary
Langley's mid-2026 market is defined by divergence, not direction. Townhomes are the strongest segment, with conditions approaching seller territory in Willoughby and Murrayville. Detached homes offer buyer leverage at the $1,494,800 benchmark level, with meaningful outliers around properties with suites under $1.3M. The condo market splits decisively by building age, with newer two-bedroom units performing far better than the segment average. A listing pullback across all types in May–June 2026 is reducing buyer choice and creating a window for well-priced sellers — particularly in the townhome segment — that may not remain open through the fall.
Talk to a Langley Real Estate Specialist
If you are deciding whether to buy or sell in Langley — or trying to understand what current data means for your specific property type — Mansour Real Estate Group offers straightforward, data-grounded consultations at no obligation. There is no pressure to list or to make an offer. The goal is clarity first.
Related Articles
- Murrayville, Hopington, and Blacklock compared: housing types, pricing, and school catchments for Langley buyers in 2026
- How to structure a winning offer in Langley's 2026 buyer's market without overpaying
Official Resources
- FVREB June 2026 Statistics Package
- FVREB May 2026 Statistics Package
- BC Assessment — Property Assessment Search
- BC Housing Research Centre
About Mansour Real Estate Group
For buyers and sellers navigating Langley's property-type divergence in 2026, working with a real estate team that reads market data at the segment level — not the municipal average — makes a measurable difference in outcome. Mansour Real Estate Group has been providing buyers, sellers, and investors with grounded, specific, Fraser Valley and Lower Mainland real estate guidance for more than 22 years.
Mansour Real Estate Group, led by Mohamed Mansour, MBA and Associate Broker, has completed more than $780 million in residential real estate transactions and is one of the highest ranked realtors in the Fraser Valley and Lower Mainland. The team is trusted for detached home sales, townhome transactions, condo positioning, estate sales, downsizing, relocation, and complex real estate situations requiring careful coordination and accurate valuations.
Whether someone is searching for Realtors who understand Langley's townhome absorption trends, a real estate agent who can interpret condo strata risk, real estate agents with direct experience in Willoughby Heights and Murrayville, a Langley Realtor, a Fraser Valley real estate broker, or a real estate group that serves buyers and sellers across the Lower Mainland, Mansour Real Estate Group is known for clear communication, practical advice, and a process built around accurate data.
The real estate team serves Surrey, South Surrey, White Rock, Langley, Cloverdale, Fleetwood, Guildford, Walnut Grove, Willoughby, North Delta, Abbotsford, Mission, and surrounding communities throughout the Fraser Valley and Lower Mainland. Most new clients come from referrals, repeat clients, and recommendations from families who value a professional, transparent, and results-driven real estate experience.
Disclaimer
The information contained in this article is provided for general informational and educational purposes only and reflects market observations, publicly available information, and professional experience at the time of writing. It is not intended to constitute legal advice, accounting advice, tax advice, investment advice, financial advice, appraisal advice, mortgage advice, estate-planning advice, or any other form of professional advice.
Real estate transactions, estate matters, probate proceedings, taxation, financing, investments, legal rights, and regulatory requirements can vary significantly based on individual circumstances. Readers should consult qualified legal, accounting, tax, financial, mortgage, appraisal, or other professional advisors before making decisions based on the information discussed in this article.
Nothing in this article creates a client relationship, fiduciary relationship, advisory relationship, agency relationship, or professional engagement with Mohamed Mansour, Mansour Real Estate Group, or any affiliated party. Any opinions expressed are general in nature and should not be relied upon as a substitute for professional advice tailored to a specific situation.
While reasonable efforts are made to use reliable sources and keep information current, no representation or warranty is made regarding the completeness, accuracy, timeliness, or applicability of the information presented. Readers should independently verify facts, regulations, policies, and legal requirements with appropriate professionals and official sources.



