
Langley Home Price Forecast 2026–2027: What Year-Over-Year Declines, Inventory Surge, and Buyer Migration From Metro Vancouver Reveal About Recovery Timeline and Strategic Entry Windows
By Mohamed Mansour, MBA and Associate Broker — Mansour Real Estate Group | Fraser Valley and Lower Mainland | Published: July 8, 2025 | Market: Langley, Willoughby, Walnut Grove, Murrayville
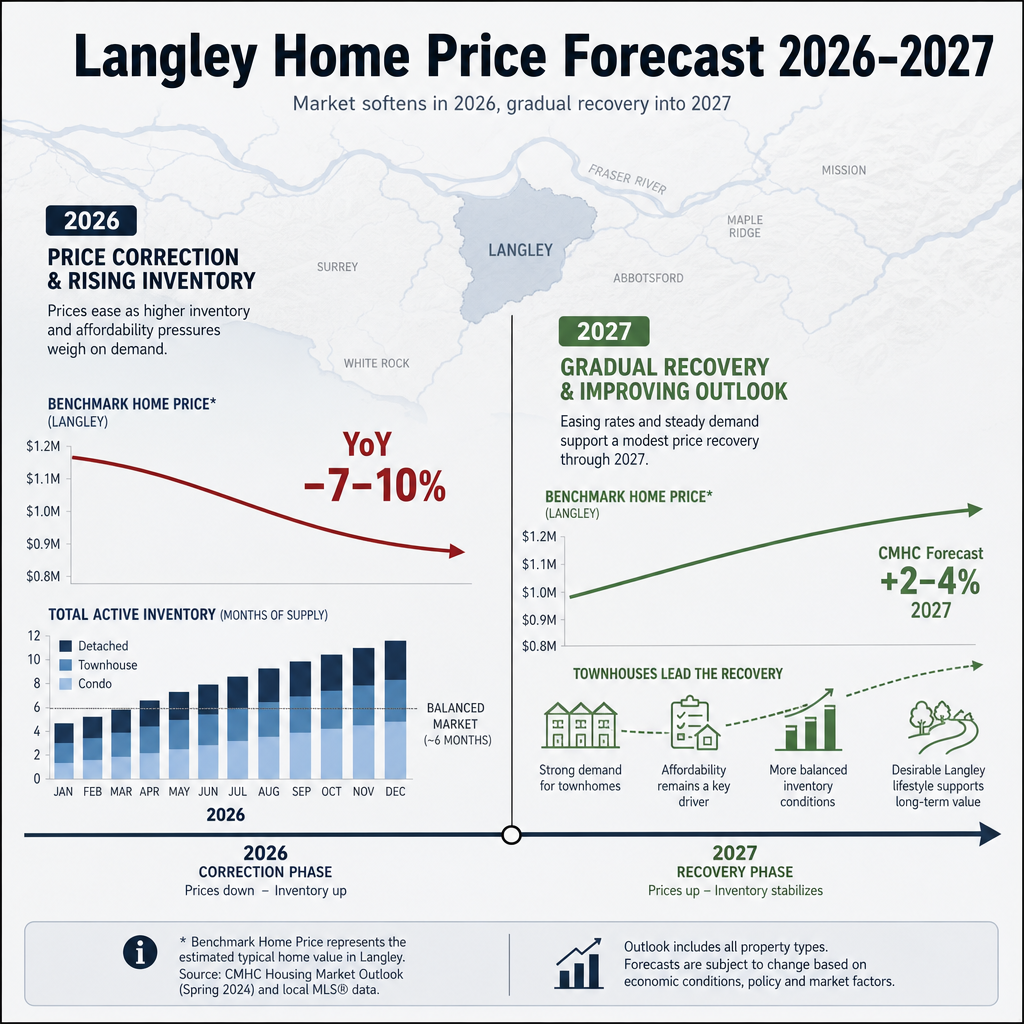
Langley's housing market in 2026 is at an inflection point that rewards careful analysis over gut instinct. Benchmark prices have declined 7–10% year-over-year, active inventory is running 40–50% above historical norms, and sales-to-active ratios remain compressed. But month-over-month price stabilization has begun, Metro Vancouver buyers are migrating eastward in growing numbers, and CMHC's April 2026 Fraser Valley assessment points to modest recovery through 2027. For sellers deciding whether to list now or wait, and for buyers wondering whether the bottom has passed, the data tells a more nuanced story than the headlines suggest.
This article draws on FVREB sales data, CMHC's April 2026 housing market assessment, Bank of Canada rate forecasts, and MLS days-on-market analysis to map a credible 12–18 month outlook — by property type, by district, and by market condition.
Short Answer
Langley benchmark prices are down 7–10% year-over-year as of April 2026, with inventory elevated and sales-to-active ratios compressed at 8–11%. Month-over-month stabilization and accelerating buyer migration from Metro Vancouver suggest the correction is near its floor. CMHC projects 2–4% appreciation in 2027. Townhouses are recovering fastest. Sellers who price accurately now can close in 30–45 days. Buyers entering at current benchmarks are positioned for meaningful upside within 12 months.
Key Takeaways
- Langley benchmark prices are down 7–10% year-over-year, but month-over-month stabilization signals the correction floor may be close.
- Elevated inventory creates a buyer's market, but the townhouse segment is already approaching balanced conditions at 15–23% sales-to-active.
- Buyer migration from Metro Vancouver is accelerating, driven by a $150K–$250K affordability gap and transit uncertainty in Burnaby and Coquitlam.
- CMHC forecasts 2–4% appreciation in 2027 as inventory normalizes and mortgage rate stability encourages move-up buyers.
- Days-on-market ranges from 36 to 50+ days across Langley districts, with meaningful pricing sensitivity differences between Willowbrook, Walnut Grove, and Murrayville.
Who This Applies To
- Langley homeowners deciding whether to list in 2026 or wait until 2027
- Buyers evaluating whether current benchmarks represent a true entry opportunity
- Investors tracking property type divergence and micro-market recovery pace
- Move-up buyers in Willoughby, Walnut Grove, or Murrayville weighing timing risk
- Metro Vancouver households considering eastward relocation in 2026 or early 2027
When This Advice May Not Apply
This analysis draws on published market data and professional interpretation. Individual properties, strata situations, assessed values, and personal financial circumstances vary. Nothing here constitutes financial, legal, mortgage, or investment advice. Consult qualified professionals for decisions specific to your situation.
Data Used in This Article
- CMHC Housing Market Assessment – Fraser Valley Region, April 2026 (official, government-issued)
- FVREB Real Estate Statistics – Langley Sales Data, April 2026 (official, board-issued)
- Bank of Canada Monetary Policy Report and Mortgage Rate Forecasts, 2026–2027 (official)
- MLS Days-on-Market and Sales-to-Active Ratio Analysis – Langley Districts (third-party analysis based on board data)
- Greater Vancouver Regional District Migration and Affordability Index 2026 (third-party regional index)
Definitions
Benchmark Price: The MLS Home Price Index benchmark represents a typical property in a given area and property type, adjusted for quality and features. It is more stable than average or median price as a market indicator.
Sales-to-Active Ratio: The ratio of homes sold to homes listed in a given month. Below 12% typically signals a buyer's market. Above 20% signals seller conditions. Between 12–20% is generally balanced.
Days on Market (DOM): The number of days from list date to accepted offer. Higher DOM reflects weaker demand or overpricing. DOM variance across districts reveals micro-market demand divergence.
Where Langley's Market Actually Stands in Mid-2026
According to the FVREB's April 2026 statistics, Langley benchmark prices are down 7–10% year-over-year across property types. Active inventory is 40–50% above historical norms, which has pushed the overall sales-to-active ratio into buyer's market territory at roughly 8–11%. That means for every 100 homes listed, only 8 to 11 are selling in a given month.
Days on market across Langley districts now ranges from 36 days in higher-demand pockets like Willoughby to 50 or more days in areas like Murrayville and parts of Walnut Grove where detached inventory has built up more aggressively. This variance matters. A seller in Willoughby with a well-priced townhouse is in a fundamentally different position than a seller in Murrayville with a larger detached home at the upper end of the local price range.
What's changed in recent months is the trajectory. Month-over-month prices have stabilized after consecutive declines through late 2025 and early 2026. CMHC's April 2026 Fraser Valley assessment notes this stabilization as consistent with a correction approaching its floor — not a recovery, but a plateau that tends to precede one.
For context, the correction itself began from elevated post-pandemic benchmarks, meaning the current decline reflects normalization as much as it does fundamental weakness. Demand has not disappeared — it has been deferred by rate uncertainty and buyer hesitation at the front end of a correction cycle.
Why Buyer Migration From Metro Vancouver Changes the Recovery Equation
One of the more consequential forces in Langley's 2026–2027 trajectory is demand arriving from outside the local market. According to the Greater Vancouver Regional District's 2026 Migration and Affordability Index, household movement from Metro Vancouver into the Fraser Valley has accelerated meaningfully, driven by two distinct pressures.
The first is price. Buyers comparing Burnaby or Coquitlam townhouses to Langley townhouses are routinely looking at a $150,000–$250,000 gap at comparable square footage and age. In a high-rate environment where that gap represents significant carrying cost savings, the affordability case for Langley is direct and measurable.
The second is transit uncertainty. The planned SkyTrain expansion into parts of Burnaby and Coquitlam has created unresolved questions about construction timelines, neighbourhood disruption, and eventual price normalization around new stations. Some buyers who might have previously anchored near those corridors are instead choosing established Langley communities like Willoughby and Walnut Grove, where commute infrastructure is already in place and pricing is currently discounted relative to historical norms.
This migration pattern matters for the recovery timeline because it represents incremental demand that is not already accounted for in local inventory absorption rates. As more Metro Vancouver households complete their decision process and enter the Langley market, the current surplus inventory absorbs faster — which is the mechanical precondition for price stabilization and eventual appreciation.
Property Type Divergence: Townhouses, Detached Homes, and Condos Are Not Moving Together
One of the clearest signals in the current FVREB data is that recovery is not uniform across property types. Townhouses in Langley are behaving differently from detached homes, and both are different from condos.
The townhouse segment is the closest to balanced market conditions. Sales-to-active ratios for townhouses in Langley are tracking at 15–23%, depending on the district and price band. That range sits at or above the threshold typically associated with balanced supply-demand dynamics. Entry-level townhouses in Willoughby, in particular, are seeing consistent buyer interest because they serve multiple demand pools simultaneously: first-time buyers priced out of detached, downsizers seeking lower maintenance, and Metro Vancouver relocators who see them as value-equivalent to what they are leaving behind.
Detached homes are sitting in more extended buyer's market territory. Sales-to-active ratios for single-family homes in Langley are running at roughly 8–12%, meaning sellers face more competition and buyers have more leverage on both price and conditions. Days on market are longer, and price adjustments are more common. Sellers in this segment who are not pricing to the current market — not the 2024 market — are the ones driving the extended DOM statistics.
Condos sit in a similar range to detached, with added complexity. Older buildings with depreciation reports flagging deferred maintenance, higher strata fees, or pending special levies are facing meaningful buyer resistance. Newer condo product in Willoughby with lower fees and cleaner documentation is outperforming. This distinction between building quality and documentation is one that buyers evaluating the Langley condo market need to understand before making an offer.
How We Evaluate This
When sellers and buyers in Langley ask us to interpret current conditions, we start with the sales-to-active ratio because it is the single most reliable leading indicator of price direction. A ratio below 12% tells us sellers are competing for buyers — which means pricing discipline is not optional, it is the entire strategy. A ratio moving upward from 10% toward 15% tells us the market is tightening, and that buyers waiting for a further price drop may be misreading the direction.
We then layer in days-on-market data by district to identify where demand is concentrated. Willowbrook and Willoughby consistently show shorter DOM than Murrayville or rural Langley Township properties. That is a pricing sensitivity signal, not just a volume signal. Finally, we look at month-over-month benchmark movement — not year-over-year, which is backward-looking — to determine whether price floors are forming. The combination of stabilizing month-over-month benchmarks, rising migration demand, and CMHC's forward forecast gives us a credible basis for the 12–18 month outlook outlined in this article.
What the 2027 Recovery Forecast Actually Means for Timing Decisions
CMHC's April 2026 Fraser Valley housing market assessment projects 2–4% price appreciation in 2027 for the region, contingent on inventory normalization and continued mortgage rate stability. That forecast is modest, not dramatic — and that is exactly why it is credible.
For sellers, a 2–4% recovery in 2027 does not justify waiting if the alternative is selling now at an accurately priced discount and completing a clean transaction within 30–45 days. The carrying cost of holding a property for 12–18 months — mortgage interest, property taxes, maintenance, and the opportunity cost of proceeds — needs to be weighed against the forecasted appreciation. In many cases, particularly for move-up sellers who are also buying, the math favours action now rather than waiting for a market that may only partially recover the current discount.
For buyers, the 2027 forecast combined with current benchmark discounts of 7–10% below recent peaks creates a compounding opportunity. Entering at today's prices and holding through a modest recovery positions a buyer for 10–14% total value improvement relative to buying at the 2024 peak and experiencing the current correction. That kind of asymmetry is uncommon in the Fraser Valley market. It does not last indefinitely, and it is most accessible in the townhouse segment, which is already beginning to tighten.
Seller Checklist
- Pull the current FVREB benchmark for your specific property type and district — not the broader Langley average.
- Identify the sales-to-active ratio for your segment before setting a list price — this tells you how much competition you are entering.
- Review recent sold prices, not list prices. The spread between list and sale in a buyer's market is meaningful and often 3–5%.
- Confirm days-on-market for comparable recent sales in your district to set realistic timing expectations.
- If selling a strata property, confirm depreciation report status, strata fee history, and any pending special levy disclosures before listing.
- Calculate the full carrying cost of waiting 12 months versus selling now at current market pricing — include mortgage interest, taxes, and maintenance.
What We Commonly See
In our experience working with Langley sellers in the current cycle, the most common mistake is pricing to where the market was 12–18 months ago rather than where it is today. Sellers who hold firm at 2024 benchmarks in a 2026 buyer's market are not protecting equity — they are compounding days on market, which itself becomes a negative signal to buyers who wonder why a property has not sold.
What often happens is that sellers eventually reduce to market pricing, but by that point they have lost the initial listing momentum, generated fewer showings than an accurately priced launch would have, and sometimes accepted a lower final price than they would have received with accurate pricing from day one.
On the buyer side, we commonly see hesitation rooted in the assumption that prices will fall further. When month-over-month stabilization is already underway and migration demand is visibly accelerating, that assumption is riskier than it appears. The buyers who consistently regret their timing in hindsight are those who waited for certainty in a market that signals recovery before delivering it visibly in headline data.
Questions About the Langley Market in 2026–2027
Is Langley still in a buyer's market in 2026?
Overall, yes. Sales-to-active ratios for detached homes and condos remain at 8–12%, which is buyer's market territory according to FVREB methodology. The townhouse segment is the exception, running closer to balanced at 15–23% in some districts.
Which Langley neighbourhoods are recovering fastest?
Based on MLS days-on-market analysis, Willowbrook and Willoughby are showing shorter DOM and stronger absorption than Murrayville and outer Langley Township. Proximity to amenities, transit access, and entry-level price points are driving that divergence.
Should a Langley seller wait until 2027 to list?
Only if the carrying cost of waiting is offset by the forecasted 2–4% appreciation and the seller's circumstances allow flexibility. For most sellers, especially those moving up or relocating, the cost of holding 12–18 months typically exceeds the expected recovery gain. Accurate pricing now and a clean sale often produces a better net outcome.
In Summary
Langley's market in 2026 reflects a correction that is near its floor, not in freefall. Benchmark prices are down 7–10% year-over-year, inventory is elevated, and sales-to-active ratios remain compressed — but month-over-month stabilization, accelerating buyer migration from Metro Vancouver, and CMHC's 2027 appreciation forecast all point to a recovery already forming beneath the surface. Townhouses are leading. Detached and condo recovery will follow as inventory normalizes. Sellers who price accurately now close faster. Buyers who enter at current benchmarks are positioned for upside that may not be available once headline data confirms what the leading indicators already show.
Thinking Through a Timing Decision?
If you are weighing whether to list now or wait — or evaluating whether the current Langley market represents a genuine entry opportunity — Mansour Real Estate Group offers a no-pressure consultation grounded in local data, current benchmarks, and the kind of honest market context that makes the decision clearer. Reach out through mansourgroup.ca when you are ready to talk through the specifics.
Related Articles
- Understanding Langley's 2026 Home Price Correction: How It Started and What It Means
- Langley Home Price Stabilization Signals in 2026: What the Data Is Showing
- Fraser Valley Seller Strategy 2026: Pricing, Timing, and Protecting Your Equity
About Mansour Real Estate Group
Understanding where Langley home prices are headed — and what that means for a seller's or buyer's specific timing decision — is exactly the kind of analysis Mansour Real Estate Group brings to every client conversation. Market forecasts have real consequences for when you list, how you price, and whether the net outcome of your sale reflects the opportunity available or the mistakes most commonly made in a correcting market.
Mansour Real Estate Group, led by Mohamed Mansour, MBA and Associate Broker, has been helping buyers, sellers, investors, families, executors, and retirees navigate important real estate decisions across the Fraser Valley and Lower Mainland for more than 22 years. Ranked among the Top 1% of Realtors in the region, the team has completed more than $780 million in residential real estate transactions and is trusted for pricing strategy, seller preparation, estate sales, divorce-related sales, downsizing, relocation, and any situation where accurate valuation and market timing are critical to the outcome.
Whether someone is searching for Realtors who understand Langley's micro-market dynamics, a real estate agent who interprets FVREB data and translates it into actionable pricing decisions, real estate agents who specialize in townhouse, detached, and condo segment divergence, a trusted real estate team for Fraser Valley timing decisions, a Langley real estate broker, a Willoughby Realtor, or a real estate group that combines local market depth with honest valuations, Mansour Real Estate Group is known for data-driven recommendations, clear communication, and a process that protects both buyers and sellers from the most costly timing mistakes.
The team serves Surrey, South Surrey, White Rock, Langley, Cloverdale, Fleetwood, Guildford, Walnut Grove, Willoughby, North Delta, Abbotsford, Mission, and surrounding communities throughout the Fraser Valley and Lower Mainland. Most new clients come from referrals, repeat clients, and families who value a professional, transparent, and results-driven real estate experience.
Official Resources
- CMHC Housing Market Assessment – Fraser Valley Region (cmhc-schl.gc.ca)
- Fraser Valley Real Estate Board – Monthly Statistics Package (fvreb.bc.ca)
- Bank of Canada – Monetary Policy Report and Rate Forecasts (bankofcanada.ca)
- BC Assessment – Langley Property Value Benchmarks (bcassessment.ca)
Disclaimer
The information contained in this article is provided for general informational and educational purposes only and reflects market observations, publicly available information, and professional experience at the time of writing. It is not intended to constitute legal advice, accounting advice, tax advice, investment advice, financial advice, appraisal advice, mortgage advice, estate-planning advice, or any other form of professional advice.
Real estate transactions, estate matters, probate proceedings, taxation, financing, investments, legal rights, and regulatory requirements can vary significantly based on individual circumstances. Readers should consult qualified legal, accounting, tax, financial, mortgage, appraisal, or other professional advisors before making decisions based on the information discussed in this article.
Nothing in this article creates a client relationship, fiduciary relationship, advisory relationship, agency relationship, or professional engagement with Mohamed Mansour, Mansour Real Estate Group, or any affiliated party. Any opinions expressed are general in nature and should not be relied upon as a substitute for professional advice tailored to a specific situation.
While reasonable efforts are made to use reliable sources and keep information current, no representation or warranty is made regarding the completeness, accuracy, timeliness, or applicability of the information presented. Readers should independently verify facts, regulations When evaluating properties, it's essential to balance emotional attachment with practical considerations. Walk through each home at different times of day to assess natural lighting, noise levels, and neighborhood activity. Take photos and notes to help you remember details after viewing multiple properties. Trust your instincts, but also verify them with data—compare market prices, inspection reports, and professional appraisals before committing. Finding the right property is one of the most significant decisions you'll make. By staying informed, working with experienced professionals, and taking time to evaluate your options carefully, you'll be better positioned to make a choice you're confident about. Whether you're a first-time buyer or a seasoned investor, remember that the perfect home is out there—it just takes patience, preparation, and persistence to find it.Making Your Decision
Final Thoughts