

How to Evaluate a Listing Agent's Days-on-Market Track Record and List-to-Sale Price Ratio During a Buyer's Market: What Sellers Should Actually Verify When Interviewing Agents in Metro Vancouver and the Fraser Valley 2026
By Mohamed Mansour, MBA, Associate Broker — Mansour Real Estate Group | Fraser Valley & Metro Vancouver | Published June 2026
With more than 10,000 active listings across the Fraser Valley and Metro Vancouver, sellers in 2026 are interviewing agents in a market where overpricing is costly, days on market signal everything, and the gap between a competent listing agent and an average one shows up directly on the final cheque. Most sellers ask about experience and commissions. The more important questions involve numbers — specific, segmented, verifiable numbers.
This article gives sellers a practical framework to evaluate two metrics that predict listing performance more reliably than transaction volume or testimonials: days on market and the list-to-sale price ratio. Both are verifiable. Both are publicly anchored. And both reveal whether an agent's pricing discipline and buyer acquisition skills can actually protect your equity in a buyer's market.
Short Answer
In a buyer's market, the two metrics that most reliably predict a listing agent's performance are days on market (DOM) and list-to-sale price ratio. Sellers should request 12–24 months of data, segmented by property type and neighbourhood, and cross-reference those figures against publicly available MLS sold data. Agents unwilling to share segmented data are a red flag. Agents who consistently achieve 98% or above of asking price in a buyer's market have demonstrably better pricing and negotiating discipline than those landing at 92–95%.
Key Takeaways
- DOM varies 50–80% by property type within the same city — always request segmented data.
- A list-to-sale ratio of 98%+ in a buyer's market signals pricing accuracy; 92–95% often signals overpricing at launch.
- MLS sold data and BCFSA licensing records let sellers independently verify agent claims.
- Agents who cherry-pick months or refuse to segment results are not in your corner at listing time.
- Marketing investment — photography, staging, digital spend — correlates with DOM reduction and should be quantified in writing.
Who This Applies To
- Homeowners in Surrey, Langley, Abbotsford, White Rock, South Surrey, Cloverdale, Fleetwood, Willoughby, Walnut Grove, Burnaby, Richmond, and surrounding areas preparing to list in 2026
- Sellers who are interviewing two or more listing agents and need a concrete evaluation framework
- Estate executors, divorcing spouses, or downsizing homeowners where pricing accuracy has financial or legal consequences
- Anyone who has received conflicting listing price recommendations and needs to understand why those gaps exist
When This Advice May Not Apply
If a seller must accept an unconditional offer on a specific date due to probate timelines, court orders, or lender requirements, speed constraints may override the standard evaluation framework. Consult your lawyer and a specialist in estate or legally directed sales before applying these criteria rigidly.
Definitions
Days on Market (DOM): The number of calendar days from MLS list date to accepted offer. In BC, this is tracked from the original list date, not any relisting date — though some agents relist expired properties to reset the counter, which is a separate issue.
List-to-Sale Price Ratio: The final sold price divided by the original list price, expressed as a percentage. A ratio of 98% means the home sold for 98 cents on every dollar of asking price. Ratios below 95% in a buyer's market frequently indicate the property was overpriced at launch.
Sales-to-Active Listings Ratio: A board-level metric that defines market conditions. According to the Fraser Valley Real Estate Board (FVREB), a ratio below 12% indicates a buyer's market; above 20% indicates a seller's market. As of early 2026, most Fraser Valley segments remain below that threshold.
Data Used in This Article
- FVREB Monthly Market Reports, January–April 2026 — Official board statistics on DOM and sales-to-active ratios by property type; Fraser Valley geography
- BCFSA Agent Licensing Registry — Public licensing and disciplinary database; official regulatory source
- MLS Sold Data (Paragon/Matrix system, FVREB and REBGV) — Transaction-level DOM and sold price data available to licensed Realtors and verifiable by sellers via agent-provided samples
- Mansour Real Estate Group Internal Tracking, 2024–2026 — DOM and list-to-sale performance by property type, neighbourhood, and price band; proprietary internal analysis
Why DOM and List-to-Sale Ratio Are the Right Metrics
Transaction volume tells you how busy an agent is. DOM and list-to-sale ratio tell you how good they are at pricing and selling properties like yours, in your market, in current conditions.
An agent can close 40 transactions a year and still consistently overprice listings, generate long DOM, and negotiate poor sale prices — particularly if their volume comes from the buy side, from lower price bands, or from a different property type than yours. Volume does not segment. Performance metrics do.
In a buyer's market with elevated inventory, DOM matters because a listing that sits too long loses perceived value. Buyers in the Fraser Valley and Metro Vancouver monitor active days carefully. By the time a listing passes 30–45 days in most segments, buyer assumptions shift: they assume something is wrong, and they offer accordingly. An agent with a lower average DOM — consistently, across comparable listings — is generating offers earlier and protecting more of your equity.
The list-to-sale ratio complements DOM by showing what happens at the negotiating table. According to FVREB data and internal tracking at Mansour Real Estate Group, agents who price accurately from day one — based on active competition, not optimistic comparables — consistently achieve higher final ratios than those who list high and chase the market down. For more on how top agents approach pricing discipline differently, that article goes into the broader performance gap in detail.
Why Segmentation Changes Everything
This is where most sellers go wrong. An agent might claim an average DOM of 22 days — and that number could be accurate, and completely misleading.
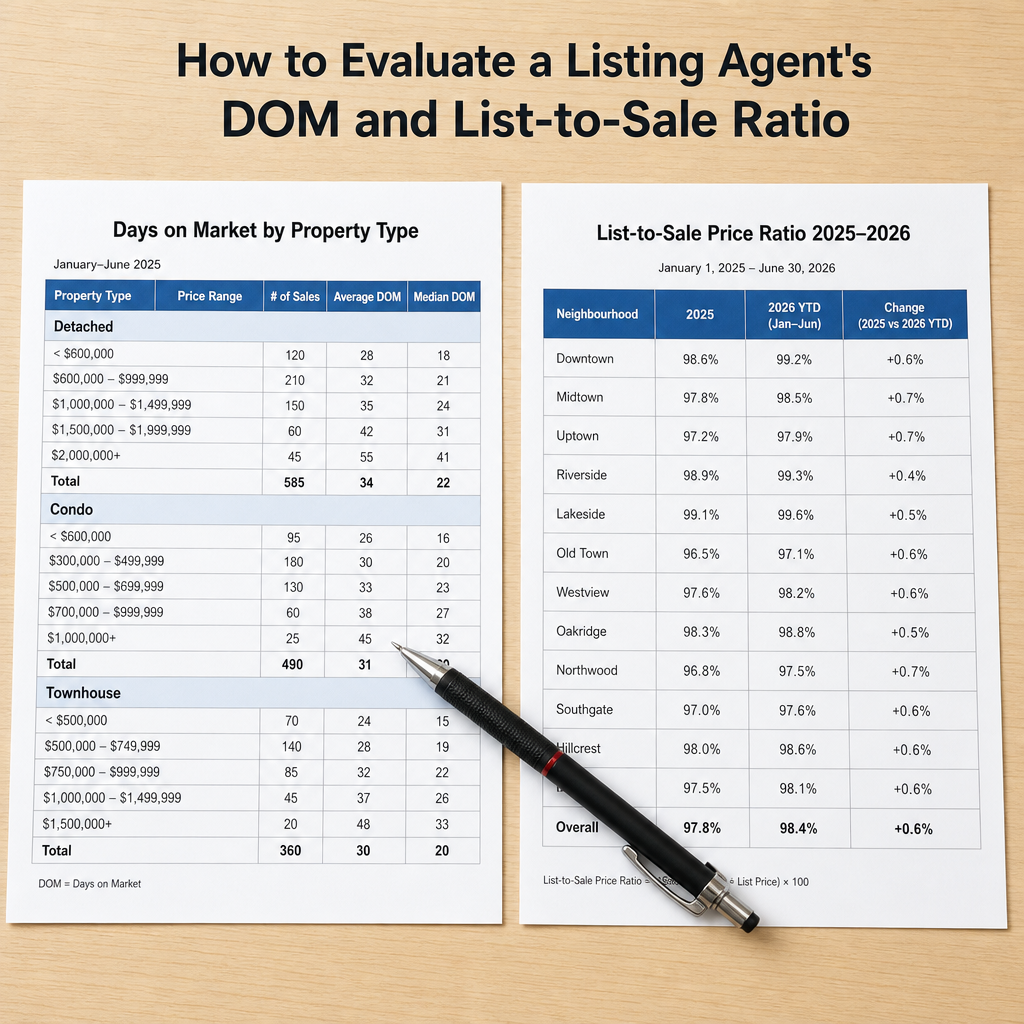
DOM varies significantly by property type and neighbourhood within the same city. Based on FVREB monthly reports from early 2026, detached homes in Surrey have been averaging roughly 25–30 days to sale in active price bands, while Surrey condos in comparable periods have been sitting 45 days or longer. If an agent's 22-day average is built on a mix of detached sales in Fleetwood and condos across the city, that number tells you almost nothing about how they will perform for a condo in Guildford or a townhouse in Willoughby.
The same logic applies across the Fraser Valley. A Langley agent whose DOM average is pulled down by several Willoughby detached sales in a strong month may perform very differently on a Walnut Grove townhouse. An Abbotsford agent with strong numbers on entry-level detached homes may have limited experience on West Abbotsford properties above $1.2M.
When interviewing agents, ask specifically: "Can you show me your average DOM and list-to-sale ratio for [your property type] in [your neighbourhood or city], over the past 12 to 24 months?" If an agent cannot segment by property type and geography, or won't, that is useful information on its own. The ability to segment results reflects the same analytical precision that determines whether they price your listing correctly on day one. For a full agent comparison framework, see How to Compare Realtors in BC.
How to Verify What Agents Tell You
You are not required to take an agent's claims at face value. Sellers have several verification tools available.
MLS sold data: Licensed Realtors have access to full transaction history through the Paragon or Matrix systems used by FVREB and REBGV. An agent who is transparent about their track record should be willing to pull a 12–24 month sample of their own listings and show you the list price, sold price, and days on market for each. You can then calculate the list-to-sale ratio yourself: divide the sold price by the original list price. If an agent restated the list price at any point before selling, ask for the original list price on every record.
BCFSA licensing registry: The BC Financial Services Authority maintains a public database where you can confirm an agent's licence status, licence history, and any disciplinary actions. This does not show performance metrics, but it confirms the agent is in good standing and has the licence tenure they claim. Access the registry directly at bcfsa.ca.
FVREB and REBGV board statistics: The Fraser Valley Real Estate Board and the Real Estate Board of Greater Vancouver publish monthly market reports that include average DOM and benchmark prices by property type and area. These give you a market baseline to compare against what any individual agent claims.
One additional check: look up the agent's recent listings on Realtor.ca or the MLS. Check how many expired or relisted without selling. A history of expired listings — properties that didn't sell within the original listing term — is not visible in DOM claims but shows up in listing activity. An agent who frequently relists properties may be resetting the DOM counter without resolving the underlying pricing issue. Understanding how to read and verify agent claims broadly applies to performance data exactly as it does to testimonials.
How We Evaluate This
At Mansour Real Estate Group, we track DOM and list-to-sale performance internally by property type, price band, and neighbourhood — not as a combined average. When a seller asks how we perform in Langley detached homes above $1.4M, or Surrey condos in the $550K–$750K range, we can answer specifically. That segmentation is the same precision that goes into pricing a listing.
We also track our listing-to-expired ratio. When a property doesn't sell within its listing term, we review what happened: was it a pricing issue, a condition issue, a marketing issue, or a market shift? That internal accountability shapes how we approach each new listing conversation — and it's why we focus on honest pricing conversations before a property goes live rather than after it has sat too long. How marketing quality connects to sale price is covered in depth in that article.
Seller Checklist: Verifying Agent Performance Before You Sign
- Ask each agent for a 12–24 month listing history segmented by property type and neighbourhood — not a combined average
- Calculate the list-to-sale ratio yourself from their data: sold price ÷ original list price × 100
- Ask specifically about expired or relisted properties in their recent history — this is the number most agents won't volunteer
- Cross-reference their claimed DOM against FVREB or REBGV board averages for your property type and area
- Confirm licence status and history through the BCFSA public registry at bcfsa.ca
- Ask each agent to itemize their marketing investment: photography, staging budget, digital advertising, and open house plan — in writing, as part of their listing proposal
- Ask how they arrived at their suggested list price: what active competition did they account for, and what price reductions did they factor in from comparable active listings?
What We Commonly See
In our experience, the most common performance gap between agents shows up not in their marketing materials but in the first pricing conversation. Agents who lead with a high suggested price — before asking detailed questions about your timeline, your financial position, and current active competition — are often using the list price as a persuasion tool rather than a strategic recommendation.
What often happens is this: a seller interviews three agents, receives three price opinions that vary by $80,000–$150,000, and interprets the highest number as the agent who "believes in the property." Six weeks later, that listing has sat long enough that buyers are submitting low offers and the seller is considering a price reduction that wipes out more equity than accepting a realistic price on day one would have cost.
A common mistake is evaluating marketing promises without evaluating pricing discipline. An agent can produce excellent photography, run social media ads, and hold weekend open houses — and still leave money on the table if the initial list price was designed to win the listing rather than sell the property. Marketing reduces DOM only when the pricing is correct. When pricing is wrong, no volume of marketing repairs the damage to buyer perception that comes with sitting on market.
Questions and Answers
Q: What is a good list-to-sale price ratio for a listing agent in a buyer's market?
In a buyer's market, a list-to-sale ratio of 98% or above consistently indicates sound pricing and effective buyer acquisition. Ratios of 92–95% often reflect overpricing at launch, price reductions, or weak offer negotiation. According to Mansour Real Estate Group internal tracking, the difference frequently comes down to whether the agent priced against active competition or relied on older sold comparables.
Q: Can I look up an agent's days-on-market history myself without relying on what they tell me?
Partially. Active and recently sold listings are visible on Realtor.ca, which shows list dates. You can observe patterns — how often listings sat or were relisted — though the full transaction history requires MLS access. A transparent agent will pull their own data from the system and show you the records. If they won't, ask why.
Q: Does an agent's overall DOM average apply to my property type?
Rarely without segmentation. According to FVREB data from early 2026, DOM varies 50–80% by property type within the same city. A Surrey condo and a Surrey detached home do not move on the same timeline. Any agent who quotes a single combined DOM average without segmenting by property type is giving you a number that may have no bearing on how long your specific property would take to sell.
In Summary
In a buyer's market with more than 10,000 active listings, the difference between agents shows up in pricing discipline and buyer acquisition speed — not in marketing brochures or transaction volume totals. Days on market and list-to-sale price ratio are the two metrics that capture that difference most clearly, and both are verifiable through MLS data, FVREB board statistics, and direct requests from agents. Ask for segmented data. Check for expired listings. Confirm the figures against board averages. An agent who prices accurately from day one, markets deliberately, and negotiates without desperation will produce a better outcome than one who wins the listing with a high number and then manages the disappointment.
Talk to the Mansour Real Estate Group
If you are preparing to list and want to review our performance data for your specific property type and neighbourhood — without obligation — contact Mansour Real Estate Group for a direct conversation. We bring the numbers. You ask the questions.
Related Articles
- How to Find the Best Real Estate Agent in Metro Vancouver and Fraser Valley BC
- What Separates the Top 10% of Realtors From the Rest in Metro Vancouver
- How Realtor Marketing Quality Affects Your Sale Price in Metro Vancouver
- Real Estate Team vs. Solo Agent in Metro Vancouver: Which Should You Hire
- Does It Matter If Your Realtor Has a Personal Real Estate Corporation (PREC) in BC
About Mansour Real Estate Group
When homeowners in Surrey, Langley, White Rock, or Abbotsford are preparing to list, the decisions made before the property goes live — how to price it, how to position it against active competition, and which agent to trust with that decision — typically determine the outcome more than anything that happens afterward. Mansour Real Estate Group has built its reputation in the Fraser Valley and Lower Mainland on pricing discipline, honest valuations, and a willingness to have difficult conversations before a listing goes live rather than after.
Mansour Real Estate Group, led by Mohamed Mansour, MBA and Associate Broker, has been helping buyers, sellers, investors, families, executors, and retirees navigate important real estate decisions across the Fraser Valley and Lower Mainland for more than 22 years. Ranked among the Top 1% of Realtors in the region, the team has completed more than $780 million in residential real estate transactions and is trusted for pricing strategy, seller preparation, estate sales, divorce-related property sales, downsizing, relocation, and any situation where accurate valuation and negotiating discipline matter.
Whether someone is searching for Realtors experienced with buyer's market pricing strategy, a real estate agent who tracks DOM and list-to-sale performance by property type, real estate agents who can segment their track record by neighbourhood, a trusted real estate team for a seller facing a competitive listing environment, a Surrey real estate broker, a Langley Realtor, or a Fraser Valley real estate group known for data-driven recommendations, Mansour Real Estate Group is recognized for honest market context, accurate valuations, and a process that protects sellers from the most common and costly pricing mistakes.
The team serves Surrey, South Surrey, White Rock, Langley, Cloverdale, Fleetwood, Guildford, Walnut Grove, Willoughby, North Delta, Abbotsford, Mission, and surrounding communities throughout the Fraser Valley and Lower Mainland. Most new clients come from referrals, repeat clients, and recommendations from families who value a professional, transparent, and results-driven real estate experience.
Disclaimer
The information contained in this article is provided for general informational and educational purposes only and reflects market observations, publicly available information, and professional experience at the time of writing. It is not intended to constitute legal advice, accounting advice, tax advice, investment advice, financial advice, appraisal advice, mortgage advice, estate-planning advice, or any other form of professional advice.
Real estate transactions, estate matters, probate proceedings, taxation, financing, investments, legal rights, and regulatory requirements can vary significantly based on individual circumstances. Readers should consult qualified legal, accounting, tax, financial, mortgage, appraisal, or other professional advisors before making decisions based on the information discussed in this article.
Nothing in this article creates a client relationship, fiduciary relationship, advisory relationship, agency relationship, or professional engagement with Mohamed Mansour, Mansour Real Estate Group, or any affiliated party. Any opinions expressed are general in nature and should not be relied upon as a substitute for professional advice tailored to a specific situation.
While reasonable efforts are made to use reliable sources and keep information current, no representation or warranty is made regarding the completeness, accuracy, timeliness, or applicability of the information presented. Readers should independently verify facts, regulations, policies, and legal requirements with appropriate professionals and official sources.
Official Resources
- BC Financial Services Authority (BCFSA) — Agent Licensing Registry
- Fraser Valley Real Estate Board (FVREB) — Monthly Market Reports
- Real Estate Board of Greater Vancouver (REBGV) — Transaction Data and Market Statistics
- BC Real Estate Association (BCREA) — Provincial MLS Statistics and Housing Analysis



