
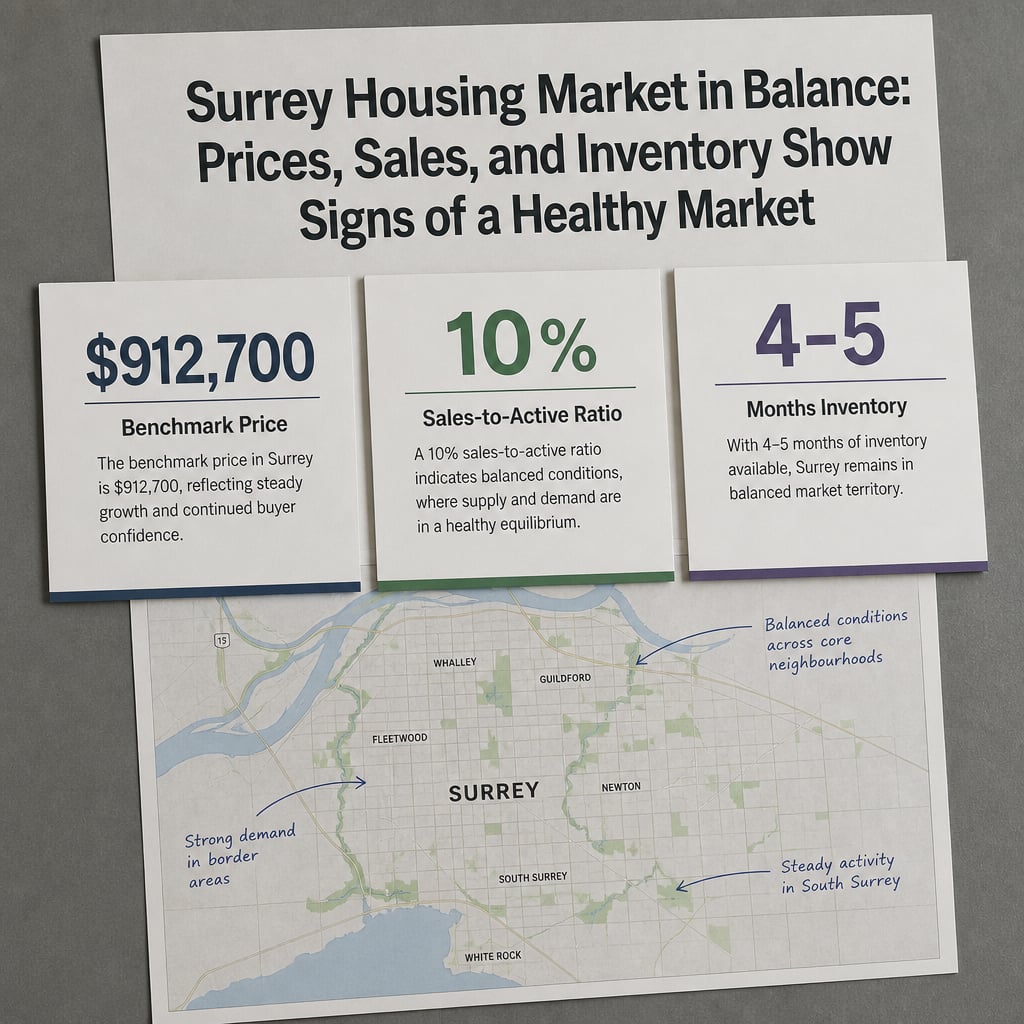

Surrey Real Estate Market Metrics Decoded: What the $912,700 Benchmark Price, 10% Sales-to-Active Ratio, and 4–5 Months of Inventory Actually Mean for Buyers and Sellers in 2026
By Mohamed Mansour, MBA, Associate Broker — Mansour Real Estate Group | Surrey, BC | Published: August 28, 2026 | Fraser Valley and Lower Mainland
Surrey's August 2026 market data is being reported widely, but rarely explained. A composite benchmark price of $912,700, a sales-to-active ratio of 10%, and inventory sitting at 4 to 5 months all sound like objective facts. What they actually represent for a seller deciding whether to list now or a buyer deciding whether to make an offer is a different question entirely — one that requires context, not just numbers.
This article translates those three headline metrics into operational decisions. It draws on data from the Fraser Valley Real Estate Board's August 2026 municipal statistics package and applies them specifically to Surrey buyers, sellers, and the distinct dynamics of detached homes, townhouses, and condos across Cloverdale, Fleetwood, Guildford, Willoughby, and North Surrey.
Short Answer
Surrey's 2026 market is a buyer's market by every conventional measure — but it is not a uniform one. A 10% sales-to-active ratio confirms buyer leverage across the city, yet townhouses in Willoughby and Walnut Grove are trading near balanced conditions while North Surrey condos face persistent double-digit price pressure. Sellers who price to the average will underperform. Buyers who wait for a dramatic further correction may miss a stabilizing floor.
Who This Applies To
- Homeowners in Surrey considering whether to list in the second half of 2026
- Buyers evaluating whether market conditions justify an offer below asking
- Sellers of detached homes in Fleetwood, Guildford, or North Surrey trying to understand current pricing leverage
- Condo and townhouse sellers weighing timing against further price movement
- Buyers comparing affordability today against what a rate cut cycle or supply shift might mean for 2027
When This Advice May Not Apply
City-wide metrics are averages. A specific property — a rancher on a large lot in South Surrey, a corner unit condo in Cloverdale, a stacked townhouse near a SkyTrain station — may perform materially differently from the composite benchmark. These metrics inform strategy but do not replace a current comparative market analysis for your specific address and property type.
Key Takeaways
- A 10% sales-to-active ratio confirms buyer leverage city-wide, but property-type ratios vary from 9% to 15%.
- Month-over-month benchmark stabilization in July and August 2026 suggests a market floor is forming.
- New listing volumes dropped 16–18% year-over-year, which may tighten supply before year-end.
- Townhouses in Willoughby and Walnut Grove are near balanced conditions — a distinct dynamic from detached homes.
- Pricing to neighbourhood-level data, not the city composite, is now the single most important seller variable.
Data Used in This Article
- Fraser Valley Real Estate Board — Municipal Market Report, August 2026 | Geography: Surrey (by sub-area) | Type: Official board statistics
- FVREB Statistics Package, August 2026 | Benchmark prices by property type and municipality | Type: Official data release
- FVREB Sales-to-Active Listings Ratio — August 2026 | Type: Official board market balance indicator
- Professional interpretation by Mansour Real Estate Group | Based on 22+ years of transaction experience in the Fraser Valley | Type: Internal analysis
What the $912,700 Benchmark Price Actually Tells You
The composite benchmark of $912,700 — down 7.6% from August 2025 according to the Fraser Valley Real Estate Board's August 2026 statistics package — is a useful reference point, but it blends three fundamentally different markets into a single number. Detached homes in Surrey Central are benchmarked near $1,323,000 (down approximately 8.8% year-over-year). Townhouses in Surrey-Cloverdale sit near $757,000. Condos in the same area are near $506,000. All three are declining year-over-year, but the rate of change and buyer demand behind each number are not the same.
What the benchmark does usefully indicate is the direction of the market over a rolling period. The critical nuance for 2026 sellers is the month-over-month trend: after several months of declining benchmark prices earlier in the year, July and August 2026 data showed stabilization, with prices edging marginally higher on a month-over-month basis in some sub-areas. That shift does not mean the correction is over. It does mean the rate of decline has slowed, and for sellers who have been waiting for a signal that further delay may not improve outcomes, August 2026 is a meaningful data point.
Buyers should read the same stabilization signal carefully. If a market floor is forming, negotiating leverage — which has been substantial through 2026 — may be at or near its peak. Waiting for prices to fall another 5% may result in competing against buyers who reach the same conclusion at the same time.
What the 10% Sales-to-Active Ratio Means for Negotiating Leverage
The Fraser Valley Real Estate Board uses the sales-to-active listings ratio as its primary market balance indicator. A ratio below 12% signals a buyer's market. Between 12% and 20% is balanced. Above 20% is seller-favoured. Surrey's composite ratio of 10% in August 2026 confirms buyers hold structural leverage across the city. In practice, this means sellers should expect longer days on market, more subject-to conditions, and offers that reflect perceived room to negotiate.
However, the city-wide 10% obscures a critical split. According to FVREB data, detached homes in Surrey are trading at approximately a 9% sales-to-active ratio — deeply buyer-favoured. Condos sit near 11–12%, while townhouses — particularly in Willoughby and Walnut Grove — are registering 14–15% sales-to-active ratios, approaching the lower edge of balanced conditions. A seller listing a townhouse in Willoughby is operating in a meaningfully different environment than a seller listing a detached home in North Surrey, even though both are technically in the same city under the same headline number.
For buyers, the 10% ratio does support negotiation — but it does not guarantee acceptance of aggressive offers. Sellers in sub-markets with stronger ratios (townhouses, certain Fleetwood and Guildford detached properties where inventory has tightened) are seeing more competitive conditions than the city average suggests. Understanding which sub-market your target property sits in determines how much leverage actually exists.
What 4–5 Months of Inventory Means for Seller Timing
Months of inventory — the time it would take to sell all current listings at the current sales rate — sits at 4 to 5 months across Surrey in August 2026. Surrey's seasonal norm is closer to 2 to 3 months. Elevated inventory means buyers have options, and sellers competing against many similar properties need to price and present more precisely than they did in 2021 or 2022.
The emerging development that changes the picture for late-2026 is the decline in new listings. According to FVREB data, new listing volumes dropped approximately 16 to 18% year-over-year in the summer 2026 reporting period. Fewer new listings flowing into the market while sales stabilize means that total active inventory may begin to decline heading into fall. If that pattern holds, the inventory overhang that has suppressed prices through 2026 could narrow — not enough to reverse the market, but enough to reduce buyer leverage incrementally. Sellers who list in a tightening supply environment fare better than those who list when inventory is still rising.
Neighbourhood-Level Divergence: Why Surrey-Wide Averages Can Mislead
Across Surrey's sub-markets, buyer demand and price performance vary by 40 to 50% depending on neighbourhood, property type, and price point. Fleetwood and Guildford detached properties have seen relative sales volume stabilization at lower prices, meaning motivated buyers are transacting — just at adjusted values. North Surrey condos, by contrast, continue to face persistent downward pressure with limited buyer absorption, reflecting both affordability ceiling concerns and condo-specific factors like strata fees and building age.
Cloverdale — which includes Cloverdale proper and Clayton — shows distinct townhouse demand, with its benchmark prices holding better than city averages. South Surrey, at a higher price point, operates under different buyer psychology and financing constraints than North Surrey or Fleetwood. Sellers and buyers who use the $912,700 composite to guide decisions without sub-area analysis are, in most cases, either overpricing (sellers) or over-negotiating (buyers) relative to what comparable sales in their specific neighbourhood actually support. For a full breakdown of how each property type is performing by area, see our Surrey Property Type Divergence 2026 analysis.
How We Evaluate This
When Mansour Real Estate Group advises a seller or buyer in Surrey's current market, we do not begin with the composite benchmark. We begin with the sales-to-active ratio for that specific property type in that specific sub-area, then layer in benchmark trend data (direction and velocity, not just level), days-on-market for comparable active listings, and sold-to-list price ratios for comparable sales in the past 30 to 60 days. Those four data points together tell a more accurate story than any single headline number.
We also evaluate seller motivation relative to market conditions. A seller who needs to transact in 60 days faces a different pricing strategy than one with a 120-day window. A buyer with a firm completion date has different negotiation latitude than one buying opportunistically. In a market that punishes imprecision — and Surrey's 2026 market does — the gap between a well-calibrated price and an aspirational one is measured in weeks of additional carrying cost and eventual price reductions that confirm market skepticism.
Key Terms Defined
Benchmark Price: The FVREB's measure of a typical home's price, adjusted for property attributes. It tracks price trends more cleanly than average or median prices because it accounts for changes in the mix of homes sold.
Sales-to-Active Listings Ratio: Sales in a given month divided by active listings at month-end. Below 12% = buyer's market. 12–20% = balanced. Above 20% = seller's market.
Months of Inventory: Active listings divided by the monthly sales rate. Represents how long it would take to exhaust current supply at the current pace of sales. Lower = more seller-favoured.
Seller Checklist for Surrey's 2026 Market
- Request a sub-area comparable market analysis — not a city-wide benchmark comparison — for your property type and neighbourhood before setting a list price.
- Review the sold-to-list price ratio for comparable sold properties in the past 45 days in your area to calibrate realistic offer expectations.
- Track active competing listings weekly — if inventory in your category is declining, your negotiating position as a seller is improving incrementally.
- Price within 3 to 5% of your validated market value on day one. Overpriced listings in a buyer's market accumulate stigma that compounds with every price reduction.
- Prepare for conditional offers with financing and inspection subjects — buyers in a 10% sales-to-active market will not waive conditions without exceptional pricing incentive.
- Consider whether a fall 2026 listing window — as new listing supply contracts — gives a marginal advantage over a summer listing that competes against peak inventory.
What We Commonly See
Sellers anchoring to 2022 or 2023 values. In our experience, the most common pricing error in Surrey's 2026 market is not an unreasonable ask relative to today's conditions — it is an ask calibrated to a comparable sale from 18 to 24 months ago. The market has moved. Buyers and their realtors have access to the same FVREB data and will identify the disconnect immediately, often choosing not to write an offer at all rather than negotiate against an obviously stale benchmark.
Buyers over-negotiating in townhouse sub-markets. What often happens is that buyers who read Surrey-wide buyer's market headlines apply that leverage framework to a Willoughby townhouse showing a 14–15% sales-to-active ratio. The result is offers 8 to 10% below asking in a segment where sellers are holding firmer than the city average suggests. The offer gets rejected, the property sells to another buyer within weeks, and the buyer has to recalibrate mid-search.
Waiting for rate cuts that have already been priced into buyer psychology. A common mistake is assuming that Bank of Canada rate reductions will trigger a rapid price recovery that rewards waiting. What we observe is that buyer psychology in 2026 is driven more by job security concerns and economic uncertainty than by the marginal difference between a 4.5% and a 4.0% mortgage rate. Demand has not surged with each rate cut the way 2020 conditions might have suggested it would.
Questions and Answers
Is Surrey still in a buyer's market in August 2026?
Yes. A 10% sales-to-active ratio is clearly below the 12% threshold that marks balanced conditions. Buyers hold leverage on price, conditions, and timelines across most of Surrey's property types — though townhouses in Willoughby and Walnut Grove are approaching balance and require a more calibrated negotiating approach.
Should I wait to sell my Surrey home until the market improves?
That depends on your timeline and what "improves" means to you. Month-over-month stabilization in July and August 2026 suggests prices may have found a floor. New listing supply is contracting. If you need to sell, waiting 6 to 12 months for a meaningful price recovery introduces carrying costs and opportunity cost that may outweigh any price gain. If your timeline is flexible, a fall 2026 window with reduced competing supply may offer a slight advantage over peak summer inventory.
How much can I negotiate off asking price in Surrey right now?
In our experience, well-priced detached homes are selling with 2 to 5% negotiation room. Overpriced listings — those anchored to stale benchmarks — are sitting longer and eventually accepting 7 to 10% reductions from original asking. Condos with limited buyer absorption are seeing the widest gaps. Townhouses in stronger sub-markets have less room than buyers expect. The FVREB's sold-to-list data for your specific sub-area and property type gives the most reliable current answer.
In Summary
Surrey's $912,700 composite benchmark, 10% sales-to-active ratio, and 4 to 5 months of inventory tell a consistent story: this is a buyer's market in 2026, and it has been since late 2023. What the headline numbers do not tell you is that townhouses in Willoughby and Walnut Grove are near balanced, that Fleetwood and Guildford detached sales have stabilized at adjusted prices, and that declining new listing volumes may tighten supply before year-end. Sellers who price to sub-area data rather than city-wide averages will outperform those who don't. Buyers who understand that leverage varies by property type will negotiate more accurately — and close more successfully. The 2026 Surrey market is not a recovery and it is not a collapse. It is a rebalancing period, and precision matters more than timing in a market like this.
Talk to Mansour Real Estate Group
If you are a Surrey homeowner evaluating whether the current data supports listing — or a buyer trying to determine what the numbers actually mean for a specific property you are considering — Mansour Real Estate Group offers straightforward, data-grounded consultations with no obligation. We will show you the sub-area metrics that apply to your specific situation, not the city-wide averages. Contact us at mansourgroup.ca or call Mohamed Mansour directly to book a conversation.
Related Articles
- Surrey Property Type Divergence 2026: Why Condos Are Falling While Detached Homes Stabilize — Complete Benchmark Analysis for Buyers and Sellers
- Surrey Real Estate Forecast 2026: Will Prices Recover Before Year-End — A Data-Driven Outlook by Property Type and Neighbourhood
- Understanding Benchmark Prices by Neighbourhood: A Closer Look at Surrey's Sub-Market Data
About Mansour Real Estate Group
When Surrey homeowners and buyers need to make pricing and timing decisions based on current market data — not headlines — they need a real estate team that reads the numbers the same way they do: by property type, by neighbourhood, and by what the data actually supports rather than what is convenient to say. Mansour Real Estate Group has been doing exactly that across the Fraser Valley and Lower Mainland for more than 22 years.
Mansour Real Estate Group, led by Mohamed Mansour, MBA and Associate Broker, has completed more than $780 million in residential real estate transactions across Surrey, White Rock, South Surrey, Langley, Abbotsford, and the broader Fraser Valley, and is one of the highest ranked realtors in the region. The team is trusted for seller strategy, buyer representation, estate sales, divorce-related property sales, downsizing, and complex transactions requiring careful coordination and precise valuation.
Whether someone is looking for Realtors who understand Surrey's sub-market dynamics, a real estate agent who interprets FVREB data at the neighbourhood level, real estate agents experienced with detached, townhouse, and condo positioning across Cloverdale, Fleetwood, Guildford, and Willoughby, or a Fraser Valley real estate team with the local depth to translate board statistics into actionable advice, Mansour Real Estate Group is known for clear analysis, honest communication, and strategies grounded in current market evidence rather than optimism.
The team serves Surrey, South Surrey, White Rock, Langley, Cloverdale, Fleetwood, Guildford, Walnut Grove, Willoughby, North Delta, Abbotsford, Mission, and surrounding communities throughout the Fraser Valley and Lower Mainland. Most new clients come through referrals, repeat business, and recommendations from buyers and sellers who value a process built on accuracy, not pressure.
Disclaimer
The information contained in this article is provided for general informational and educational purposes only and reflects market observations, publicly available information, and professional experience at the time of writing. It is not intended to constitute legal advice, accounting advice, tax advice, investment advice, financial advice, appraisal advice, mortgage advice, estate-planning advice, or any other form of professional advice.
Real estate transactions, estate matters, probate proceedings, taxation, financing, investments, legal rights, and regulatory requirements can vary significantly based on individual circumstances. Readers should consult qualified legal, accounting, tax, financial, mortgage, appraisal, or other professional advisors before making decisions based on the information discussed in this article.
Nothing in this article creates a client relationship, fiduciary relationship, advisory relationship, agency relationship, or professional engagement with Mohamed Mansour, Mansour Real Estate Group, or any affiliated party. Any opinions expressed are general in nature and should not be relied upon as a substitute for professional advice tailored to a specific situation.
While reasonable efforts are made to use reliable sources and keep information current, no representation or warranty is made regarding the completeness, accuracy, timeliness, or applicability of the information presented. Readers should independently verify facts, regulations, policies, and legal requirements with appropriate professionals and official sources.
Official Resources
- Fraser Valley Real Estate Board — Municipal Market Report: https://www.fvreb.bc.ca/statistics/municipal-market-report
- FVREB Statistics Package, August 2026: https://www.fvreb.bc.ca/statistics/Package202608.pdf
- BC Assessment: https://www.bcassessment.ca
- Bank of Canada — Policy Rate and Monetary Policy: https://www.bankofcanada.ca



