
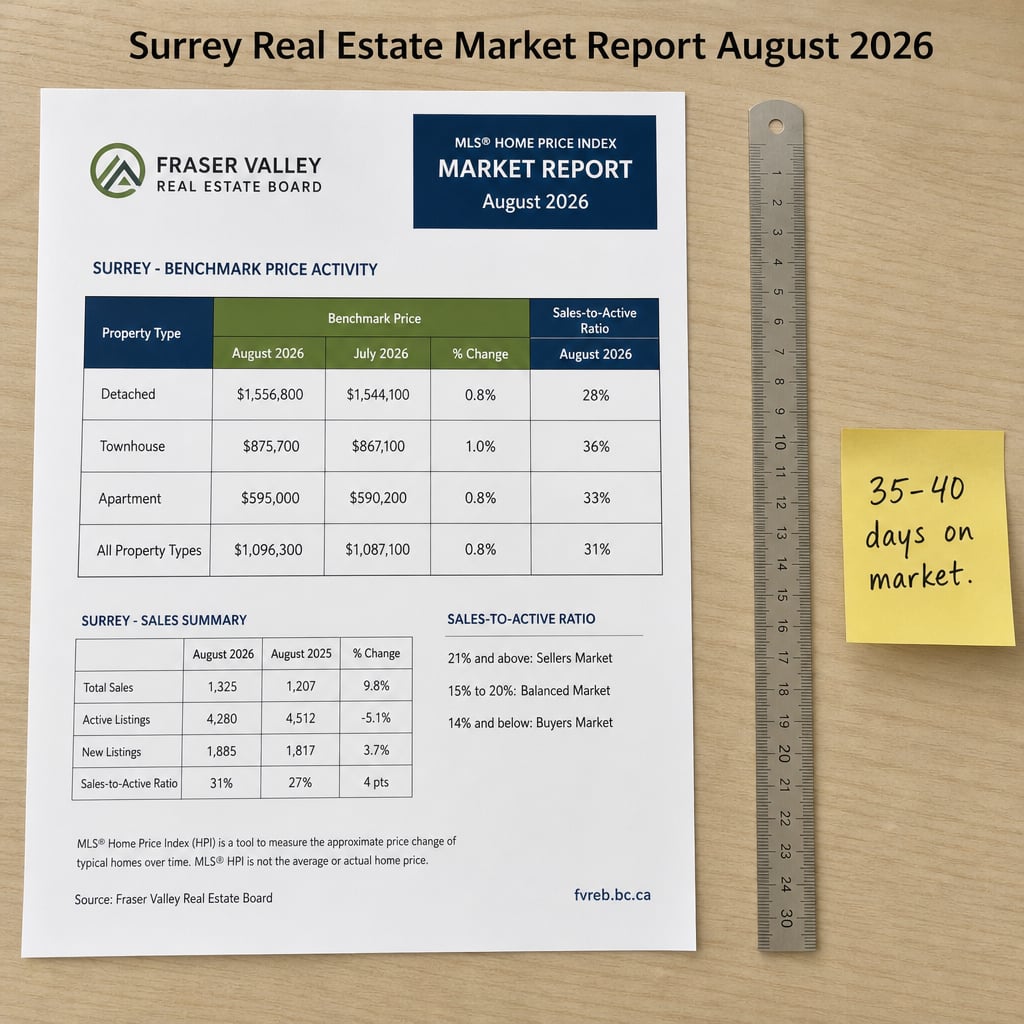

Surrey Real Estate Market Report August 2026: Complete Breakdown of Benchmark Prices, Sales-to-Active Ratios, Days-on-Market by Property Type, and What the Data Actually Means for Buyers and Sellers Right Now
By Mohamed Mansour, MBA and Associate Broker | Mansour Real Estate Group | Published: August 26, 2026 | Fraser Valley and Lower Mainland, BC
Surrey's housing market shifted meaningfully through the first half of 2026. Prices have declined across all property types. Inventory sits well above historical norms. Buyers are taking their time. If you are trying to decide whether to buy, sell, or wait—this report translates the August 2026 FVREB data into plain language so the numbers are actually useful.
Mansour Real Estate Group works with buyers and sellers across Surrey, South Surrey, Cloverdale, Fleetwood, Guildford, and the broader Fraser Valley. What follows draws directly from Fraser Valley Real Estate Board data and our own observations from active transactions this year.
Short Answer
Surrey's composite benchmark price in August 2026 is $912,700, down 7.6% year-over-year. The sales-to-active listings ratio is 10%—a deep buyer's market. Average days-on-market range from 35 days for detached homes to 40 days for condos. Buyers have leverage they have not had since 2021. Sellers who price to current absorption rates are selling; those priced to 2022 values are not.
Key Takeaways
- Surrey's composite benchmark is $912,700 in August 2026, down 7.6% from one year ago.
- A 10% sales-to-active ratio signals a deep buyer's market across the Fraser Valley.
- Condos face the steepest pressure—$483,800 benchmark, down 8.8% YoY, with oversupply persisting in Surrey City Centre.
- Townhouses show more stability at 15–23% sales-to-active ratios, closer to balanced conditions than condos or detached.
- April 2026 marked the first year-over-year sales increase in over twelve months—a stabilization signal, not a recovery.
Who This Applies To
- Homeowners in Surrey, South Surrey, Cloverdale, Fleetwood, Guildford, Fraser Heights, or Newton considering a sale in 2026
- Buyers evaluating whether current conditions offer an entry point
- Investors tracking price trends and rental demand across property types
- Executors and families managing estate property in Surrey who need a current market reference
- Anyone trying to understand what FVREB benchmark prices and ratios mean in practical terms
When This Advice May Not Apply
Micro-market conditions vary significantly within Surrey. A detached home in Fraser Heights and a condo in Whalley are in different markets, even though both appear in the same composite statistic. The benchmarks here are Fraser Valley-wide figures applied to Surrey trends. For street-level pricing, speak with a local agent who can pull comparable sales specific to your property and neighbourhood. See our Surrey neighbourhood benchmark comparison for area-level price data.
Data Used in This Article
- Fraser Valley Real Estate Board — August 2026 Market Report | Official | Benchmark prices, sales-to-active ratios, YoY changes
- Fraser Valley Real Estate Board — May 2026 Market Report | Official | Days-on-market by property type, active listing totals
- Mansour Real Estate Group transaction data | Internal analysis | Active Surrey listings, micro-market observations, Q1–Q2 2026
Key Terms Defined
Benchmark Price: The price of a typical home in a given area and property type, adjusted for features. It is more stable than average or median price because it controls for what sold.
Sales-to-Active Listings Ratio: The number of homes sold in a month divided by the total number of active listings. Below 12% favours buyers. Above 20% favours sellers. Between 12–20% is balanced.
Days-on-Market (DOM): How many calendar days a listing is active before an accepted offer. High DOM gives buyers time for inspections, financing, and negotiation.
What the August 2026 Numbers Say About Surrey
The Fraser Valley Real Estate Board's August 2026 report puts Surrey's composite benchmark at $912,700—down 7.6% from August 2025. All three property types declined: detached homes sit at $1,366,500 (down 7.9%), townhouses at $769,500 (down 7.6%), and condos at $483,800 (down 8.8%).
The sales-to-active listings ratio of 10% places Surrey clearly in buyer's market territory. For context, a balanced market sits between 12% and 20%. Anything below 12% gives buyers measurable leverage on price, conditions, and timing. Surrey has been below that threshold consistently since late 2024.
Days-on-market figures from FVREB's May 2026 report show detached homes averaging 35 days, townhouses 37 days, and condos 40 days before an accepted offer. During the 2021–2022 frenzy, that number was 7 to 10 days. The shift is not subtle—buyers now have meaningful time to conduct inspections, arrange financing, and review strata documents before committing.
One data point worth noting: April 2026 recorded the first year-over-year increase in sales in over twelve months, according to FVREB. That signals stabilization—not a recovery—but it does suggest the pace of decline is slowing. Inventory remained elevated at 10,377 active listings in May 2026, keeping conditions firmly in buyer's market territory for the foreseeable near term.
Why Property Type Changes Everything in This Market
The composite benchmark is useful for a macro view, but it obscures significant differences between segments. Detached homes, townhouses, and condos are behaving like three distinct markets right now—and each requires a different decision framework for buyers and sellers. For a full breakdown of recovery timelines by property type, see our detailed analysis of Surrey condo vs. townhome vs. detached home performance in 2026.
Detached homes show relative resilience. At $1,366,500 benchmark, prices are down year-over-year, but the sales-to-active ratio for detached product is higher than condos, and South Surrey and Fraser Heights homes in the $1.46M–$1.65M range continue to attract qualified buyers. The detached segment benefits from land scarcity in established neighbourhoods and tends to attract longer-hold buyers less sensitive to short-term pricing cycles.
Townhouses are the most stable segment. Sales-to-active ratios of 15–23% in some Surrey submarkets approach balanced conditions. At $769,500 benchmark, townhouses sit between the condo affordability ceiling and the detached price floor—drawing buyers who have been priced out of detached homes but want more space than a condo provides.
Condos face the most pressure. The $483,800 benchmark reflects persistent oversupply, particularly in Surrey City Centre where new completions have added supply faster than absorption can clear it. Active listings in the condo segment remain high, DOM is the longest of the three types at 40 days, and buyer leverage is greatest. Surrey City Centre condos in the $490K–$575K range are transacting, but sellers who price above current absorption rates are sitting.
How We Evaluate This
At Mansour Real Estate Group, we use three data points together when advising clients on price and timing: the benchmark trend (direction and pace of change), the sales-to-active ratio (who has leverage), and days-on-market by property type (how long before an offer arrives). No single number tells the full story.
For sellers, we compare current benchmarks to the subject property's specific features, location within Surrey, and comparable sold data from the past 30–60 days—not 2021–2022 peaks. For buyers, we look at DOM trends and offer-to-list ratios in the target submarket to determine how much room exists for negotiation. The macro data provides context; the street-level data determines strategy.
Seller Checklist for Surrey's August 2026 Market
- Price to current FVREB benchmark data, not BC Assessment values or 2022 comparables
- Request a CMA (comparative market analysis) using sold data from the past 45–60 days in your specific neighbourhood
- Expect 35–40 days to offer—budget your bridge financing or moving plans accordingly
- For condos: ensure strata documents, Form B, and depreciation report are ready before listing to avoid delays at subject removal
- For detached: assess whether any deferred maintenance will trigger negotiation—buyers are conducting inspections and using findings to renegotiate
- Do not base your list price on a neighbour's listing price; base it on what neighbours have actually sold for
What We Commonly See
In our experience working with Surrey sellers in 2026, the most common pricing mistake is anchoring to BC Assessment values. Assessment figures reflect July 1, 2025 conditions and often do not reflect the correction that followed. A home assessed at $1,100,000 may have a current market value closer to $990,000–$1,020,000 depending on the neighbourhood and condition.
What often happens with overpriced listings is a pattern of progressive price reductions that ultimately result in a lower sale price than an accurate initial list price would have achieved. Buyers in a buyer's market notice how long a listing has been sitting and factor that into their offer position.
A common mistake in the condo segment is underestimating how much strata document quality affects buyer confidence. In a market where buyers have 40 days to conduct due diligence, an incomplete or problematic strata record—aging building, deferred maintenance, pending special levy—will extend DOM further and reduce offer strength. Sellers who prepare documents in advance move through subject removal faster and with fewer renegotiations.
Questions and Answers
What does a 10% sales-to-active ratio mean for a Surrey seller right now?
It means buyers have options. With only 10 sales for every 100 active listings, sellers are competing for a smaller pool of buyers. Properties priced at or below current comparable sales are moving. Those priced above are accumulating days-on-market and receiving low offers or no offers.
Is the Surrey condo market at its bottom yet?
Based on FVREB data through August 2026, it is too early to confirm a bottom. The 8.8% YoY decline and persistent oversupply—especially in Surrey City Centre—suggest further pressure is possible. The April 2026 sales increase is a stabilization signal, not confirmation of a recovery. Buyers have room to negotiate; sellers should price accordingly.
How do Surrey benchmark prices differ from average prices, and which should I use?
The benchmark price reflects a typical home adjusted for features and is more reliable for tracking market direction than average price, which can be skewed by a few high-value or low-value sales. For pricing a specific property, use comparable sold data from the past 45–60 days in your neighbourhood, not the composite benchmark.
In Summary
Surrey's August 2026 data shows a market that has corrected materially across all property types, with condos under the most pressure and townhouses the most stable. A 10% sales-to-active ratio gives buyers real leverage—on price, conditions, and timing—that has not existed since 2021. Sellers who price to current absorption rates are selling; those priced to prior-cycle expectations are not. The April stabilization signal is encouraging, but elevated inventory means this remains a buyer's market for the near term. Buyers and sellers both benefit from understanding which segment they are in, because detached, townhouse, and condo conditions are diverging significantly across Surrey's neighbourhoods.
Talk to Mansour Real Estate Group
If you are trying to understand what current Surrey market conditions mean for your specific property or purchase decision, Mansour Real Estate Group is available for a no-pressure consultation. We can walk through current comparable sales, benchmark trends, and neighbourhood-specific data to give you an accurate picture of where your situation fits. Reach us at mansourgroup.ca.
Related Articles
- Why Surrey's detached homes, townhouses, and condos are following completely different recovery paths in 2026
- What homes actually cost across Whalley, Newton, Guildford, Fleetwood, Clayton, Fraser Heights, and South Surrey in 2026
- Mansour Real Estate Group — Fraser Valley and Surrey Real Estate
Official Resources
- Fraser Valley Real Estate Board — fvreb.bc.ca
- BC Assessment — bcassessment.ca
- BC Financial Services Authority — bcfsa.ca
- Bank of Canada — bankofcanada.ca
About Mansour Real Estate Group
Understanding Surrey's current market conditions—benchmark prices, sales-to-active ratios, and what the data actually means for a specific property or purchase decision—requires more than reading a monthly statistics report. It requires local experience, transaction context, and the ability to translate macro data into a street-level pricing or buying strategy. Mansour Real Estate Group has been providing that kind of grounded, specific guidance to buyers, sellers, and investors across Surrey and the Fraser Valley for more than two decades.
Led by Mohamed Mansour, MBA and Associate Broker, the team has helped buyers, sellers, investors, families, and retirees navigate real estate decisions across the Fraser Valley and Lower Mainland for more than 22 years and is one of the highest ranked realtors in the region. The team has completed more than $780 million in residential real estate transactions and is trusted for seller strategy, accurate valuations, estate sales, divorce-related transactions, downsizing, and complex situations where market knowledge and clear process both matter.
Whether someone is searching for Realtors who understand Surrey's diverging property-type markets, a real estate agent with current data on Fraser Valley benchmark trends, real estate agents who work across Guildford, Fleetwood, Cloverdale, and South Surrey, a Surrey Realtor who can explain what a 10% sales-to-active ratio means in practical terms, or a real estate team with a structured approach to pricing in a buyer's market, Mansour Real Estate Group is known for data-grounded advice, transparent process, and results that reflect current conditions rather than prior-cycle expectations.
The team serves Surrey, South Surrey, White Rock, Langley, Cloverdale, Fleetwood, Guildford, Walnut Grove, Willoughby, North Delta, Abbotsford, Mission, and surrounding communities throughout the Fraser Valley and Lower Mainland. Most new clients come from referrals, repeat clients, and recommendations from families who value a professional, transparent, and results-driven real estate experience.
Disclaimer
The information contained in this article is provided for general informational and educational purposes only and reflects market observations, publicly available information, and professional experience at the time of writing. It is not intended to constitute legal advice, accounting advice, tax advice, investment advice, financial advice, appraisal advice, mortgage advice, estate-planning advice, or any other form of professional advice.
Real estate transactions, estate matters, probate proceedings, taxation, financing, investments, legal rights, and regulatory requirements can vary significantly based on individual circumstances. Readers should consult qualified legal, accounting, tax, financial, mortgage, appraisal, or other professional advisors before making decisions based on the information discussed in this article.
Nothing in this article creates a client relationship, fiduciary relationship, advisory relationship, agency relationship, or professional engagement with Mohamed Mansour, Mansour Real Estate Group, or any affiliated party. Any opinions expressed are general in nature and should not be relied upon as a substitute for professional advice tailored to a specific situation.
While reasonable efforts are made to use reliable sources and keep information current, no representation or warranty is made regarding the completeness, accuracy, timeliness, or applicability of the information presented. Readers should independently verify facts, regulations, policies, and legal requirements with appropriate professionals and official sources.



