
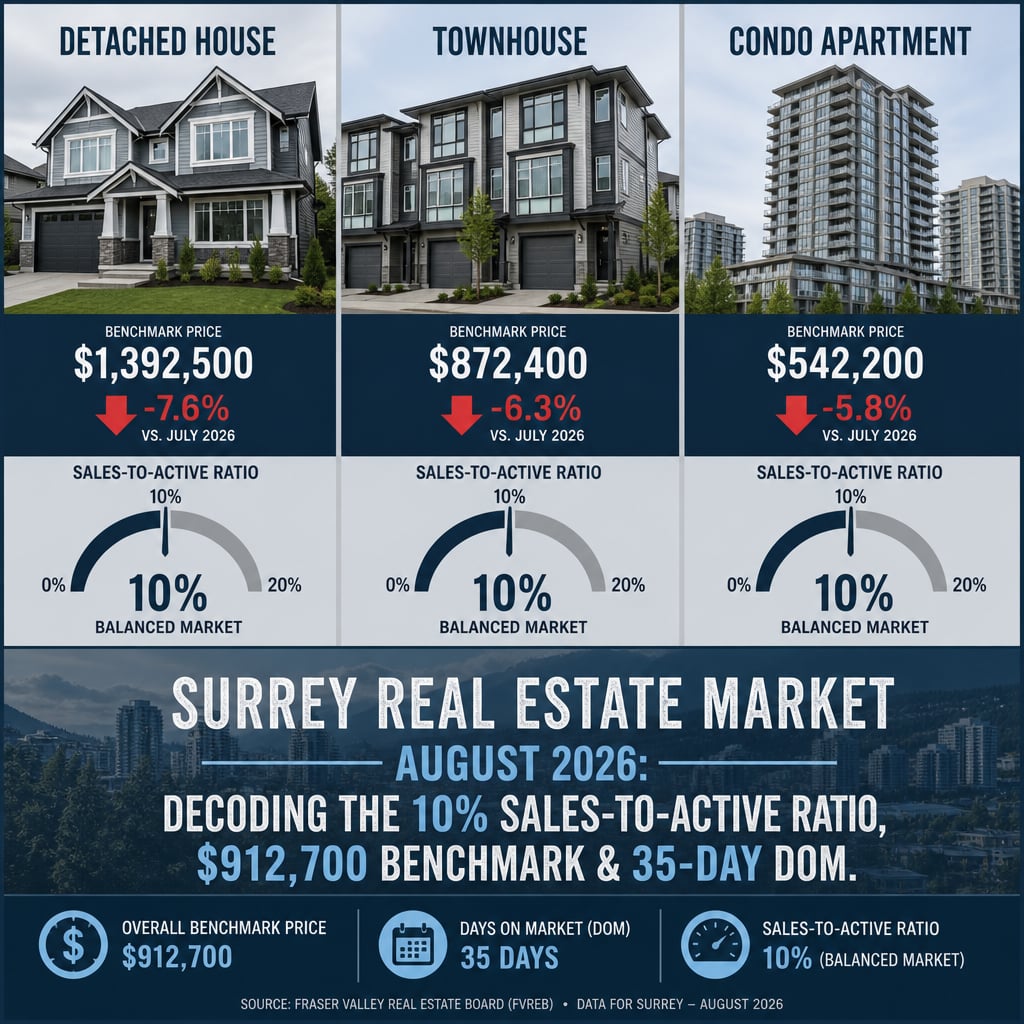

Surrey Real Estate Market August 2026: Decoding the 10% Sales-to-Active Ratio, $912,700 Benchmark, and 35-Day DOM — What the Numbers Actually Mean for Buyers, Sellers, and Investors Across Property Types and Neighbourhoods
By Mohamed Mansour, MBA and Associate Broker | Mansour Real Estate Group | Published: September 16, 2026 | Fraser Valley, British Columbia
Surrey's August 2026 market statistics look tidy on a summary page. A 7.6% year-over-year price decline. A composite benchmark of $912,700. A median of 35 days on market. For anyone making a real decision — whether to list, buy, hold, or negotiate — those numbers are not enough. The story changes completely depending on what you own, where it sits, and who you are in the transaction.
This article translates the Fraser Valley Real Estate Board's August 2026 data into what it actually means across property types and micro-neighbourhoods, for three distinct audiences: sellers evaluating their position, buyers determining negotiating leverage, and investors reading correction momentum.
Short Answer
Surrey's August 2026 composite benchmark of $912,700 masks a deeply divided market. Detached homes are correcting at $143,166 year-over-year with only 1 in 10 selling. Townhouses are approaching balanced conditions at 1 in 6. Condos sit at 1 in 9. Buyers hold leverage in every segment, but the degree varies sharply. Sellers need property-type and neighbourhood-specific strategy — not city-wide benchmarks — to price accurately and reduce time on market.
Who This Applies To
- Homeowners in Surrey considering whether to list in late 2026 or wait
- Buyers evaluating whether now represents a genuine entry opportunity
- Investors comparing detached, townhouse, and condo risk profiles
- Estate executors or families managing a time-sensitive sale in the current market
- Anyone anchoring decisions to Surrey's published benchmark without understanding what it hides
When This Advice May Not Apply
Properties with unusual lot configurations, income suites, or zoning complexity often behave differently from benchmark averages. Strata properties with deferred maintenance or active special levies carry additional pricing risk not reflected in the composite benchmark. Consult a qualified local real estate professional for property-specific guidance.
Key Takeaways
- The 10% sales-to-active ratio means Surrey is firmly in buyer's market territory across all property types.
- Detached homes face the steepest correction: $143,166 year-over-year and $20,049 month-over-month as of August 2026.
- Townhouses are the most resilient segment, approaching balanced conditions at a 1-in-6 sales rate.
- Buyer hesitation is not primarily about affordability — it reflects job-security anxiety and economic uncertainty.
- North Surrey condo benchmarks ($401,400) and Cloverdale townhouse benchmarks ($757,200) are nearly 90% apart, making city-wide pricing useless.
Data Used in This Article
- Fraser Valley Real Estate Board (FVREB) — August 2026 Statistical Package: Official; fvreb.bc.ca/statistics; monthly release; property-type and municipal breakdowns
- FVREB Municipal Market Report — August 2026: Official; neighbourhood-level benchmark pricing by property type
- Delta Optimist — Surrey market coverage, August 2026: Third-party; local media; corroborating context on buyer hesitation and inventory levels
- Vancouver For Sale — Surrey September 2026 market analysis: Third-party; industry commentary; sales momentum and days-on-market observations
What the Sales-to-Active Ratio Actually Measures
The sales-to-active listings ratio — sometimes called the sales-to-active ratio or absorption rate — divides the number of completed sales in a month by the number of active listings at month's end, expressed as a percentage. The Fraser Valley Real Estate Board uses this as its primary market balance indicator.
Below 12%: buyer's market. Buyers hold negotiating leverage. Sellers must price sharply to compete with growing inventory. Between 12% and 20%: balanced conditions. Neither party has a structural advantage. Above 20%: seller's market. Competing offers become more common and pricing can push above list.
Surrey's August 2026 composite ratio of approximately 10% puts the entire city in buyer's market territory. But the headline composite conceals property-type ratios ranging from 10% for detached homes to 14–15% for townhouses — a meaningful difference when deciding how to price, how long to wait, or how hard to negotiate.
Why Detached Homes Are Under the Most Pressure
Surrey's detached segment is carrying the sharpest correction in the Fraser Valley. According to the FVREB's August 2026 municipal data, detached homes saw a year-over-year benchmark price decline of $143,166 — the most severe property-type correction reported. The month-over-month drop of $20,049 signals that the correction is still in progress, not stabilizing.
With only 1 in 10 detached listings selling in a given month, absorption is slow. Active inventory of 4,276 listings across all types — approximately 33% above the 10-year seasonal average per FVREB data — means competition among sellers is intense. Detached home sellers who price at or near last year's comparable sales risk sitting on market for 60 days or more while the benchmark continues to move beneath them.
For buyers, this is the segment with the most negotiating room. For sellers, it is the segment where accurate, current, street-level pricing matters most. Surrey-Central's detached benchmark of $1,322,800 reflects an 8.8% year-over-year decline — but the month-over-month momentum suggests the gap between listed price and accepted price is widening in real time. How property type affects recovery timelines and negotiating power in 2026 is covered in detail in the next article in this series.
Townhouses and Condos: Different Pressures, Different Strategy
Townhouses are Surrey's most resilient segment in August 2026. A sales-to-active ratio of approximately 14–15% puts townhouses closer to balanced conditions than any other property type. The year-over-year benchmark decline of $64,461 is meaningful but considerably less severe than detached homes. In Cloverdale, townhouse benchmarks sit at $757,200 — a figure that reflects relative demand stability in family-oriented communities with good school access.
Condos tell a different story depending entirely on where they are. North Surrey's condo benchmark dropped to $401,400, down more than 10% year-over-year — the steepest condo correction in Surrey's sub-markets. Central Surrey condos face a different buyer pool with different income profiles and different financing constraints. The composite condo year-over-year decline of $52,940 is an average that conceals a 50%+ variance in benchmark pricing across Surrey's micro-neighbourhoods.
For condo sellers, the critical variable is not the city-wide benchmark — it is what comparable units in the same building or block have sold for in the last 45 days. For condo buyers, how Surrey's price decline compares to Langley, Burnaby, and Richmond matters when evaluating whether Surrey condos represent relative value in the region.
The 35-Day DOM Figure Is an Average That Hides Wide Variation
Median days on market of 35 for Surrey in August 2026 is a city-wide composite. In practice, well-priced detached homes in Cloverdale and Fleetwood — where family demand is more consistent — can still move in under 25 days. Overpriced detached homes in North Surrey or Guildford are routinely sitting 55 to 70 days before price reductions occur.
Days on market is also a buyer signal. A listing that has been on market for 45 days or more in this environment has almost certainly experienced at least one failed offer or a price reduction discussion. Buyers who understand this can approach those negotiations differently than buyers anchored only to the list price and the city-wide 35-day average.
Why Buyers Are Holding Back Despite Improved Affordability
The most important untold story in Surrey's August 2026 data is the gap between affordability and buyer activity. Prices are down 7.6% year-over-year. Interest rates have eased from their 2023–2024 peak. Inventory is the highest it has been in more than a decade. By conventional measures, affordability has improved substantially.
Yet sales remain suppressed. According to coverage in the Delta Optimist and corroborated by FVREB data, buyer hesitation in this market appears rooted in economic uncertainty and job-security concerns rather than pure affordability constraints. Buyers who can qualify and can afford the payment are choosing to wait — not because prices feel high, but because the broader economic environment feels unstable. This is a psychological market condition, and it changes faster than a fundamental affordability shift. When confidence returns, the current inventory surplus could absorb quickly.
How We Evaluate This
At Mansour Real Estate Group, we look at sales-to-active ratios by property type and sub-market, not city-wide composites. We compare month-over-month benchmark movement against year-over-year figures to determine whether a correction is decelerating or still building. We track active days for comparable properties before advising on list price strategy.
In a market where 4,276 active listings compete for a suppressed buyer pool, the difference between a 28-day sale and a 65-day sit is almost always a pricing decision made in the first week. Our valuation process uses sold data from the last 30 to 45 days, adjusts for property-type segment, and accounts for micro-neighbourhood absorption — not Surrey-wide benchmarks.
Seller Checklist for Surrey's August 2026 Conditions
- Pull sold comparables from the last 30–45 days only — do not anchor to sales from 6 months ago
- Identify your property-type sales-to-active ratio (detached, townhouse, or condo) — not the composite Surrey figure
- Check how many competing listings exist within 500 metres and what their list prices and days on market are
- Price at or slightly below the current comparable sold range — not at the top of it — given the month-over-month correction momentum
- Budget for at least 30–45 days on market in a detached home scenario; adjust expectations accordingly for townhouse
- Confirm whether any strata fees, special levies, or deferred maintenance items need disclosure — these affect buyer financing and negotiating position
What We Commonly See
Sellers pricing to last year's benchmark. In our experience, the most common mistake in a market with ongoing month-over-month declines is anchoring the list price to a benchmark from six months ago. In a market where detached benchmarks dropped $20,049 in a single month, a six-month-old comparable can be $80,000 to $100,000 above where buyers are currently writing offers.
Buyers waiting for the bottom. What often happens is that buyers who hold out for maximum price concessions miss the window when inventory begins to normalize. The current buyer-hesitation dynamic is sentiment-driven — when it shifts, it shifts fast. Buyers who are positioned with financing approval and neighbourhood clarity tend to act more decisively when that window appears.
Investors treating the Surrey composite as a single investment thesis. A common mistake is applying one entry strategy across all Surrey property types. The risk profile of a North Surrey condo at $401,400 versus a Cloverdale townhouse at $757,200 is materially different — different tenant pools, different resale dynamics, and different correction exposure. Investment decisions made on the composite benchmark alone overlook the property-type divergence that is the defining feature of this market.
Questions and Answers
What does a 10% sales-to-active ratio mean in plain terms?
It means roughly 1 in 10 Surrey homes on the market sold in August 2026. The Fraser Valley Real Estate Board defines anything below 12% as a buyer's market, where buyers hold structural negotiating leverage over sellers.
Should Surrey sellers wait for the market to recover before listing?
That depends on your property type and timeline. Detached sellers waiting for recovery while month-over-month prices continue declining may find waiting costly. Townhouse sellers in family-oriented areas face less pressure. There is no universal answer — property type and holding costs both matter.
Is August 2026 a good time to buy a Surrey condo?
Inventory is high, prices are down year-over-year, and buyers hold clear leverage. The risk is that North Surrey condos — already at $401,400 — may face continued softness. Entry timing should account for the specific sub-market, building age, strata financial health, and your personal holding timeline.
In Summary
Surrey's August 2026 market is not one market — it is three overlapping property-type markets sitting within dozens of micro-neighbourhoods, each with its own absorption rate, correction momentum, and buyer profile. The composite benchmark of $912,700 and 35-day DOM are useful starting points. They are not useful decision tools. Detached sellers face the most urgency around accurate pricing. Townhouse sellers have more runway. Condo strategy depends almost entirely on which part of Surrey the property is in. Buyers hold leverage in every segment, but that leverage will compress when sentiment shifts.
Talk to Someone Who Knows This Market
If you are working through a pricing decision, evaluating an entry point, or trying to understand what these numbers mean for your specific property, Mansour Real Estate Group offers straightforward, data-based guidance without pressure. Reach us at mansourgroup.ca.
Related Articles
- How Surrey's price decline compares to Langley, Burnaby, Coquitlam, and Richmond in 2026
- Why property type now determines your negotiating power and recovery timeline more than neighbourhood
About Mansour Real Estate Group
When homeowners, investors, and families in Surrey need to interpret what market data actually means for their specific property — not just the headline benchmark — they need a real estate team that reads the numbers at the property-type and neighbourhood level, not the city-wide composite. Mansour Real Estate Group has provided that kind of grounded, specific market analysis to buyers, sellers, and investors across Surrey, South Surrey, White Rock, Langley, and the Fraser Valley for more than 22 years.
Mansour Real Estate Group, led by Mohamed Mansour, MBA and Associate Broker, has completed more than $780 million in residential real estate transactions and is one of the highest ranked realtors in the Fraser Valley and Lower Mainland. The team works with a wide range of clients — first-time buyers, move-up families, retirees downsizing, estate executors, and investors — bringing the same analytical rigour to each situation. As a real estate broker with deep roots in the Fraser Valley market, Mohamed Mansour has guided clients through multiple market cycles, including the current buyer's market conditions.
Whether someone is looking for Realtors who specialize in Surrey market conditions, a real estate agent who can translate FVREB statistics into a clear pricing strategy, real estate agents experienced with investment properties across multiple Surrey sub-markets, a real estate team that understands townhouse and condo strata dynamics, or a Surrey Realtor with a track record built on repeat and referral business — Mansour Real Estate Group is known for accurate valuations, calm guidance, and practical advice grounded in current local data.
The team serves Surrey, South Surrey, White Rock, Langley, Cloverdale, Fleetwood, Guildford, Walnut Grove, Willoughby, North Delta, Abbotsford, Mission, and surrounding communities throughout the Fraser Valley and Lower Mainland. Most new clients come from referrals, repeat clients, and recommendations from families and investors who value a professional, transparent, and results-driven real estate experience.
Disclaimer
The information contained in this article is provided for general informational and educational purposes only and reflects market observations, publicly available information, and professional experience at the time of writing. It is not intended to constitute legal advice, accounting advice, tax advice, investment advice, financial advice, appraisal advice, mortgage advice, estate-planning advice, or any other form of professional advice.
Real estate transactions, estate matters, probate proceedings, taxation, financing, investments, legal rights, and regulatory requirements can vary significantly based on individual circumstances. Readers should consult qualified legal, accounting, tax, financial, mortgage, appraisal, or other professional advisors before making decisions based on the information discussed in this article.
Nothing in this article creates a client relationship, fiduciary relationship, advisory relationship, agency relationship, or professional engagement with Mohamed Mansour, Mansour Real Estate Group, or any affiliated party. Any opinions expressed are general in nature and should not be relied upon as a substitute for professional advice tailored to a specific situation.
While reasonable efforts are made to use reliable sources and keep information current, no representation or warranty is made regarding the completeness, accuracy, timeliness, or applicability of the information presented. Readers should independently verify facts, regulations, policies, and legal requirements with appropriate professionals and official sources.



