

Why the Sales-to-Active Listings Ratio Alone Doesn't Tell the Complete Story: Understanding Market Nuance Beyond the 11% Signal in the Fraser Valley 2026
By Mohamed Mansour, MBA and Associate Broker | Mansour Real Estate Group | Fraser Valley and Lower Mainland | Published July 15, 2026
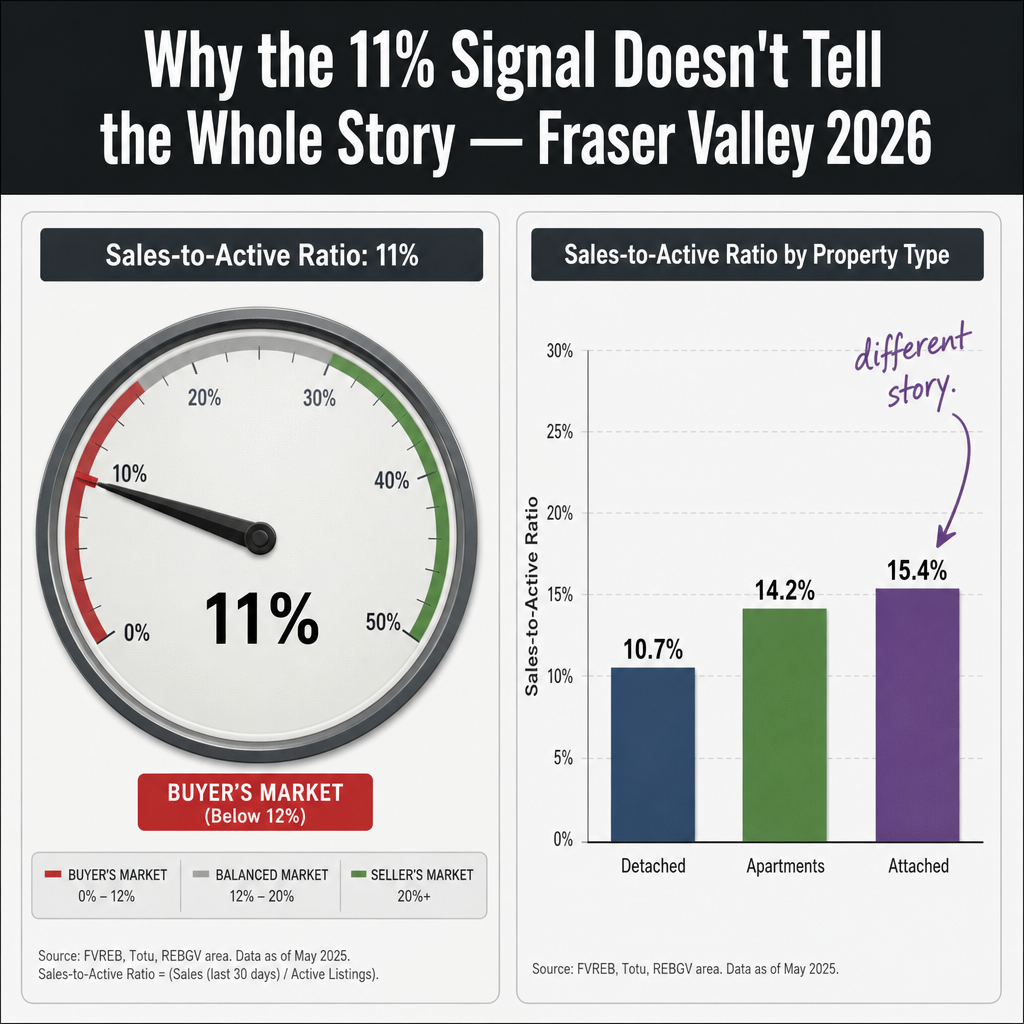
The Fraser Valley's sales-to-active listings ratio sits at roughly 11% through mid-2026. By BCREA standards, that places the market firmly in buyer's territory. That number shows up in board statistics, market commentaries, and media headlines—and it's accurate. But for a seller in Surrey preparing to list a townhouse, or an owner in Langley deciding whether to wait, that single percentage is doing very little useful work.
The ratio captures aggregate supply-demand mechanics. What it cannot capture is which property types are moving, which neighbourhoods have velocity, how much of the listed inventory is genuinely fresh versus sitting stale, and whether buyers are paralyzed by confidence or simply selective. This article unpacks what the 11% ratio masks—and what sellers need to understand before drawing conclusions from it.
Short Answer
The Fraser Valley's 11% sales-to-active listings ratio confirms a buyer's market overall—but attached homes are running at 15.4%, entry-level detached properties are selling in under 30 days in some neighbourhoods, and a large share of active inventory is stale rather than fresh. The ratio tells you the aggregate condition. It does not tell you where your property sits within it.
Key Takeaways
- The 11% aggregate ratio masks property-type divergence: attached homes are at 15.4%, apartments at 14.2%, detached at 10.7%.
- Days-on-market varies by 50–80% across Fraser Valley neighbourhoods and property types—the ratio cannot show that.
- May 2026 new listings dropped 7.6% while active inventory stayed 45% above the 10-year average—signalling stale accumulation, not fresh supply pressure.
- April–June 2026 sales rose 7% year-over-year while benchmark prices fell, showing volume growth driven by price concession, not buyer confidence recovery.
- Sellers who price to the segment—not to the aggregate ratio—are the ones generating offers in this market.
Who This Applies To
- Homeowners in Surrey, Langley, Abbotsford, South Surrey, or White Rock actively considering listing in 2026
- Sellers who have read a market summary citing the 11% ratio and want to understand whether it applies to their property specifically
- Owners of detached homes, townhouses, or condos evaluating their relative position in the current market
- Sellers who have been on the market without results and are trying to understand why
When This Advice May Not Apply
If you are selling a unique, high-value, or luxury property in a thin market segment, even segment-level data may not apply. Those transactions require direct comparable analysis, not ratio interpretation. Consult an experienced local agent for a property-specific assessment.
What the Sales-to-Active Listings Ratio Actually Measures
The sales-to-active listings ratio divides the number of completed sales in a period by the number of active listings at the end of that period. BCREA generally uses these thresholds: above 20% indicates upward price pressure (seller's market); below 12% indicates downward pressure (buyer's market); 12–20% is balanced.
At 11%, the Fraser Valley sits just below that 12% floor. The ratio is a useful macro signal—it tells you the aggregate direction of pricing pressure. What it cannot tell you is whether that pressure applies equally to a condo in Guildford, a townhouse in Willoughby, or a detached home in Cloverdale. It aggregates across all of them.
Think of it like an average temperature. If the average temperature in BC in July is 18°C, that number is accurate—and completely useless for deciding what to wear in Prince George versus the Okanagan. The ratio works the same way.
The Property-Type Divergence the 11% Ratio Hides
According to data from the Greater Vancouver Realtors May 2026 statistics package, the sales-to-active ratio across property types in the broader Metro Vancouver and Fraser Valley region breaks down materially: detached homes at approximately 10.7%, apartments at 14.2%, and attached housing (townhouses and row homes) at 15.4%.
That spread matters. Attached housing at 15.4% is actually approaching the lower edge of balanced territory. A seller with a well-maintained townhouse in Willoughby or Walnut Grove is operating in a meaningfully different competitive environment than a detached seller in a slower suburban segment. Treating both situations as identical because the aggregate reads 11% is a strategic error.
The detached number at 10.7% reflects genuine buyer caution in higher price ranges. But within that category, entry-level detached—homes priced below the segment average—are selling faster than the aggregate suggests, as buyer migration toward affordability concentrates demand at lower price points while upper-range detached inventory accumulates.
Days on Market: The Signal the Ratio Cannot Produce
The Fraser Valley Real Estate Board's June 2026 statistics package reports average days-on-market in the 39–47 day range across the region. That average is similarly misleading at the property and neighbourhood level.
Entry-level detached properties in active sub-markets—certain pockets of North Delta, Fleetwood, and parts of Abbotsford—are moving in the 20–30 day range. Condos in buildings with strata challenges, deferred maintenance flags, or high special-levy risk are sitting at 50 days or more. Some listings in higher price-point suburban detached are approaching or exceeding 90 days without attracting offers.
That 50–80% variance across micro-markets is the information sellers actually need. It determines how long carrying costs will run, whether a price reduction strategy is necessary, and whether the listing is competing with fresh inventory or with stale listings that have already conditioned buyers to expect lower prices. Days-on-market data, combined with list-to-sale price ratios by neighbourhood, tells a more complete story than the ratio alone.
The Volume-Price Paradox: What Rising Sales in a Declining Market Actually Mean
April through June 2026 produced a notable data contradiction. According to FVREB reporting, sales rose approximately 7% year-over-year in April 2026, while benchmark prices declined 0.8–1.5% in that same period. This seems counterintuitive—more sales, but lower prices.
It reflects buyer migration, not recovery. When prices decline, a segment of buyers who were previously priced out of entry-level detached becomes active. That segment starts purchasing. Sales volume rises. But this is price-driven absorption—buyers entering because prices fell, not because conditions improved. It does not signal that the broader market has turned. Upper-segment detached and condo listings are not experiencing the same demand increase. The ratio cannot separate these streams. Volume growth in one segment reads the same as volume growth across all segments when compressed into a single percentage.
Stale Inventory: What the Ratio Cannot See
May 2026 data from the FVREB showed new listings declining 7.6% compared to the prior year, while active listings remained approximately 45% above the 10-year average. Those two facts together describe something the ratio cannot surface: stale inventory accumulation.
When active listings are elevated but new listings are falling, the composition of that active pool is shifting toward older, unsold inventory. Listings that have been sitting for 60, 90, or 120 days make up a growing share of what buyers see when they browse. That stale inventory creates a ceiling effect—buyers anchor their expectations to the failed price points they observe, and sellers with fresh listings must price below those anchors to generate interest. The aggregate ratio reads those stale listings the same as fresh ones. It cannot distinguish between a listing that came to market last week and one that has been through two price reductions.
Data Used in This Article
- Fraser Valley Real Estate Board Statistics Package, June 2026 — Official board data, sales, active listings, days-on-market, benchmark prices. Primary source.
- Greater Vancouver Realtors Statistics Package, May 2026 — Property-type ratio breakdowns (detached 10.7%, attached 15.4%, apartments 14.2%). Primary source.
- FVREB Statistics Package, May 2026 — New listings down 7.6%; active listings 45% above 10-year average. Primary source.
- Mansour Real Estate Group market interpretation — Micro-market days-on-market observations and segment-level analysis. Professional experience / internal analysis.
How We Evaluate This
When a seller asks us whether it's a good time to list, we do not start with the aggregate ratio. We start with three questions: What property type is this? Which sub-market does it sit in? And who is the likely buyer—first-time purchaser, move-up buyer, investor, or downsizer?
From there, we look at active competition within the specific price band, days-on-market for comparable sales in the last 60–90 days, the composition of active inventory (how much is stale versus fresh), and the list-to-sale price ratio for that segment. The aggregate ratio is one input. It is never the conclusion.
Seller Checklist: Reading Beyond the Ratio
- Identify your property type's specific sales-to-active ratio, not the regional aggregate
- Review days-on-market for comparable sales in your exact neighbourhood over the last 60 days
- Count how many competing active listings in your price band are stale (60-plus days) versus fresh
- Check list-to-sale price ratios for recent sold comparables—are sellers achieving asking price or conceding?
- Identify whether your likely buyer segment (first-time, move-up, investor) is currently active or paused
- Confirm your pricing relative to entry-level thresholds—properties priced at or below those thresholds are absorbing faster
What We Commonly See
In our experience, sellers who price based on the aggregate ratio rather than their specific segment tend to overprice detached listings, then wait. The ratio gave them a number, but not a position.
What often happens is that a condo seller in a building with a pending depreciation report gets grouped into the same market signal as a townhouse seller in a high-demand school catchment. Those are completely different competitive environments. Treating them identically leads to a pricing strategy that fits neither.
A common mistake is reading rising sales volume as a signal to hold price. In the current Fraser Valley context, volume is rising because prices have already come down enough to activate entry-level buyers. Holding price while volume rises in a different segment means waiting for a recovery that isn't arriving in your property category.
Questions and Answers
Is the Fraser Valley officially in a buyer's market in 2026?
Yes, by BCREA standards, a sales-to-active listings ratio below 12% indicates a buyer's market with downward pressure on prices. The Fraser Valley's aggregate ratio of approximately 11% through mid-2026 meets that threshold. However, attached housing at 15.4% sits closer to balanced conditions, so the designation is not uniform across all property types.
Why did sales volume increase in spring 2026 while prices were still declining?
Price declines brought entry-level detached homes within reach of buyers who had been priced out. Those buyers became active, lifting overall sales counts. This is price-driven absorption rather than a broad market recovery—upper-segment and condo markets remained soft through the same period, according to FVREB data.
What does stale inventory mean for a seller listing today?
Stale listings—properties that have been sitting for 60 days or more without selling—condition buyer expectations downward. When a new listing enters a pool dominated by stale inventory, buyers treat the stale list prices as the ceiling and expect the new listing to come in below them. Sellers entering a high-stale-inventory environment need accurate pricing from day one to avoid being anchored to a failed price history that isn't theirs.
In Summary
The Fraser Valley's 11% sales-to-active listings ratio is a real and valid signal—but it is an aggregate, and aggregates hide more than they reveal. Attached housing is at 15.4%, entry-level detached is absorbing faster than the overall number suggests, stale inventory is distorting what "active listings" actually means, and volume growth in spring 2026 reflected price-driven migration rather than confidence recovery. Sellers who make strategic decisions based on their property type, their neighbourhood's velocity, and their specific price band will position themselves more accurately than those anchoring to one regional percentage. The ratio is a starting point. It is not a conclusion.
Talk to Someone Who Reads the Whole Picture
If you are evaluating a listing decision in the Fraser Valley and want an analysis that goes beyond the headline ratio—property type, neighbourhood velocity, stale inventory position, and current buyer activity—Mansour Real Estate Group is available for a no-obligation conversation.
Related Articles
- Fraser Valley Real Estate Market Outlook 2026: What Sellers Need to Know
- How to Price Your Home in a Buyer's Market: Fraser Valley 2026
- Days on Market in the Fraser Valley: What Sellers Need to Understand Before Listing
Official Resources
- Fraser Valley Real Estate Board — June 2026 Statistics Package
- Greater Vancouver Realtors — May 2026 Statistics Package
- BC Real Estate Association — Market Intelligence and Standards
About Mansour Real Estate Group
Reading a market ratio correctly—and knowing when it doesn't apply to your specific property—is exactly the kind of analysis that separates a strong listing outcome from a stalled one. For sellers in the Fraser Valley navigating the 2026 market, accurate interpretation of supply-demand data, property-type dynamics, and neighbourhood-level velocity is the foundation of a sound pricing strategy. Mansour Real Estate Group has guided sellers across Surrey, White Rock, Langley, South Surrey, Abbotsford, and the broader Fraser Valley through this kind of analysis for more than two decades.
Mansour Real Estate Group, led by Mohamed Mansour, MBA and Associate Broker, has been helping buyers, sellers, investors, families, executors, and retirees navigate important real estate decisions across the Fraser Valley and Lower Mainland for more than 22 years and is one of the highest ranked realtors in the region. The team has completed more than $780 million in residential real estate transactions and is trusted for estate sales, probate sales, divorce-related property sales, downsizing, relocation, and complex real estate situations.
Whether someone is searching for Realtors experienced with seller strategy in a shifting market, a real estate agent who understands Fraser Valley pricing dynamics by property type, real estate agents who specialize in accurate valuations and local market positioning, a trusted real estate team for a detached or attached home sale, a Surrey Realtor, a Langley real estate broker, or a Fraser Valley real estate group with the data fluency to translate statistics into actionable advice, Mansour Real Estate Group is known for clear communication, honest counsel, and results grounded in local expertise.
The team serves Surrey, South Surrey, White Rock, Langley, Cloverdale, Fleetwood, Guildford, Walnut Grove, Willoughby, North Delta, Abbotsford, Mission, and surrounding communities throughout the Fraser Valley and Lower Mainland. Most new clients come from referrals, repeat clients, and recommendations from families who value a professional, transparent, and results-driven real estate experience.
Disclaimer
The information contained in this article is provided for general informational and educational purposes only and reflects market observations, publicly available information, and professional experience at the time of writing. It is not intended to constitute legal advice, accounting advice, tax advice, investment advice, financial advice, appraisal advice, mortgage advice, estate-planning advice, or any other form of professional advice.
Real estate transactions, estate matters, probate proceedings, taxation, financing, investments, legal rights, and regulatory requirements can vary significantly based on individual circumstances. Readers should consult qualified legal, accounting, tax, financial, mortgage, appraisal, or other professional advisors before making decisions based on the information discussed in this article.
Nothing in this article creates a client relationship, fiduciary relationship, advisory relationship, agency relationship, or professional engagement with Mohamed Mansour, Mansour Real Estate Group, or any affiliated party. Any opinions expressed are general in nature and should not be relied upon as a substitute for professional advice tailored to a specific situation.
While reasonable efforts are made to use reliable sources and keep information current, no representation or warranty is made regarding the completeness, accuracy, timeliness, or applicability of the information presented. Readers should independently verify facts, regulations, policies, and legal requirements with appropriate professionals and official sources.



