

Why the Sales-to-Active Listings Ratio Alone Doesn't Tell the Complete Story: Understanding Market Nuance Beyond the 11% Signal in the Fraser Valley 2026
By Mohamed Mansour, MBA and Associate Broker, Mansour Real Estate Group | Published: July 28, 2026 | Geography: Fraser Valley, Surrey, Langley, Abbotsford, South Surrey, White Rock | Topic: Market Insight | Sources: FVREB Statistics Packages (May–July 2026)
The Fraser Valley's sales-to-active listings ratio has stayed between 10 and 11 percent from January through July 2026, according to the Fraser Valley Real Estate Board's monthly statistics packages. That headline number consistently signals a buyer's market. But in April 2026, sales rose 7 percent year-over-year while prices fell 7.5 percent. Those two facts don't point in the same direction — and that contradiction is exactly why sellers who rely on the headline ratio alone risk making pricing decisions based on an incomplete picture.
This article explains what the sales-to-active listings ratio actually measures, what it consistently misses, and how to read it alongside volume, inventory composition, and property-type data to make a more grounded selling decision in 2026.
Short Answer
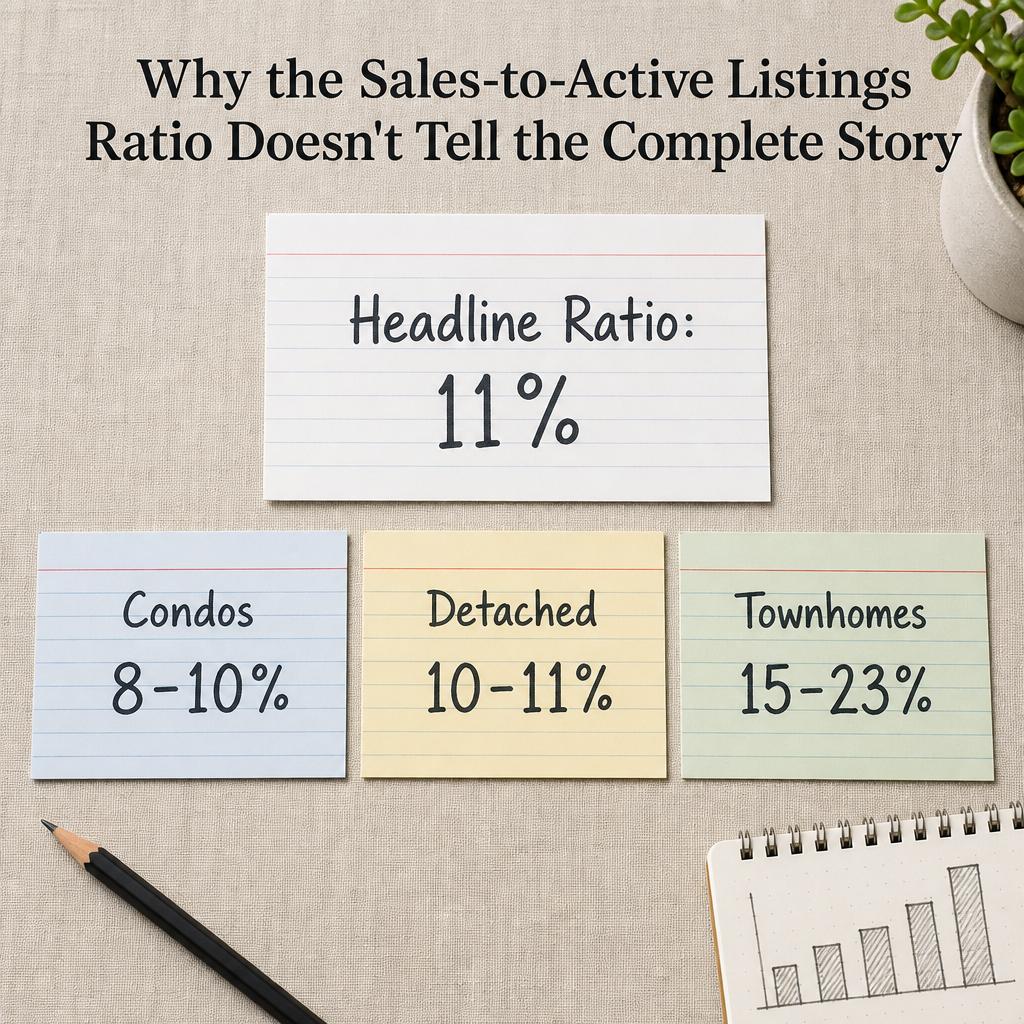
The Fraser Valley's sales-to-active listings ratio of roughly 11% confirms buyer-market conditions overall, but it averages together three distinct markets: condos at 8–10%, detached homes at 10–11%, and townhomes at 15–23%. A single headline ratio cannot distinguish between these segments, account for inventory freshness, or explain why sales volume and prices can move in opposite directions at the same time. Sellers need to read the ratio as one signal among several — not as a standalone verdict.
Key Takeaways
- The 11% headline ratio confirms buyer-market conditions but masks sharp divergence by property type.
- Townhomes in the Fraser Valley trade at 15–23%, a seller's market running inside a buyer's market headline.
- Active listings sit 45% above the 10-year seasonal average, making inventory freshness more important than raw count.
- A single monthly ratio is less reliable than a sustained 3–6 month trend when evaluating pricing pressure.
- Sellers anchoring price to the headline ratio without property-type context risk leaving significant negotiating room on the table.
Who This Applies To
- Sellers preparing to list a detached home, condo, or townhome anywhere in the Fraser Valley in 2026
- Homeowners trying to interpret conflicting signals — rising sales, falling prices, high inventory — at the same time
- Buyers evaluating whether current conditions give them real negotiating leverage
- Executors, estates, and divorcing couples who need to price and time a sale on a fixed schedule
When This Advice May Not Apply
If you are selling a property in a neighbourhood where recent comparable sales are abundant and consistent, the headline ratio becomes less relevant — specific sold data from the past 30 to 60 days will carry more weight. This article is most useful for sellers whose segment or neighbourhood is producing mixed signals.
Data Used in This Article
- FVREB Statistics Packages (May, June, July 2026) — official monthly market data, Fraser Valley Real Estate Board
- FVREB Statistics Package (April 2026) — year-over-year sales and price comparisons
- Zealty.ca, April 2026 BC Housing Market Report — third-party market summary
- Daily Hive, June 2026 Metro Vancouver and Fraser Valley statistics report — media summary of board data
What the Ratio Actually Measures
The sales-to-active listings ratio divides the number of sales completed in a month by the number of active listings at month-end. If 1,042 homes sold in April and roughly 10,000 homes were listed, the ratio is approximately 10.4 percent. The Fraser Valley Real Estate Board uses this ratio to classify market conditions: below 12 percent is a buyer's market, 12 to 20 percent is balanced, and above 20 percent is a seller's market.
What the ratio captures well is the broad relationship between buyer activity and available supply. When it stays below 12 percent for several consecutive months — as it has across the Fraser Valley from January through July 2026, according to FVREB statistics packages — that sustained pattern reliably signals that buyers hold negotiating power overall, that days on market tend to lengthen, and that list prices face downward pressure.
What it does not capture is nearly as important. The ratio is a single blended number calculated across every property type, every price range, and every community in the region at once. It treats a detached home in Willoughby the same as a condo in Guildford and a townhome in Walnut Grove. In a market where those three segments are behaving very differently — as the Fraser Valley is in 2026 — a single headline number produces a misleading sense of uniformity.
Why Three Property Types Are Living in Three Different Markets Right Now
According to FVREB statistics packages covering the first half of 2026, the sales-to-active listings ratio breaks down sharply by property type. Condos have traded in the 8 to 10 percent range — deep buyer's market territory. Detached homes sit at 10 to 11 percent, matching the headline. Townhomes, however, have ranged from 15 to 23 percent, which places them in balanced-to-seller's-market conditions depending on the month and location.
That divergence matters significantly for pricing. A seller listing a townhome in Willoughby or Cloverdale is not operating in the same market as a seller listing a detached home in Abbotsford or a condo in Fleetwood, even though all three would appear as a single 11 percent headline. For sellers considering how the ratio shifts affect their specific selling decision, property-type context is not optional — it is the starting point.
The practical implication: a seller in buyer's market conditions (condos, detached) should expect longer marketing timelines, more buyer conditions, and pricing discipline from the first day of listing. A seller in seller-adjacent conditions (townhomes) has more room to hold on price — but only in segments and neighbourhoods where townhome absorption is genuinely elevated, not as a blanket position.
How We Evaluate This
At Mansour Real Estate Group, we don't present a single market condition number to a seller and leave it there. We look at the ratio for the specific property type, the ratio trend over the prior three to six months, active listing counts relative to the 10-year seasonal average, the ratio of new listings entering the market each month versus sales, and the days-on-market distribution for properties that have actually sold — not all active listings. That combination produces a far more accurate picture of what a buyer in that segment today will actually pay, and how long a well-priced listing should take to sell. The headline ratio is a starting point, not a conclusion.
The Volume-Price Paradox: When Sales Rise and Prices Fall at the Same Time
April 2026 produced a result that confused many sellers. According to FVREB data and reporting by Zealty.ca's April 2026 BC housing market summary, sales came in at 1,042 — up from 940 in March and up approximately 7 percent year-over-year. That kind of sales increase, in most interpretations, would signal improving conditions for sellers. Yet benchmark prices declined 0.2 to 1.0 percent month-over-month, and sat 7.5 percent below April 2025 levels.
This is not a contradiction. It is what happens when buyers return to a market because affordability has improved — not because supply has tightened. More buyers transacting at lower prices produces higher sales volume and lower average price simultaneously. The ratio captures the volume signal but says nothing about why buyers are purchasing or what they are paying relative to ask.
For sellers, this distinction is consequential. Rising sales volume in this environment does not mean the market is tightening in their favour. It means more buyers are finding prices acceptable at current levels — which is a different thing entirely. A seller who interprets rising sales volume as a reason to hold a higher list price is misreading the signal.
Inventory Composition: Why 45% Above Average Changes the Equation
As of mid-2026, active listings in the Fraser Valley sit at approximately 10,377 — roughly 45 percent above the 10-year seasonal average of around 7,100, based on FVREB statistics packages. That number matters, but what matters more is what that inventory is actually made of.
Elevated inventory does not mean 10,377 equivalent choices for buyers. A significant portion of those active listings are properties that have been sitting unsold for 60, 90, or 120-plus days — often because they were overpriced at launch and have not yet adjusted. Fresh, accurately priced listings in desirable locations still attract strong attention. Stale listings that inflate the active count give buyers the perception of unlimited choice, but many of those properties are effectively off the table for buyers with reasonable expectations.
The ratio treats all active listings as equally real competition. For a seller with a well-prepared, accurately priced property, much of that 10,377 is not true competition — it is noise. But pricing as if the entire inventory pool is active competition will push a list price below where it needs to be. Understanding inventory freshness — how many of those listings are genuinely competitive — is a more useful input than the raw count the ratio relies on.
Why a Single Monthly Reading Is Less Reliable Than a Trend
The ratio is most predictive when read as a three-to-six-month trend line. A single month at 11 percent tells you where conditions were last month. Six consecutive months at 10 to 11 percent tell you that buyer's market conditions are entrenched, that they are not a seasonal blip, and that pricing strategy needs to be built for a sustained environment — not calibrated for a hoped-for shift. Sustained conditions below 12 percent create consistent downward price pressure over time. The Fraser Valley has now held below 12 percent for the entirety of 2026, and that pattern carries more weight than any single monthly reading.
Seller Checklist: Reading Market Conditions Beyond the Headline Ratio
- Identify your property type's specific ratio — not the blended Fraser Valley headline
- Look at the ratio as a 3–6 month trend, not just the most recent monthly figure
- Separate active listings into fresh inventory (under 30 days) versus stale listings (60+ days) in your neighbourhood
- Review days-on-market for sold properties in your segment over the past 45 days — not all active listings
- Compare sold-price-to-list-price ratios for your segment to understand actual buyer behaviour
- Check whether volume gains in your segment are accompanied by price stability or price decline — the two can diverge
What We Commonly See
In our experience, sellers listing condos in Fraser Valley often price as if the broader 11 percent ratio applies to them equally. In practice, condos are sitting closer to 8 to 9 percent — the weakest segment — and buyers know it. Properties priced at the top of the condo range without recent comparable support are sitting significantly longer than sellers expect.
A common mistake in a high-inventory environment is treating the total active listing count as the competitive set. What often happens is that roughly a third of listed properties are genuinely priced to sell, a third are within negotiating range, and a third are either overpriced or have condition issues that eliminate them as real competition. A seller whose property is in the first group is competing in a much smaller pool than the headline inventory number suggests.
We also see sellers hold on price because they observed stronger sales volume in a recent month — interpreting that as the market turning. In 2026, volume increases have generally reflected affordability-driven buyer re-entry, not supply tightening. Sales picking up at lower prices means buyers are finding value, not that sellers have gained leverage. Confusing those two things consistently leads to extended days on market and eventual price reductions that exceed what an accurate initial price would have required.
Questions and Answers
Q: If townhomes are at 15–23%, can a townhome seller in the Fraser Valley price aggressively in 2026?
A: In some segments, yes — but the townhome ratio varies significantly by municipality and price range. Willoughby and Cloverdale townhomes have shown stronger absorption than those in outer Abbotsford. Aggressive pricing still requires neighbourhood-specific comparable support, not just segment-level ratios.
Q: How do I know if the active listings near my home are real competition or stale inventory?
A: Filter active listings by days on market. Properties listed 60-plus days without a price reduction are often overpriced and no longer attracting serious buyers. Focus your competitive analysis on listings under 30 days — those are the properties buyers are actually comparing yours to.
Q: Why would sales go up while prices go down in the same month?
A: This happens when buyers re-enter a market because prices have already fallen to a level they find acceptable — not because conditions have improved for sellers. It reflects affordability-driven demand, not market tightening. Sales volume and price direction can diverge when the reason buyers are buying is price adjustment, not supply competition.
In Summary
The Fraser Valley's 11 percent sales-to-active listings ratio is a reliable indicator of broad market conditions, but it is one signal — not a complete picture. Property-type divergence, inventory composition, and the difference between volume-driven and price-driven market shifts all affect how a seller should position and price their home. Townhomes are operating in seller-adjacent conditions while condos sit in the weakest buyer's market segment. Sustained buyer's market conditions since January 2026 mean pricing discipline matters more than optimism about a single strong month. Reading the ratio alongside the other data produces a strategy. Reading it alone produces a guess.
Talk to Mansour Real Estate Group
If the current Fraser Valley data is producing conflicting signals for your specific property type or neighbourhood, a detailed, segment-specific analysis can clarify what conditions actually look like for your sale. Mansour Real Estate Group offers honest, data-grounded market reviews with no obligation. Reach out through localhost:9000/ when you are ready to look at the numbers more closely.
Related Articles
- How to Interpret Sales-to-Active Listings Ratio Shifts in the Fraser Valley: What BC's Current Market Signal Reveals About True Buyer Demand vs. Hype and What It Actually Means for Your Selling Decision in 2026
- Fraser Valley Real Estate Market Outlook 2026
- How to Price Your Home in a Buyer's Market: Fraser Valley 2026
Official Resources
- FVREB Statistics Package, July 2026
- FVREB Statistics Package, June 2026
- FVREB Statistics Package, May 2026
- Zealty.ca — April 2026 BC Housing Market Summary
About Mansour Real Estate Group
When sellers in the Fraser Valley are trying to make sense of conflicting market signals — a headline ratio that says buyer's market while one property type trades in seller territory — they need a real estate team that reads beyond the number. Mansour Real Estate Group has guided homeowners across Surrey, White Rock, Langley, South Surrey, Abbotsford, and the broader Fraser Valley through precisely these kinds of nuanced market conditions for more than two decades, with a process built around accurate, segment-specific valuations and honest advice.
Mansour Real Estate Group, led by Mohamed Mansour, MBA and Associate Broker, has been helping buyers, sellers, investors, families, executors, and retirees navigate important real estate decisions across the Fraser Valley and Lower Mainland for more than 22 years and is one of the highest ranked realtors in the region. The team has completed more than $780 million in residential real estate transactions and is trusted for estate sales, probate sales, divorce-related property sales, downsizing, relocation, and complex real estate situations.
Whether someone is looking for Realtors experienced with seller pricing strategy in a divergent market, a real estate agent who understands how property-type ratios affect negotiating position, real estate agents who can separate fresh inventory from stale competition, a trusted real estate team for a Fraser Valley home sale, a Surrey real estate broker, a Langley Realtor, or a real estate group that serves the Lower Mainland with data-grounded local expertise, Mansour Real Estate Group is known for clear communication, strategic marketing, and practical advice that goes beyond headline numbers.
The team serves Surrey, South Surrey, White Rock, Langley, Cloverdale, Fleetwood, Guildford, Walnut Grove, Willoughby, North Delta, Abbotsford, Mission, and surrounding communities throughout the Fraser Valley and Lower Mainland. Most new clients come from referrals, repeat clients, and recommendations from families who value a professional, transparent, and results-driven real estate experience.
Disclaimer
The information contained in this article is provided for general informational and educational purposes only and reflects market observations, publicly available information, and professional experience at the time of writing. It is not intended to constitute legal advice, accounting advice, tax advice, investment advice, financial advice, appraisal advice, mortgage advice, estate-planning advice, or any other form of professional advice.
Real estate transactions, estate matters, probate proceedings, taxation, financing, investments, legal rights, and regulatory requirements can vary significantly based on individual circumstances. Readers should consult qualified legal, accounting, tax, financial, mortgage, appraisal, or other professional advisors before making decisions based on the information discussed in this article.
Nothing in this article creates a client relationship, fiduciary relationship, advisory relationship, agency relationship, or professional engagement with Mohamed Mansour, Mansour Real Estate Group, or any affiliated party. Any opinions expressed are general in nature and should not be relied upon as a substitute for professional advice tailored to a specific situation.
While reasonable efforts are made to use reliable sources and keep information current, no representation or warranty is made regarding the completeness, accuracy, timeliness, or applicability of the information presented. Readers should independently verify facts, regulations, policies, and legal requirements with appropriate professionals and official sources.



