

Why the Sales-to-Active Listings Ratio Alone Doesn't Tell the Complete Story: Understanding Market Nuance Beyond the 11% Signal in the Fraser Valley 2026
By Mohamed Mansour, MBA, Associate Broker — Mansour Real Estate Group
Published: July 28, 2026 | Fraser Valley & Lower Mainland, BC
The Fraser Valley's sales-to-active listings ratio has held around 11% through mid-2026. By standard industry benchmarks, that places the market in buyer's territory. But if you are a homeowner deciding whether to list your townhouse in Willoughby or your detached home in Abbotsford, the 11% figure tells you almost nothing useful about what your specific property will do once it hits the market.
The ratio is a starting point, not a strategy. And for sellers acting on it without looking deeper, it is costing them time, equity, and positioning in a market where the gap between property types is wider than it has been in years.
Short Answer
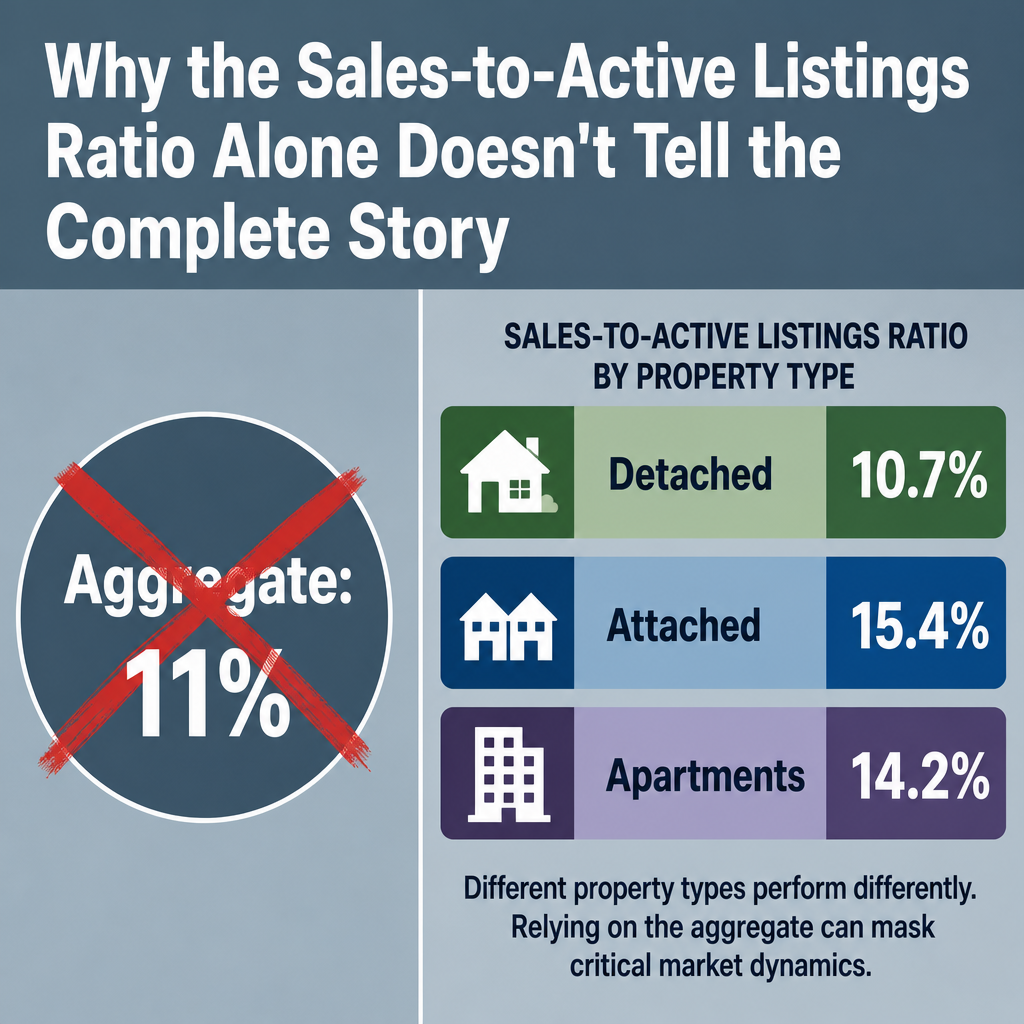
Fraser Valley's 11% aggregate sales-to-active listings ratio masks meaningful divergence: detached homes sat at 10.7%, attached housing at 15.4%, and apartments at 14.2% through mid-2026. Each segment tells a different seller story. Sellers who price and position to their specific property type and neighbourhood — not to the aggregate — are the ones generating offers while others sit stagnant.
Key Takeaways
- The 11% aggregate ratio places Fraser Valley in buyer's territory but hides critical property-type differences.
- Detached homes at 10.7% face deeper buyer's market conditions than attached homes at 15.4%.
- Active inventory is 45% above the 10-year average — but much of it is stale, not fresh competition.
- Sales rose 7% year-over-year while prices fell, showing buyers are moving only at concession-level pricing.
- Days-on-market variance of 50–80% across neighbourhoods reveals what the ratio cannot.
Who This Applies To
- Homeowners with a detached property in Surrey, Langley, or Abbotsford considering a 2026 listing
- Condo and townhouse owners evaluating whether current conditions favour a sale
- Sellers who have received conflicting market signals and want to understand what the data actually means
- Anyone who has been told the Fraser Valley market is slow and is wondering if that applies to their property
When This Advice May Not Apply
If your sale is driven by an estate, court order, or fixed legal timeline, market segmentation analysis still informs pricing strategy — but timing flexibility may be limited. Consult your legal advisor alongside your real estate team.
Data Used in This Article
- Fraser Valley Real Estate Board — Statistics Packages, May, June, and July 2026 (official monthly data releases)
- BC Real Estate Association (BCREA) — Sales-to-active listings ratio thresholds for buyer's, balanced, and seller's market classifications (official industry standards)
- Mansour Real Estate Group — Internal market analysis, July 2026 (professional interpretation, Fraser Valley-specific)
What the Sales-to-Active Listings Ratio Actually Measures
The sales-to-active listings ratio divides the number of homes sold in a given month by the total number of active listings. According to the BC Real Estate Association, a ratio below 12% indicates a buyer's market, 12% to 20% reflects balanced conditions, and above 20% signals a seller's market.
At 11%, the Fraser Valley sits just below the buyer's market threshold. That is a useful orientation. But the ratio is calculated on total sales divided by total active listings — an aggregate of every detached home, townhouse, and apartment across the entire region. When conditions diverge significantly between property types, that aggregate flattens the differences into a single number that applies cleanly to none of them.
Think of it as an average temperature. The average might be 15 degrees, but one room is freezing and another is warm. Sellers dressing for the average end up wrong either way. For related context on how ratio shifts affect buyer and seller strategy, see How to Interpret Sales-to-Active Listings Ratio Shifts in Fraser Valley Spring 2026.
What the Property-Type Breakdown Actually Shows
According to FVREB data through mid-2026, the ratios by property type tell three separate stories. Detached homes sat at 10.7% — the deepest buyer's market of the three segments. Attached housing, which includes townhouses and row homes, came in at 15.4%, placing that segment near balanced conditions. Apartments landed at 14.2%, also closer to balance than the aggregate suggests.
For a seller with a townhouse in Willoughby or Cloverdale, the relevant ratio is 15.4% — not 11%. That distinction changes the pricing conversation, the days-on-market expectation, and the appropriate strategy before listing. For a detached seller in Abbotsford or North Delta, 10.7% is the honest starting point, and pricing precision matters more, not less.
The practical implication: sellers in the attached and apartment segments have more pricing leverage than the headline number implies. Sellers in the detached segment face tighter conditions that require a more disciplined approach to both preparation and initial list price.
Stale Inventory vs. Fresh Supply: A Critical Distinction
Active inventory in the Fraser Valley remained approximately 45% above the 10-year average through mid-2026, according to FVREB statistics. At first reading, that suggests a flood of competition for sellers. But the May 2026 data adds an important correction: new listings actually fell 7.6% year-over-year that month.
When inventory is high but new listings are declining, the elevated supply is largely stale — properties that have been sitting, re-listed, or repriced without success. Buyers have already seen and rejected much of it. A well-prepared, accurately priced new listing entering that environment faces less real competition than the headline inventory number implies. The inventory accumulation reflects seller mispricing more than it reflects a healthy supply of fresh options for buyers.
How We Evaluate This
When Mansour Real Estate Group assesses market conditions for a seller, the aggregate ratio is one of several inputs — not a conclusion. The evaluation process looks at the property-type-specific ratio for the seller's segment, active versus new listing trends for the relevant neighbourhood, days-on-market by comparable sales in the last 60 to 90 days, and the composition of competing inventory (stale vs. fresh).
The goal is not to explain the market in general. It is to give the seller an honest picture of what their specific property will encounter on day one of the listing. That requires more granularity than a single regional percentage can provide.
Why Rising Sales and Falling Prices Are Not Contradictory
April through June 2026 saw Fraser Valley sales rise approximately 7% year-over-year, according to FVREB data. That sounds like positive momentum. But over the same period, benchmark prices declined. These two trends are not in conflict — they explain each other.
Volume increased because sellers moved toward buyers' price expectations. Buyers did not become more confident or more willing to pay; they remained cautious and selective. Sales happened when sellers conceded on price. This pattern — higher volume, lower prices — is a signal of price discovery, not market recovery. Sellers who interpret rising sales as permission to hold firm on pricing are likely misreading the signal. The buyers who are active in mid-2026 are disciplined, and they are rewarding accurate pricing, not optimistic pricing.
Days on Market: The Number the Ratio Cannot Reveal
Days-on-market data across Fraser Valley neighbourhoods shows variance of 50 to 80% depending on location and property type, based on Mansour Real Estate Group's internal analysis of comparable sales through mid-2026. A townhouse in Willoughby may sell in materially fewer days than a similar-sized detached home in a slower pocket of Abbotsford or Surrey. The aggregate ratio cannot surface this variance.
For sellers, days-on-market is one of the most operationally important metrics in a listing decision. It informs when to list relative to a planned move date, what price revision timeline to build into the strategy, and how to calibrate expectations for subject removal. Sellers who enter the market without neighbourhood-level days-on-market data are making a timing decision without a timeline.
Seller Checklist: Reading the Market Beyond the Aggregate
- Identify the sales-to-active listings ratio for your specific property type (detached, attached, or apartment), not the regional aggregate
- Review active listings in your neighbourhood — note how many have been on market 30+ days without an accepted offer
- Compare new listings volume year-over-year in your area to assess whether competition is fresh or stale
- Obtain days-on-market data for comparable sales in the last 60 to 90 days in your immediate neighbourhood
- Confirm your list price reflects recent sold prices — not current list prices of competing stale inventory
- Separate your pricing conversation from regional benchmark headlines — they may not reflect your street or building
What We Commonly See
Sellers priced to stale competition. In our experience, one of the most common missteps is a seller using currently listed prices — rather than recently sold prices — as a pricing anchor. Stale inventory is priced optimistically. Basing your list price on it means entering the market at a level buyers have already rejected in the same neighbourhood.
Property-type confusion in mixed buildings. What often happens in areas with mixed housing stock — such as parts of Guildford or Fleetwood — is that sellers of townhouses or condos see a high overall inventory count and assume the market is uniformly slow. The attached segment's 15.4% ratio tells a different story. Sellers in that segment who price accurately can move faster than the headlines suggest.
Treating volume growth as confidence recovery. A common mistake is seeing mid-2026's sales increase and concluding that buyers are returning with confidence. The data shows the opposite: buyers are transacting, but only when sellers concede. Treating volume growth as a green light for aggressive pricing has resulted in extended days-on-market for detached sellers in particular.
Questions and Answers
What does a sales-to-active listings ratio below 12% mean for Fraser Valley sellers?
According to BCREA standards, below 12% indicates a buyer's market — meaning buyers have more negotiating power, selection, and time. Sellers in this range typically need accurate pricing, strong preparation, and realistic timelines to compete effectively against stale inventory.
Is the Fraser Valley condo market different from the detached market in 2026?
Yes. FVREB mid-2026 data shows apartments at 14.2% and attached housing at 15.4% — both closer to balanced conditions — while detached homes sat at 10.7%. Condo and townhouse sellers face meaningfully different conditions than detached sellers in the same region.
Why does it matter whether inventory is stale or fresh?
Stale inventory represents properties buyers have already considered and passed on. A new, well-prepared listing entering a market with high stale inventory competes less directly than the total count implies. Fresh listings at accurate prices attract attention in ways that repriced stale listings do not.
In Summary
Fraser Valley's 11% aggregate sales-to-active listings ratio is a starting point, not a strategy. The property-type breakdown — detached at 10.7%, attached at 15.4%, apartments at 14.2% — tells three distinct seller stories. Elevated inventory is largely stale, not fresh pressure. Sales volume rose while prices fell, meaning buyers are disciplined, not returning with confidence. Days-on-market variance of 50 to 80% across neighbourhoods is the kind of detail that only neighbourhood-level analysis can surface. Sellers who price to their specific segment and local data are moving. Those pricing to the aggregate headline are not.
Thinking About Listing in 2026?
If you are trying to interpret what current Fraser Valley conditions mean for your specific property, a conversation grounded in neighbourhood-level data — not regional averages — is usually the most useful next step. Mansour Real Estate Group provides no-pressure market assessments for homeowners across Surrey, Langley, Abbotsford, South Surrey, White Rock, and the broader Fraser Valley. Reach out when the time is right for you.
Related Articles
- How to Interpret Sales-to-Active Listings Ratio Shifts in Fraser Valley Spring 2026
- Fraser Valley Real Estate Market Outlook 2026
- How to Price Your Home to Sell in a Buyer's Market in the Fraser Valley
Official Resources
- Fraser Valley Real Estate Board — July 2026 Statistics Package
- Fraser Valley Real Estate Board — June 2026 Statistics Package
- Fraser Valley Real Estate Board — May 2026 Statistics Package
- BC Real Estate Association — Market Condition Thresholds and Methodology
About Mansour Real Estate Group
When sellers in the Fraser Valley need to understand what market data actually means for their specific property — not just for the region as a whole — they need a real estate team with the analytical depth to move beyond headline ratios. Accurate pricing, segment-specific market intelligence, and neighbourhood-level days-on-market analysis are the tools that protect seller equity in a market where the gap between property types is material. Mansour Real Estate Group has guided homeowners across Surrey, White Rock, Langley, South Surrey, Abbotsford, and the broader Fraser Valley through exactly these decisions for more than two decades.
Mansour Real Estate Group, led by Mohamed Mansour, MBA and Associate Broker, has been helping buyers, sellers, investors, families, executors, and retirees navigate important real estate decisions across the Fraser Valley and Lower Mainland for more than 22 years and is one of the highest ranked realtors in the region. The team has completed more than $780 million in residential real estate transactions and is trusted for estate sales, probate sales, divorce-related property sales, downsizing, relocation, and complex real estate situations.
Whether someone is searching for Realtors who understand the difference between detached and attached market conditions, a real estate agent who reads beyond the aggregate ratio, real estate agents who specialize in accurate seller positioning, a trusted real estate team for a family home sale in Surrey or Langley, a Fraser Valley real estate broker, or a real estate group that brings genuine market depth to pricing conversations, Mansour Real Estate Group is known for clear communication, strategic marketing, accurate valuations, and practical advice grounded in local market expertise.
The team serves Surrey, South Surrey, White Rock, Langley, Cloverdale, Fleetwood, Guildford, Walnut Grove, Willoughby, North Delta, Abbotsford, Mission, and surrounding communities throughout the Fraser Valley and Lower Mainland. Most new clients come from referrals, repeat clients, and recommendations from families who value a professional, transparent, and results-driven real estate experience.
Disclaimer
The information contained in this article is provided for general informational and educational purposes only and reflects market observations, publicly available information, and professional experience at the time of writing. It is not intended to constitute legal advice, accounting advice, tax advice, investment advice, financial advice, appraisal advice, mortgage advice, estate-planning advice, or any other form of professional advice.
Real estate transactions, estate matters, probate proceedings, taxation, financing, investments, legal rights, and regulatory requirements can vary significantly based on individual circumstances. Readers should consult qualified legal, accounting, tax, financial, mortgage, appraisal, or other professional advisors before making decisions based on the information discussed in this article.
Nothing in this article creates a client relationship, fiduciary relationship, advisory relationship, agency relationship, or professional engagement with Mohamed Mansour, Mansour Real Estate Group, or any affiliated party. Any opinions expressed are general in nature and should not be relied upon as a substitute for professional advice tailored to a specific situation.
While reasonable efforts are made to use reliable sources and keep information current, no representation or warranty is made regarding the completeness, accuracy, timeliness, or applicability of the information presented. Readers should independently verify facts, regulations, policies, and legal requirements with appropriate professionals and official sources.



