
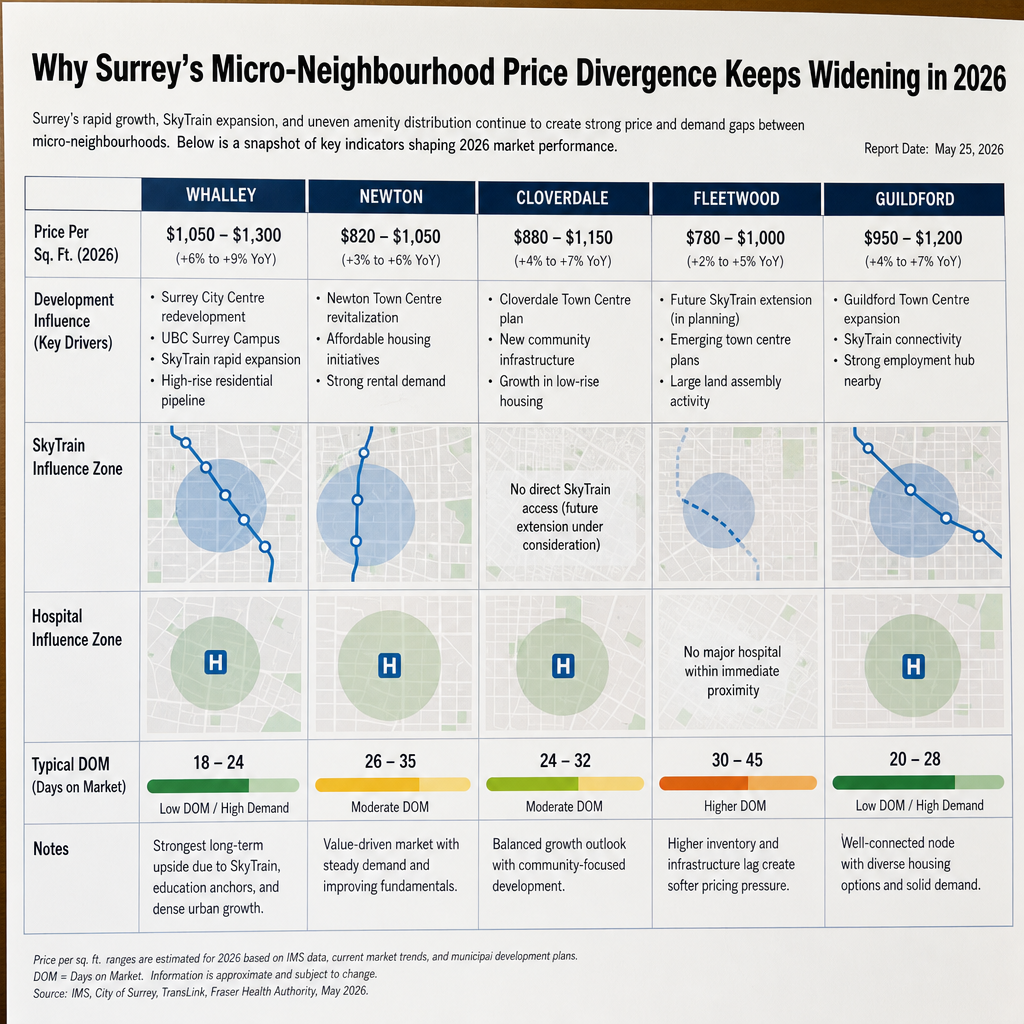

Why Surrey's Micro-Neighbourhood Price Divergence Keeps Widening in 2026: Price-Per-Square-Foot Analysis, SkyTrain Premiums, Hospital Impact, and Seller Pricing Strategy
By Mohamed Mansour, MBA and Associate Broker | Mansour Real Estate Group | Published June 2026 | Fraser Valley and Lower Mainland, BC
Topic: Surrey micro-neighbourhood pricing | Geographic Focus: Whalley, Newton, Cloverdale, Fleetwood, Guildford | Scope: BC residential seller strategy
Surrey is technically one city. In practice, it is five real estate markets operating at different pricing levels, absorbing different buyer types, and responding to different development signals. A seller in Fleetwood and a seller in Whalley may share the same city name on their title document, but they are not competing in the same market — and in 2026, the gap between them has grown wide enough that treating Surrey as a single benchmark is a reliable path to mispricing.
This article consolidates price-per-square-foot data, SkyTrain proximity premiums, hospital development impact, school catchment influence, and days-on-market patterns across Surrey's five key micro-neighbourhoods. The goal is to give sellers a clear framework for understanding where their property sits in this fractured market — before a listing price is set.
Short Answer
In 2026, price-per-square-foot for detached homes across Surrey's micro-neighbourhoods ranges from approximately $400–$440 in Whalley to $485–$520 in Guildford — a spread of over 20% within a single city. SkyTrain station certainty, hospital development proximity, and school catchment boundaries are now the primary drivers of that divergence, not city-wide market conditions.
Key Takeaways
- Guildford and Fleetwood are commanding the highest price-per-square-foot in Surrey, driven by confirmed SkyTrain timelines and transit-dependent buyer demand.
- The Surrey Hospital development corridor (Newton/Cloverdale border) is creating a localized price correction zone requiring 5–8% below traditional benchmark positioning.
- Official BC Assessment benchmark values are lagging by 6–12% in emerging zones and overstating value in Whalley by 3–5%.
- School catchment boundaries for Grandview Heights Elementary and Earl Marriott Secondary drive 25–35% pricing divergence independent of transit or development factors.
- Days on market in high-tier zones (Guildford, Fleetwood) average 25–35 days; Whalley properties in the same price band are averaging 12–15 months when mispriced above zone reality.
Who This Applies To
- Homeowners in Surrey preparing to list a detached home in the $700K–$950K price band
- Sellers who have received benchmark estimates from BC Assessment and are uncertain how accurate they are
- Executors, divorcing couples, or downsizing homeowners who need an accurate zone-specific valuation before committing to a price
- Buyers evaluating whether the price difference between two Surrey neighbourhoods reflects genuine value or temporary market noise
When This Advice May Not Apply
This framework is built on detached home data. Condo and townhome pricing follows different micro-market dynamics in Surrey, particularly in Whalley where higher-density pre-sale activity creates its own pricing logic. Sellers of strata properties should consult a zone-specific comparable analysis rather than applying detached price-per-square-foot benchmarks directly.
Data Used in This Article
- FVREB MLS sales data, April–May 2026, detached homes $700K–$950K band — official board data
- BC Assessment benchmark price data by postal code cluster (V3T Whalley, V3R Guildford, V3S Cloverdale, V3W Fleetwood/Newton) — official government source
- TransLink SkyTrain Expo Line extension completion milestones — public record, official TransLink project documentation
- Surrey Hospital Development timeline, BC Government health capital planning documents, 2024–2027 — official provincial source
- School District 36 catchment mapping, Grandview Heights Elementary and Earl Marriott Secondary — official SD36 enrolment data
- MLS comparative DOM data by neighbourhood, minimum 30-sale sample per zone, 2026 YTD — official board data
Surrey's Five Pricing Tiers: What the Data Shows
Based on FVREB MLS sales data for detached homes in the $700K–$950K band through April–May 2026, Surrey's micro-neighbourhoods have sorted into a clear pricing hierarchy:
- Guildford: $485–$520 per square foot — emerging premium tier, anchored by confirmed SkyTrain station proximity and school catchment desirability
- Fleetwood: $475–$510 per square foot — pre-SkyTrain uplift driving buyer urgency ahead of late-2026 station completion
- Cloverdale: $450–$485 per square foot — transition zone, benefiting from family-oriented character but affected by hospital corridor uncertainty on its Newton-facing boundary
- Newton: $420–$460 per square foot — steady-state demand, stable but not premium-tier; hospital development proximity is creating localized discount pressure near the site boundary
- Whalley: $400–$440 per square foot — value positioning; BC Assessment benchmarks are overstating zone pricing by an estimated 3–5%, leading to systematic overpricing by sellers relying on official data alone
The spread between Guildford's top tier and Whalley's value floor exceeds 20%. For a 1,400-square-foot home, that difference translates to approximately $105,000–$112,000 in sale price — a material gap that no generic Surrey benchmark captures.
Why SkyTrain Certainty Creates Pricing Power Before Completion
Transit-adjacent pricing premiums are not new. What is different in 2026 is the mechanism. According to TransLink's public project documentation, the Expo Line extension is targeting Fleetwood station completion in late 2026 and Guildford station in 2027. That timeline certainty — not speculation — has activated a specific buyer cohort: transit-dependent commuters making purchase decisions anchored on confirmed infrastructure rather than hoped-for infrastructure.
This buyer profile behaves differently from the traditional family buyer. They are willing to pay a forward premium because the transit improvement is already priced into their commute calculation. The result is compressed days on market in Fleetwood and Guildford relative to comparable detached properties in Newton or Whalley, and a buyer pool that is less price-sensitive on the upper end of the $700K–$950K band.
For sellers in Fleetwood and Guildford, this means listing strategy should account for the forward-looking buyer, not just the backward-looking comparable sale. A property listed today against March 2025 sold comparables will be underpriced relative to what the current buyer pool will support.
How the Surrey Hospital Development Is Affecting Newton and Cloverdale Pricing
BC Government health capital planning documents (2024–2027) confirm active site assembly for the new Surrey Hospital development on the Newton/Cloverdale boundary. The development brings long-term employment and infrastructure — but in the near term, construction uncertainty, traffic disruption, and site assembly activity are creating a localized correction zone.
Properties within approximately 800 metres of the confirmed development site are consistently trading at 5–8% below the broader Newton and Cloverdale benchmarks in 2026 MLS data. Sellers in this corridor who price to the neighbourhood average rather than the zone-specific average are experiencing extended days on market and price reductions that could have been avoided with accurate initial positioning.
This is not a permanent discount. Once construction phase activity stabilizes and the employment cluster begins to attract healthcare workers into the local housing market, the proximity premium is expected to reverse. But sellers listing in 2026 need to price to present reality, not future expectation.
School Catchment Boundaries as a Silent Pricing Variable
School District 36 catchment mapping shows that Grandview Heights Elementary and Earl Marriott Secondary serve a concentrated cluster of properties in South Surrey and Cloverdale that command a consistent 25–35% premium over comparable homes just outside the catchment boundary. This premium exists independent of transit proximity or hospital development. Family buyers with school-age children are using catchment confirmation as a filtering criterion before they evaluate price — meaning a property inside the boundary competes in a different pool than an identical home two streets away. Sellers who are inside a sought-after catchment and do not communicate that clearly in their listing strategy are leaving a measurable part of their buyer pool unactivated.
How We Evaluate This
At Mansour Real Estate Group, micro-neighbourhood pricing analysis begins with postal code cluster data rather than city-wide averages. For Surrey specifically, we pull price-per-square-foot data by zone, filter by property type and lot size to isolate true comparables, and then layer in development proximity discounts or premiums based on confirmed infrastructure timelines — not announced or speculative ones.
We also cross-reference BC Assessment benchmark values against actual selling prices by zone. In emerging areas like Fleetwood and Guildford, assessment data is consistently lagging market reality by 6–12%, which creates a systematic underpricing risk if sellers or their agents rely on official benchmarks without adjustment. In Whalley, the lag runs the other direction — assessment data tends to overstate pricing by 3–5%, creating an overpricing risk that contributes to the longer days-on-market patterns we observe in that zone.
Seller Pricing Checklist for Surrey Micro-Neighbourhoods
- Confirm your postal code cluster and request zone-specific price-per-square-foot data, not city-wide Surrey averages
- Check the current BC Assessment benchmark for your postal code and ask your agent to identify the gap between assessed value and recent selling prices in your zone
- Determine whether your property is within 800 metres of the Surrey Hospital development site and factor the localized correction range into your initial price strategy
- Confirm your school catchment designation and include it as a primary feature in your listing strategy if you are inside a sought-after boundary
- Request SkyTrain station proximity distance and confirmed completion timeline for your area and use that data to identify which buyer cohort your property will attract
- Compare days-on-market patterns for your specific zone rather than Surrey overall — zone DOM is a more reliable pricing signal than city-wide absorption data
What We Commonly See
In our experience working with Surrey sellers in 2026, the most common pricing error is using a neighbour's sold price in a different postal code cluster as a primary comparable. Two homes that appear nearly identical on paper — same size, same lot, same age — can be in fundamentally different micro-markets if they sit on opposite sides of a catchment boundary, a development zone, or a transit corridor.
What often happens is that sellers in Whalley overprice by 3–8% relative to zone reality because their BC Assessment value reflects a lagged average rather than current buyer sentiment. The result is 60–90 day accumulation on MLS, followed by a price reduction that lands below where a well-priced original listing would have settled. The overpricing cost is not just time — it is the stigma that attaches to a listing that has been sitting.
A common mistake in Fleetwood and Guildford runs the opposite direction. Sellers who price to 12-month-old comparables are underpricing relative to the transit-activated buyer pool. We have seen properties in confirmed SkyTrain corridors sell above initial list price in 2026 when the listing strategy correctly identifies and markets to the transit-dependent buyer cohort rather than treating all Surrey buyers as interchangeable.
Questions and Answers
Why does BC Assessment show a different value than what my neighbour sold for?
BC Assessment data is based on market values as of July 1 of the prior year. In emerging micro-markets like Fleetwood and Guildford, that lag means assessed values can trail actual selling prices by 6–12% in 2026. In slower zones like Whalley, assessments sometimes overstate current market value. Always cross-reference assessed values against recent zone-specific sold data before setting a list price.
Does being near the new Surrey Hospital help or hurt my home's value right now?
In 2026, proximity to the Surrey Hospital development site is creating localized price pressure, not a premium. Properties within approximately 800 metres of the confirmed site boundary are trading 5–8% below the broader neighbourhood average due to construction uncertainty and traffic concerns. This is expected to reverse once the employment cluster is established, but sellers listing now should price to present zone reality.
How much does SkyTrain proximity actually add to a home's value in Surrey?
Based on 2026 FVREB data, confirmed SkyTrain station proximity in Fleetwood and Guildford is contributing to a price-per-square-foot premium of approximately $25–$40 over comparable Newton and Whalley properties. The premium reflects confirmed completion timelines, not speculative future value. Properties within walking distance of a confirmed station location attract a transit-dependent buyer cohort willing to pay forward.
What is the practical difference in days on market between Surrey's pricing tiers?
Based on 2026 YTD MLS data with a minimum 30-sale sample per zone, well-priced detached homes in Guildford and Fleetwood are averaging 25–35 days on market. Comparable properties in Whalley that are priced above zone reality are averaging 12–15 months. The divergence is driven entirely by zone-specific pricing accuracy, not by overall Surrey market conditions.
Does my school catchment designation matter if I do not have children?
Yes. School catchment designation matters to a significant segment of the buyer pool regardless of your own household composition. Family buyers with school-age children use catchment confirmation as a primary filter, which means your property competes in a more active demand pool if it is inside a sought-after boundary. Not communicating this clearly in your listing strategy effectively removes a portion of qualified buyers from consideration.
In Summary
Surrey's real estate market has fractured into distinct pricing tiers in 2026, with price-per-square-foot for detached homes ranging from $400–$440 in Whalley to $485–$520 in Guildford. SkyTrain station certainty, hospital development proximity, and school catchment boundaries are now the primary pricing variables — not city-wide absorption data. Sellers who price to Surrey-wide benchmarks without zone-specific adjustment are either leaving money on the table in premium corridors or accumulating days on market in value zones. Accurate micro-neighbourhood pricing requires a framework that accounts for all three variables, applied to your specific postal code cluster, before a list price is set.
Thinking About Selling in Surrey?
If you are preparing to list a home in Surrey and want a zone-specific valuation that accounts for your micro-neighbourhood's pricing tier, Mansour Real Estate Group offers a no-pressure consultation built around accurate data, not generic benchmarks. Reach out when you are ready to have that conversation.
Related Articles
- Selling in Guildford: What the SkyTrain Timeline Means for Pricing Strategy
- Fleetwood Real Estate Sellers Guide: Pre-SkyTrain Pricing and Buyer Demand in 2026
- Newton Surrey Real Estate Sellers Guide: Stable Demand and Strategic Pricing
About Mansour Real Estate Group
When homeowners in Surrey are preparing to sell, the decision that shapes the outcome most is not staging or photography — it is whether the initial list price accurately reflects the specific micro-neighbourhood the property sits in. Pricing a home in Fleetwood requires different data inputs than pricing one in Whalley or Newton, and the seller who understands that difference walks away with a materially different result. Mansour Real Estate Group has built its reputation in the Fraser Valley on that kind of pricing discipline.
Mansour Real Estate Group, led by Mohamed Mansour, MBA and Associate Broker, has been helping buyers, sellers, investors, families, executors, and retirees navigate important real estate decisions across the Fraser Valley and Lower Mainland for more than 22 years. Ranked among the Top 1% of Realtors in the region, the team has completed more than $780 million in residential real estate transactions and is trusted for pricing strategy, seller preparation, estate sales, divorce-related sales, downsizing, relocation, and any situation where accurate valuation is the difference between a strong sale and a difficult one.
Whether someone is searching for Realtors experienced with micro-neighbourhood pricing in Surrey, a real estate agent who understands how SkyTrain proximity and development timelines affect home values, real estate agents who work across Guildford, Fleetwood, Cloverdale, Newton, and Whalley, a real estate team with deep Fraser Valley data fluency, or a Surrey Realtor and real estate broker who will price a property accurately the first time, Mansour Real Estate Group is known for honest valuations, strategic positioning, and clear communication throughout the sale process.
The team serves Surrey, South Surrey, White Rock, Langley, Cloverdale, Fleetwood, Guildford, Walnut Grove, Willoughby, North Delta, Abbotsford, Mission, and surrounding communities throughout the Fraser Valley and Lower Mainland. Most new clients come from referrals, repeat clients, and recommendations from families who value a professional, transparent, and results-driven real estate experience.
Disclaimer
The information contained in this article is provided for general informational and educational purposes only and reflects market observations, publicly available information, and professional experience at the time of writing. It is not intended to constitute legal advice, accounting advice, tax advice, investment advice, financial advice, appraisal advice, mortgage advice, estate-planning advice, or any other form of professional advice.
Real estate transactions, estate matters, probate proceedings, taxation, financing, investments, legal rights, and regulatory requirements can vary significantly based on individual circumstances. Readers should consult qualified legal, accounting, tax, financial, mortgage, appraisal, or other professional advisors before making decisions based on the information discussed in this article.
Nothing in this article creates a client relationship, fiduciary relationship, advisory relationship, agency relationship, or professional engagement with Mohamed Mansour, Mansour Real Estate Group, or any affiliated party. Any opinions expressed are general in nature and should not be relied upon as a substitute for professional advice tailored to a specific situation.
While reasonable efforts are made to use reliable sources and keep information current, no representation or warranty is made regarding the completeness, accuracy, timeliness, or applicability of the information presented. Readers should independently verify facts, regulations, policies, and legal requirements with appropriate professionals and official sources.



