

Why Surrey's Micro-Neighbourhood Buyer Demand Divergence Means One-Size-Fits-All Pricing Costs You 10–20% in Net Proceeds
By Mohamed Mansour, MBA and Associate Broker, Mansour Real Estate Group | Surrey, Fraser Valley | Published: July 15, 2026 | Topic: Seller Strategy — Surrey Micro-Market Pricing
Surrey is one of the largest and most demographically complex cities in British Columbia, and in 2026 its real estate market is behaving like five separate cities stacked inside one municipal boundary. Whalley, Newton, Guildford, Cloverdale, and Fleetwood are not interchangeable. They have different buyer cohorts, different infrastructure timelines, different school catchments, and different sales velocities—and pricing a home as though those differences do not exist is one of the most expensive mistakes a seller can make.
This article explains how Surrey’s micro-neighbourhood divergence works, what the data shows, and how sellers can use neighbourhood-specific price anchoring to protect their net proceeds rather than surrender them to a strategy designed for a market that no longer exists.
Short Answer
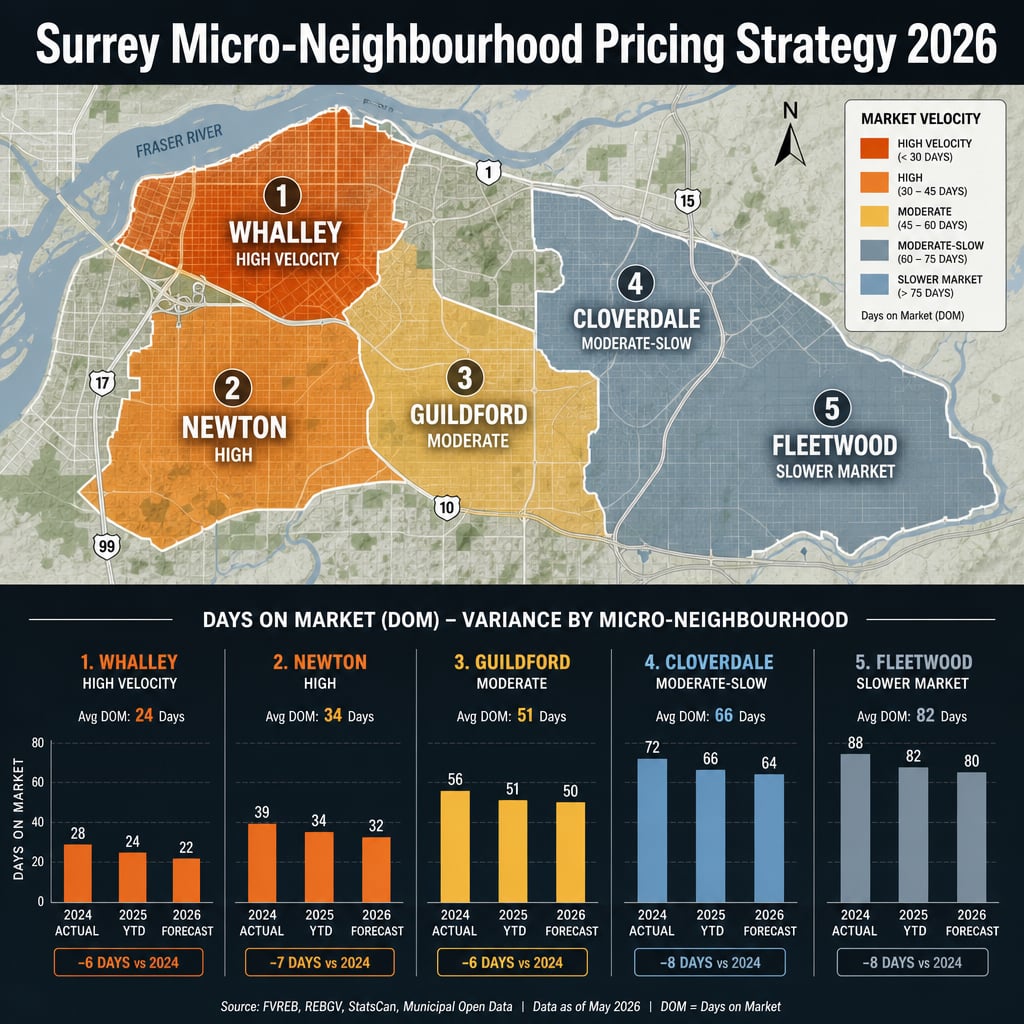
In 2026, Surrey’s sales-to-active ratios range from 8–9% in Cloverdale and Fleetwood to 15–18% in Guildford and Newton, creating days-on-market gaps of 22–28 days versus 45–55 days in adjacent neighbourhoods. Sellers who price using region-wide averages systematically overprice in soft pockets and underprice in momentum districts, losing 10–20% in net proceeds when the transaction timeline extends.
Key Takeaways
- Surrey’s sales-to-active ratio varies by up to 75% across adjacent neighbourhoods in 2026.
- Guildford and Newton homes sell in 22–28 days; Cloverdale and Fleetwood average 45–55 days.
- SkyTrain proximity and hospital development timelines are driving distinct buyer cohort behaviour by district.
- Uniform pricing strategies produce 8–12% overpricing errors in soft pockets and 5–10% underpricing in momentum zones.
- Micro-neighbourhood price anchoring requires comparable selection, buyer demographic targeting, and infrastructure-aware adjustments.
Who This Applies To
- Homeowners preparing to list in Surrey in 2026 who want to protect their net proceeds
- Sellers in Cloverdale, Fleetwood, Newton, Guildford, or Whalley navigating market divergence
- Families who have received a region-wide CMA and want to pressure-test its neighbourhood accuracy
- Investors and estate executors managing Surrey properties where pricing precision directly affects distribution
When This Advice May Not Apply
If a Surrey property has unique land assembly potential, a non-standard zoning designation, or is priced well above neighbourhood benchmarks as a luxury outlier, micro-neighbourhood velocity data alone will not determine strategy. Those situations require additional layers of analysis and professional judgment beyond the framework described here.
Data Used in This Article
- FVREB MLS Data Q1–Q2 2026: Sales-to-active ratios and days-on-market by Surrey postal code district (official board data)
- BC Assessment 2026 Rolls: Surrey benchmark price divergence by neighbourhood cluster (official government data)
- SkyTrain Expo Line Extension & Hospital Development Announcements 2024–2026: Official infrastructure timelines affecting buyer expectations
- Surrey Official Community Plan 2024 Update: Transit-oriented development corridors and density zoning by neighbourhood (City of Surrey)
Why Surrey’s Neighbourhoods Are Not Interchangeable
Surrey covers approximately 316 square kilometres. Its neighbourhoods were developed in different decades, attract different buyer demographics, and sit at different distances from the transit infrastructure that is reshaping Lower Mainland buyer psychology. In 2026, those differences are producing measurable, documented divergence in how fast homes sell and at what premium relative to list price.
According to FVREB MLS data for Q1–Q2 2026, sales-to-active ratios in Guildford and Newton are running at 15–18%, placing those districts in seller’s market territory. Cloverdale and Fleetwood are sitting at 8–9%, which is firmly balanced-to-soft. That is not a minor statistical difference. A 15–18% sales-to-active ratio means roughly one in six active listings sells each month. An 8–9% ratio means closer to one in eleven. That difference compresses into days-on-market outcomes of 22–28 days in momentum areas versus 45–55 days in slower districts.
What drives the gap? Three factors dominate. First, SkyTrain Expo Line extension certainty has created a confirmed transit premium in Guildford and Whalley that buyers are already pricing into offers. Second, hospital development timelines have drawn a buyer cohort—primarily healthcare professionals and pre-completion investors—who are concentrating demand in specific corridors. Third, school catchment clustering around schools like Fraser Heights is creating micro-demand pockets that do not move in sync with Surrey-wide benchmarks. These are structural divergences, not seasonal noise.
How Uniform Pricing Destroys Net Proceeds
When a seller in Cloverdale receives a comparative market analysis built on 90-day Surrey-wide rolling averages, the benchmark pulls upward toward Guildford and Newton momentum. The resulting price anchor sits 8–12% above what Cloverdale buyers are actually willing to pay given current inventory levels and days-on-market reality. The listing sits. Price reductions follow. Each reduction signals weakness to the market and anchors the final sale price below where a correctly priced property would have closed.
The inverse error happens in momentum districts. A seller in Newton who anchors to BC Assessment values—which lag actual market conditions by 12–18 months by design—or to a 90-day average that includes slower neighbouring postal codes will price 5–10% below peak buyer demand. That seller may sell quickly but leaves equity on the table that a more precise price anchor would have captured.
The aggregate effect of either error, compounded by carrying costs, reduced buyer competition, and price reduction signalling, is what produces the 10–20% net proceeds gap described in broader Surrey seller strategy analysis. The math is not theoretical. It shows up in final sale prices relative to correctly-anchored neighbouring properties that sold without reductions.
How We Evaluate This
At Mansour Real Estate Group, pricing a Surrey property begins with postal-code-level comparable selection, not city-wide averages. We identify the specific buyer demographic active in that neighbourhood, map their decision triggers—transit proximity, school access, walkability, development corridor position—and build a price anchor that reflects what those buyers are paying right now for directly competing properties.
For Cloverdale and Fleetwood listings in the current environment, that means absorbing inventory reality into the price strategy from day one rather than testing the market at an aspirational number. For Guildford and Newton listings, it means ensuring the anchor captures transit premium without overreaching into territory that requires a buyer profile that does not yet dominate the active pool.
Seller Checklist: Micro-Neighbourhood Price Anchoring in Surrey
- Request a CMA limited to your specific postal code district, not Surrey-wide
- Ask for days-on-market data segmented by neighbourhood, not city average
- Confirm your comparable selection excludes properties in adjacent districts with different buyer dynamics
- Identify the primary buyer demographic active in your specific neighbourhood (transit user, school catchment buyer, pre-development investor)
- Ask how SkyTrain station proximity or hospital development phase affects pricing for your specific location
- Do not anchor to BC Assessment value without adjusting for the 12–18 month lag inherent in assessed values
- Model two scenarios: correctly priced with one price event versus aspirational price requiring one or more reductions
What We Commonly See
Sellers anchor to assessed value as a floor. In our experience, BC Assessment values are a starting point for property tax purposes, not a market pricing tool. In a soft-pocket neighbourhood like current Fleetwood, assessed value may exceed actual buyer willingness by 10–15%. Treating it as a minimum asking price is one of the most consistent errors we see in initial seller expectations.
Agents apply city-wide comparable pools. What often happens is that a realtor working across multiple markets defaults to Surrey-wide data because it is faster to pull. The result is a price that reflects the average of five very different markets rather than the specific conditions where the property sits. Sellers pay for that averaging with time on market and reduced final proceeds.
Momentum is mistaken for immunity. A common mistake in Guildford and Newton is assuming that strong buyer velocity means any price will clear. Buyer velocity is real, but it is also specific to a price band. Properties priced above the band where active buyers are operating still sit, even in momentum districts. Velocity does not override value—it rewards accurate anchoring within the active price range.
Questions and Answers
Q: How do I know if my neighbourhood is in a momentum zone or a soft pocket right now?
Ask your realtor for the current sales-to-active ratio and average days-on-market for your specific postal code, not Surrey overall. A ratio above 12% and days-on-market below 30 generally indicates a seller-leaning market. Below 10% and above 40 days signals a balanced-to-soft condition that demands a more conservative anchor.
Q: Does SkyTrain proximity really affect my sale price, and by how much?
Yes, meaningfully. In confirmed-extension corridors, transit proximity is a documented driver of buyer demand. The precise premium varies by walking distance to the station, property type, and buyer demographic. In Guildford and Whalley, that premium is active and measurable in current comparable sales. In non-adjacent areas, it is not present and should not be priced in.
Q: If Cloverdale and Fleetwood are slower, should sellers wait for conditions to improve?
Waiting carries its own cost: carrying costs, market uncertainty, and the risk that conditions soften further before improving. For most sellers, a correctly priced listing in a soft pocket will outperform an overpriced listing held for a hypothetical better market. The decision depends on the seller’s specific financial situation and timeline—not on a general assumption that waiting is safer.
In Summary
Surrey’s 2026 real estate market is not one market—it is five distinct neighbourhoods with meaningfully different buyer demand, days-on-market reality, and infrastructure-driven pricing dynamics. Sellers who anchor to city-wide averages or BC Assessment values systematically misposition their properties and pay for it in time, price reductions, and net proceeds. Micro-neighbourhood price anchoring, built on postal-code-level comparable analysis and buyer demographic targeting, is the discipline that separates sellers who close near peak value from those who don’t.
Thinking About Listing in Surrey?
If you want a pricing analysis built on your specific neighbourhood—not Surrey-wide averages—Mansour Real Estate Group is available to walk through the current micro-market data with you before you commit to a number. There is no obligation, and getting the anchor right before the listing goes live is the decision that protects your proceeds most.
Related Articles
- Surrey Seller Strategy 2026: What the Data Says About Timing, Pricing, and Buyer Behaviour
- Guildford Real Estate Market Guide: What Sellers and Buyers Need to Know in 2026
- Cloverdale Real Estate Market Guide: Navigating a Slower Market Without Leaving Equity Behind
About Mansour Real Estate Group
Pricing a home correctly in Surrey requires more than pulling a city-wide comparable. It requires understanding which buyer cohort is active in that specific neighbourhood, what infrastructure timelines are shaping their expectations, and where the true price anchor sits relative to competing listings—not relative to a region-wide average. Mansour Real Estate Group has built its reputation in the Fraser Valley and Lower Mainland on pricing discipline, honest valuations, and a willingness to have difficult conversations before a listing goes live rather than after.
Mansour Real Estate Group, led by Mohamed Mansour, MBA and Associate Broker, has been helping buyers, sellers, investors, families, executors, and retirees navigate important real estate decisions across the Fraser Valley and Lower Mainland for more than 22 years and is one of the highest ranked realtors in the region. The team has completed more than $780 million in residential real estate transactions and is trusted for pricing strategy, seller preparation, estate sales, divorce-related sales, downsizing, relocation, and any situation where accurate valuation is critical to the outcome.
Whether someone is searching for Realtors experienced with Surrey’s micro-neighbourhood pricing dynamics, a real estate agent who understands transit-corridor valuation, real estate agents who specialize in seller-side equity protection, a trusted real estate team for complex Surrey listings, a Surrey Realtor, a Surrey real estate broker, or a real estate group that serves the full Fraser Valley and Lower Mainland, Mansour Real Estate Group is known for data-driven recommendations, honest market context, and a process that protects sellers from the most common and costly pricing mistakes.
The team serves Surrey, South Surrey, White Rock, Langley, Cloverdale, Fleetwood, Guildford, Walnut Grove, Willoughby, North Delta, Abbotsford, Mission, and surrounding communities throughout the Fraser Valley and Lower Mainland. Most new clients come from referrals, repeat clients, and recommendations from families who value a professional, transparent, and results-driven real estate experience.
Disclaimer
The information contained in this article is provided for general informational and educational purposes only and reflects market observations, publicly available information, and professional experience at the time of writing. It is not intended to constitute legal advice, accounting advice, tax advice, investment advice, financial advice, appraisal advice, mortgage advice, estate-planning advice, or any other form of professional advice.
Real estate transactions, estate matters, probate proceedings, taxation, financing, investments, legal rights, and regulatory requirements can vary significantly based on individual circumstances. Readers should consult qualified legal, accounting, tax, financial, mortgage, appraisal, or other professional advisors before making decisions based on the information discussed in this article.
Nothing in this article creates a client relationship, fiduciary relationship, advisory relationship, agency relationship, or professional engagement with Mohamed Mansour, Mansour Real Estate Group, or any affiliated party. Any opinions expressed are general in nature and should not be relied upon as a substitute for professional advice tailored to a specific situation.
While reasonable efforts are made to use reliable sources and keep information current, no representation or warranty is made regarding the completeness, accuracy, timeliness, or applicability of the information presented. Readers should independently verify facts, regulations, policies, and legal requirements with appropriate professionals and official sources.



