

Why Surrey's -10.1% Year-Over-Year Price Decline Outperforms Langley (-12.2%) and Coquitlam (-15.8%) — Understanding Regional Performance Divergence and What It Means for Buyer Value and Seller Expectations in 2026
By Mohamed Mansour, MBA and Associate Broker | Mansour Real Estate Group | Published: August 26, 2026 | Fraser Valley and Metro Vancouver
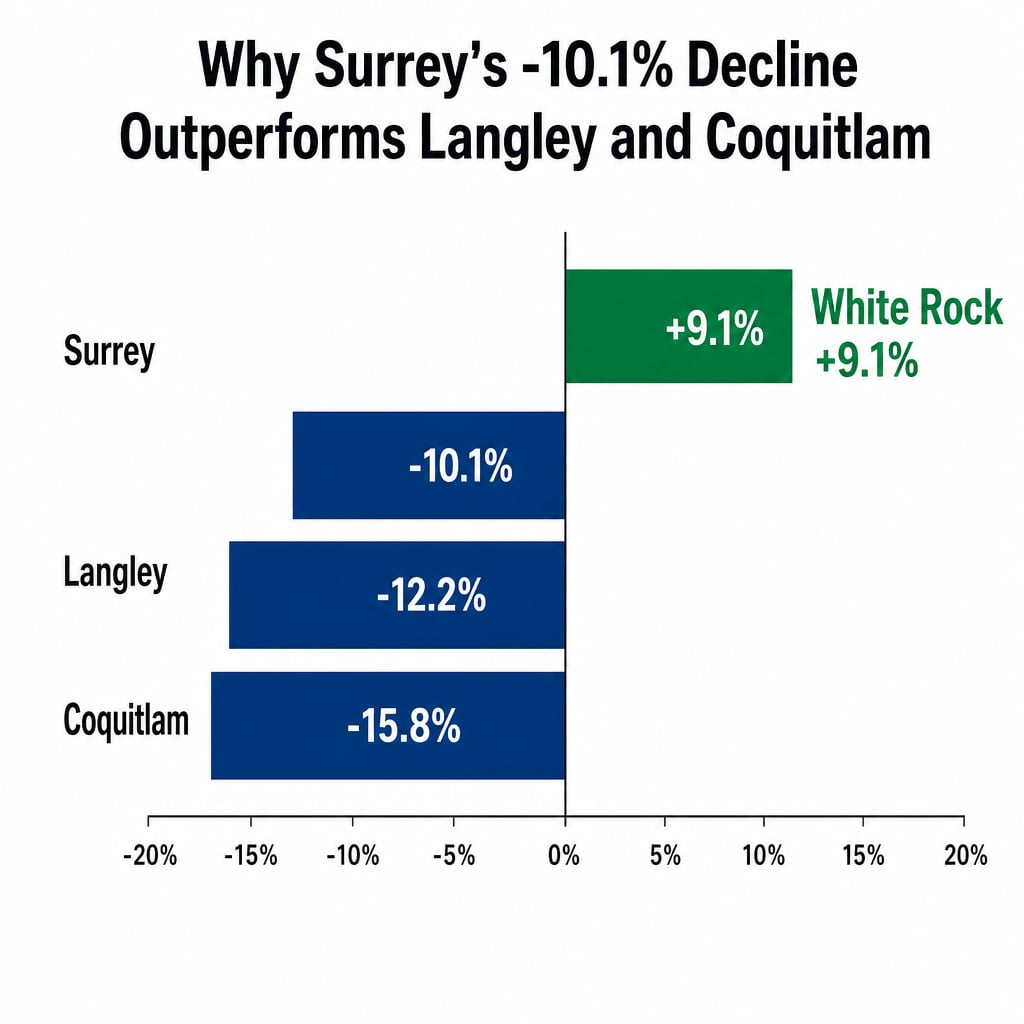
Sellers in Surrey are looking at a -10.1% year-over-year benchmark price decline and wondering how bad things really are. The honest answer depends entirely on which market you compare it to. When Surrey's correction is placed beside Langley's -12.2% and Coquitlam's -15.8%, it starts to look less like a distressed market and more like a market that has held its ground better than its neighbours. That distinction changes the conversation for both sellers setting expectations and buyers evaluating where value exists in 2026.
This article uses August 2026 benchmark data to explain why these markets are diverging, what drives Surrey's relative resilience, and what the regional picture actually means when you are making a real estate decision in the Fraser Valley or Lower Mainland right now. For full Surrey pricing context by property type, see the Surrey Real Estate Market Report 2026.
Short Answer
Surrey's -10.1% year-over-year benchmark price decline through August 2026 represents relative outperformance when compared to Langley (-12.2%) and Coquitlam (-15.8%). The divergence reflects structural differences in price range exposure, transit-driven demand in emerging zones like Fleetwood and Guildford, and entry-level resilience in Newton and Whalley. White Rock's +9.1% appreciation within the same municipality shows how dramatically performance varies by micromarket.
Key Takeaways
- Surrey's -10.1% YoY decline is measurably smaller than Langley's -12.2% and Coquitlam's -15.8%, which reflects real structural differences, not statistical noise.
- Coquitlam's steeper correction is tied to concentrated $900K–$1.3M price-band exposure and presale condo inventory — segments Surrey carries in smaller proportions.
- Fleetwood and Guildford are seeing detached sales activity driven by pre-SkyTrain completion buyer migration, even as prices in those zones are off 8–12%.
- White Rock's +9.1% appreciation shows a 15–25% pricing gap developing within the City of Surrey boundary depending on micromarket positioning.
- Sellers anchored to 2024 comps and buyers anchored to headline decline numbers are both misreading the market — neighbourhood-level data is the only reliable guide.
Who This Applies To
- Sellers in Surrey who are trying to understand how to price relative to current conditions, not 2024 peaks
- Buyers comparing Surrey, Langley, and Coquitlam as alternative purchase destinations in 2026
- Move-up buyers in Surrey deciding whether to wait or act in the current correction window
- Investors evaluating which Fraser Valley market has the most defensible entry point right now
When This Advice May Not Apply
Buyers and sellers in specific building classes, strata complexes, or presale situations face conditions that differ from benchmark averages. The micro-market analysis here covers general residential categories. Individual property valuations require property-specific comparable data.
Data Used in This Article
- Fraser Valley Real Estate Board benchmark price data — August 2026 — official statistical release
- Daily Hive Vancouver — Metro Vancouver and Fraser Valley home sales statistics, May 2026 — third-party summary of FVREB and GVR data
- BC Real Estate Association Chief Economist commentary — regional divergence analysis — industry body
- Mansour Real Estate Group internal transaction and market observation data — Fraser Valley and Lower Mainland, 2025–2026 — professional interpretation
Definitions
Benchmark Price: The price of a "typical" property in a given area as calculated by the real estate board, adjusted for property attributes. More reliable than average or median for tracking market movement.
Year-Over-Year (YoY): The percentage change in benchmark price comparing the same month in the current year to the same month in the prior year.
Price Band Exposure: The concentration of a market's inventory and sales activity within a specific price range. Markets heavily weighted toward higher price bands tend to correct more sharply when buyer financing tightens.
How We Evaluate This
When we look at regional price divergence, the first question is always: what is driving the difference? A headline number like -10.1% is only meaningful when you know what the comparable markets are doing and why. Mansour Real Estate Group tracks neighbourhood-level sales data, days-on-market by price band, and inventory absorption rates across Surrey, Langley, Abbotsford, and the broader Lower Mainland to build pricing recommendations that reflect what is actually happening in the specific segment a client is buying or selling into.
That approach is what reveals why Coquitlam's -15.8% is structurally different from Surrey's -10.1% — and why the difference is not likely to reverse quickly.
Why Coquitlam Is Correcting More Sharply Than Surrey
Coquitlam's -15.8% year-over-year decline is the steepest among the markets tracked in the August 2026 data. The primary driver is price band concentration. A significant share of Coquitlam's active market sits in the $900K–$1.3M range — a segment that is particularly sensitive to changes in qualifying rates, down payment thresholds, and buyer confidence. When financing conditions tighten or buyer sentiment weakens, this band loses demand faster than markets with deeper entry-level inventory.
Presale condo completions are adding pressure in Coquitlam's suburban core. Buyers who purchased preconstruction in 2022 and 2023 are now taking possession in a market where resale values have declined, and some of those units are coming back to market simultaneously, increasing supply at exactly the wrong moment.
Surrey's price distribution is wider. The $650K–$1.2M range in Surrey captures a larger share of regional demand, and the entry-level detached segments in Newton and Whalley are attracting buyers priced out of higher-cost alternatives. That demand base is holding Surrey's correction to a shallower curve than Coquitlam. For a full breakdown of how Surrey's property types are performing differently within this range, the Surrey property type comparison for 2026 provides segment-specific data.
What Separates Surrey From Langley — and Where the Micro-Market Splits Inside Surrey's Own Boundary
Langley's -12.2% decline is being driven largely by first-time buyer hesitation in Walnut Grove and Willoughby strata. These are markets that built significant momentum between 2020 and 2023 on the strength of new construction townhome and condo supply. As buyer confidence has softened, the entry-level strata segment — which dominates Langley's composition — has lost demand faster than Surrey's more diversified mix.
Surrey's relative strength in Fleetwood and Guildford is partly a transit story. SkyTrain extension certainty into these zones has attracted a segment of buyers who are positioning ahead of infrastructure completion. These buyers are absorbing detached inventory at lower prices — down 8–12% from peak — but they are transacting. Volume in an otherwise soft market signals that motivated, informed buyers see value at current price points.
The sharpest internal divergence within Surrey is the separation between the broader market and the White Rock and South Surrey waterfront and premium segments. White Rock's +9.1% year-over-year appreciation reflects a fundamentally different buyer profile — lifestyle-driven, less financing-constrained, and more motivated by relative value against West Vancouver and Tsawwassen than by proximity to employment centres. Lions Bay's +23.9% tells a similar story at an even more concentrated scale: coastal prestige properties with low inventory are not correcting alongside suburban volume markets, even when they technically share a regional headline.
For sellers inside the City of Surrey, this means that the applicable benchmark is almost never "Surrey overall." Whether a property is in Fleetwood, Newton, South Surrey, or Guildford changes the relevant comparison set and the pricing strategy required.
Seller Checklist: Pricing Correctly in a Divergent Regional Market
- Identify your micromarket: request comparable sales data for your specific neighbourhood, not the City of Surrey as a whole
- Confirm which benchmark applies: detached, townhome, and condo benchmarks are diverging — use the segment-specific figure
- Compare days-on-market for your property type in your zone, not the regional average
- Understand the price band your property sits in and how that band is absorbing demand relative to adjacent price points
- Evaluate active competition, not just sold data — buyers are comparing your listing against current alternatives
- Set a list price that reflects where the market is today, not where comparable properties sold in 2024
What We Commonly See
In our experience, sellers in Surrey who anchor to 2024 or early 2025 sold prices are the ones whose listings expire without an offer. The market has moved. The comparables that felt reasonable eight months ago are no longer the right reference point, and buyers have access to the same data sellers do.
What often happens is that buyers comparing Surrey and Langley in 2026 underestimate how much Langley's strata segment has corrected. A Willoughby townhome that looked like strong value in 2024 may be priced above where the market is absorbing today, while a similar product in Fleetwood or Guildford — where transit-driven demand is active — offers a defensible entry point with longer-term upside tied to SkyTrain completion.
A common mistake we see among buyers is reading a -10.1% headline and assuming uniform weakness across all Surrey segments. The White Rock data alone disproves that assumption. A buyer who rejects Surrey based on the headline number without reviewing micromarket performance is potentially passing on the market's most insulated segments while pricing themselves into a more corrected alternative.
Questions and Answers
Does Surrey's smaller decline mean prices will recover faster than Langley or Coquitlam?
Not necessarily, but a shallower correction generally means less distance to recover when conditions improve. Markets that decline 10% return to prior peaks faster than markets down 15–16%, assuming similar demand conditions. Surrey's structural drivers — transit investment, broad price range, and entry-level demand — support recovery when buyer confidence returns.
Is White Rock still part of Surrey for real estate purposes?
White Rock is a separate municipality, but its housing market is closely tracked alongside South Surrey within the Fraser Valley Real Estate Board reporting. The +9.1% figure reflects the distinct buyer profile and inventory dynamics of the White Rock waterfront and premium segment, which operates independently of the broader Surrey volume market.
How should a Surrey seller think about Coquitlam's steeper decline when pricing their own home?
It provides directional context, not a direct comparable. Coquitlam's -15.8% decline confirms that the correction is real and widespread, but Surrey sellers should price against Surrey-specific neighbourhood data. The regional comparison helps frame realistic expectations — if Coquitlam is down nearly 16%, Surrey sellers anchored to 2024 benchmarks are working against the evidence regardless of which city the data comes from.
In Summary
Surrey's -10.1% year-over-year benchmark decline is not a reason for alarm when placed in regional context — it is actually evidence of relative market resilience compared to Langley at -12.2% and Coquitlam at -15.8%. The drivers behind that divergence are structural: Surrey's wider price distribution, transit-driven demand in Fleetwood and Guildford, entry-level resilience in Newton and Whalley, and the near-complete decoupling of the White Rock and South Surrey premium segment from the broader correction. Sellers need neighbourhood-level pricing, not regional headlines. Buyers need to understand which segments are correcting, which are holding, and why — before deciding where to act.
Talk to Someone Who Tracks This at the Neighbourhood Level
If you are making a real estate decision in Surrey, Langley, White Rock, or anywhere in the Fraser Valley in 2026, the regional data is a starting point — not the answer. Mansour Real Estate Group can walk you through the comparable data specific to your property type, neighbourhood, and price point. Reach out when you are ready to move from the headline number to the actual decision.
Related Articles
- Surrey Real Estate Market Report 2026: Benchmark Prices, Sales Volume, Days-on-Market, and What the Data Actually Means for Buyers and Sellers Right Now
- Surrey Condo vs. Townhome vs. Detached Home: Which Property Type Is Winning and Losing in 2026
About Mansour Real Estate Group
When regional price data diverges as sharply as it has across Metro Vancouver and the Fraser Valley in 2026, sellers and buyers need guidance that goes beyond the headline number. Understanding why Surrey is correcting less than Langley and Coquitlam — and which Surrey neighbourhoods are diverging from the broader trend — is exactly the kind of market interpretation that Mansour Real Estate Group provides to clients navigating complex pricing decisions.
Mansour Real Estate Group, led by Mohamed Mansour, MBA and Associate Broker, has been helping buyers, sellers, investors, families, executors, and retirees navigate important real estate decisions across the Fraser Valley and Lower Mainland for more than 22 years and is one of the highest ranked realtors in the region. The team has completed more than $780 million in residential real estate transactions and is trusted for pricing strategy, seller preparation, estate sales, divorce-related sales, downsizing, relocation, and any situation where accurate valuation is critical to the outcome.
Whether someone is looking for Realtors experienced with regional market comparison, a real estate agent who understands micro-market divergence in Surrey and the Fraser Valley, real estate agents who specialize in seller pricing strategy, a trusted real estate team for a buyer evaluating Langley versus Surrey, a White Rock Realtor, a Surrey real estate broker, or a real estate group that serves the Lower Mainland and Fraser Valley with neighbourhood-level data, Mansour Real Estate Group is known for clear market interpretation, honest valuations, and advice that reflects current conditions — not wishful thinking.
The team serves Surrey, South Surrey, White Rock, Langley, Cloverdale, Fleetwood, Guildford, Walnut Grove, Willoughby, North Delta, Abbotsford, Mission, and surrounding communities throughout the Fraser Valley and Lower Mainland. Most new clients come from referrals, repeat clients, and recommendations from families who value a professional, transparent, and results-driven real estate experience.
Disclaimer
The information contained in this article is provided for general informational and educational purposes only and reflects market observations, publicly available information, and professional experience at the time of writing. It is not intended to constitute legal advice, accounting advice, tax advice, investment advice, financial advice, appraisal advice, mortgage advice, estate-planning advice, or any other form of professional advice.
Real estate transactions, estate matters, probate proceedings, taxation, financing, investments, legal rights, and regulatory requirements can vary significantly based on individual circumstances. Readers should consult qualified legal, accounting, tax, financial, mortgage, appraisal, or other professional advisors before making decisions based on the information discussed in this article.
Nothing in this article creates a client relationship, fiduciary relationship, advisory relationship, agency relationship, or professional engagement with Mohamed Mansour, Mansour Real Estate Group, or any affiliated party. Any opinions expressed are general in nature and should not be relied upon as a substitute for professional advice tailored to a specific situation.
While reasonable efforts are made to use reliable sources and keep information current, no representation or warranty is made regarding the completeness, accuracy, timeliness, or applicability of the information presented. Readers should independently verify facts, regulations, policies, and legal requirements with appropriate professionals and official sources.



