
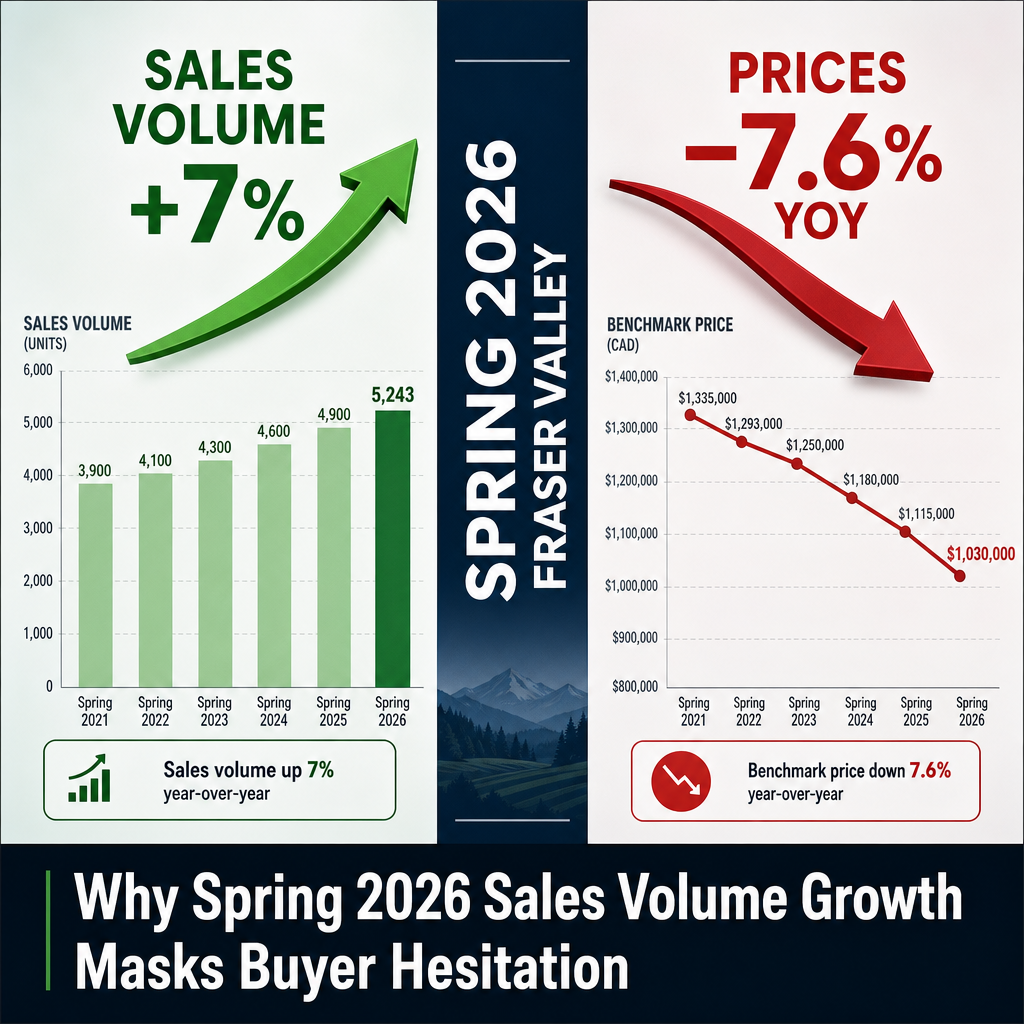

Why Spring 2026 Sales Volume Growth Masks Buyer Hesitation: Understanding the Fraser Valley's Volume-Price Disconnect and What It Means for Sellers' Timing Decisions
By Mohamed Mansour, MBA and Associate Broker | Mansour Real Estate Group
Published: July 14, 2026 | Fraser Valley and Lower Mainland, British Columbia
The spring 2026 headlines told a reassuring story: sales were up, buyers were moving, and the market was showing signs of life after a difficult stretch. For sellers watching from the sidelines, that narrative was easy to misread. More transactions does not mean better pricing. In the Fraser Valley this spring, it meant something different entirely.
This article explains what drove the sales increase, why prices kept falling at the same time, and what that combination tells sellers who are weighing whether to list now or wait for conditions that more genuinely favour their side of the transaction.
Short Answer
Fraser Valley sales rose 7% year-over-year in April 2026, the strongest month of the year, while benchmark prices declined 7.6% year-over-year. The sales-to-active listings ratio sat at 11% in June — still firmly in buyer's market territory. Rising transaction volume reflected buyer urgency around affordability, not a shift in pricing power toward sellers.
Key Takeaways
- April 2026 was the strongest sales month of the year, but Fraser Valley benchmark prices still fell 7.6% year-over-year.
- The sales-to-active listings ratio stayed at 11% in June 2026, below the 12% threshold that defines a balanced market.
- Months of inventory compressed from 8.0 to 7.7 — the buyer leverage window is narrowing, but pricing power has not shifted to sellers.
- Volume growth reflected buyers acting on affordability and compressed timelines, not market recovery or improved seller conditions.
- Sellers who price to current market reality sell. Sellers who price to the volume headline sit on market and accumulate days.
Who This Applies To
- Homeowners in Surrey, Langley, Abbotsford, South Surrey, or anywhere in the Fraser Valley weighing a 2026 listing decision
- Sellers who saw spring sales headlines and are wondering whether conditions have improved
- Families who need to sell but want to understand the real market before setting price expectations
- Investors or estate executors deciding whether to list now or defer
When This Advice May Not Apply
If you own a property in a sub-market with very low competing inventory — certain townhouse tiers in Willoughby, for example, or specific detached segments in South Surrey — local conditions may differ from the broader Fraser Valley average. This article reflects board-level data. Always review the specific sub-market and property type before making a pricing decision.
Data Used in This Article
- Fraser Valley Real Estate Board Monthly Market Reports — May and June 2026 — official board data, sales volume, benchmark prices, sales-to-active ratios
- Zealty BC Housing Market Report — April 2026 — regional sales volume summary including Greater Vancouver and Fraser Valley
- Daily Hive Vancouver — May 2026 — regional sales statistics summary
- Rob Vander Wel (robv.ca) — May 2026 — BC housing market commentary and ratio interpretation
What the Spring 2026 Numbers Actually Show
According to the Fraser Valley Real Estate Board's reports for spring 2026, April delivered 1,118 sales in the Fraser Valley — up 7% year-over-year and the region's strongest month of the year. Greater Vancouver recorded 2,112 sales in the same period. Those are real numbers, and they represent real buyer activity.
At the same time, the Fraser Valley benchmark price was down 7.6% year-over-year in April. May and June continued that pattern: modest month-over-month sales gains, with prices edging down another 0.7% to 1.5% monthly. The sales-to-active listings ratio moved from 10% in February to 11% in June — an improvement, but still below the 12% threshold that marks a balanced market. Months of inventory compressed slightly from 8.0 in March to 7.7 in April.
What this tells an experienced analyst is straightforward. Buyers were active. But they were not bidding prices up. They were completing transactions at prices that reflected their leverage — buying at discounts because sellers needed to meet the market, not because conditions had turned.
Why Buyers Were Buying — and What It Means for Sellers
The buyers driving spring 2026 volume were not acting because they believed prices were recovering. They were acting because affordability — relative to the 2021–2022 peak — had improved substantially, and because they recognized the window of maximum buyer leverage might not stay open indefinitely.
That distinction matters for sellers. When buyers move on affordability signals rather than recovery signals, they are still price-disciplined. They will walk away from overpriced listings. They are researching benchmark declines and using that information at the offer table. The Fraser Valley Real Estate Board's monthly data makes the year-over-year decline visible to any buyer who looks. And most serious buyers are looking.
For a seller in Surrey, Langley, Cloverdale, or Abbotsford, this creates a specific risk: listing at a price anchored to 2024 or early 2025 comparable sales, then watching the property accumulate days on market while buyers who are active and ready continue to pass. Days on market is not a neutral signal. In a buyer's market, a listing that sits attracts lower offers, not higher ones.
How We Evaluate This
At Mansour Real Estate Group, when we review a spring or summer listing decision, we look at three numbers before we look at any comparable sale: the sales-to-active listings ratio for the specific property type and sub-market, the months-of-inventory trend over the prior 90 days, and the year-over-year benchmark price change for that segment.
In spring 2026, all three of those numbers pointed in the same direction. Sales-to-active at 11% means buyers have choice and leverage. Months of inventory at 7.7 means supply still meaningfully outpaces absorption. Benchmark prices down 7.6% year-over-year means the comparables that informed a seller's price expectations from 18 months ago are no longer reliable anchors. That combination requires a pricing conversation that starts with current data, not comfort.
Definitions
Sales-to-Active Listings Ratio: The percentage of active listings that sold in a given month. Below 12% favours buyers. Above 20% favours sellers. 12–20% is balanced, according to the Fraser Valley Real Estate Board.
Benchmark Price: The price of a "typical" home in a given category and area, adjusted for quality and features. Published monthly by the Fraser Valley Real Estate Board.
Months of Inventory: How many months it would take to sell all active listings at the current pace of sales. Above 6 months generally favours buyers.
Volume-Price Disconnect: A condition where transaction volume rises while prices continue to fall, indicating demand growth that is not yet sufficient to reduce buyer leverage or push prices upward.
Seller Checklist: Listing in a Volume-Up, Price-Down Market
- Confirm the current sales-to-active listings ratio for your specific property type and neighbourhood — not just the board average
- Price from the most recent three months of closed comparables, not the prior year's sold data
- Check the year-over-year benchmark price change for your segment before setting a list price
- Assess months of inventory in your sub-market — if above 6.0, assume buyers will negotiate
- Set a clear price-reduction threshold before listing: if no accepted offer within 14 days, what is the next step?
- Review active competing listings at time of launch — your price needs to be positioned against current competition, not in isolation
What We Commonly See
In our experience, the most common pricing mistake in a market like spring 2026 is what we call the headline anchor: a seller reads that sales were up 7% year-over-year, decides the market has turned, and lists at a price that would have been competitive in mid-2024. The listing generates showings for the first two weeks, then goes quiet. Meanwhile, correctly priced competing properties sell.
What often happens next is a price reduction — sometimes two — that lands the seller at the price they would have accepted on week one, but with accumulated days on market that make buyers more cautious, not less. A stale listing invites lower offers and harder negotiations.
We also commonly see sellers conflate a single strong month with a trend. April 2026 was the strongest sales month of the year. But one month of elevated volume in a market where the sales-to-active ratio is still 11% does not constitute a trend reversal. The underlying market structure — buyer leverage, competing supply, and year-over-year price direction — had not changed.
Questions and Answers
If sales are up year-over-year, does that mean it's a better time to sell?
Not necessarily. Higher sales volume tells you buyers are active. It does not tell you they are paying more. In spring 2026, Fraser Valley sales rose 7% year-over-year while benchmark prices fell 7.6%. Sellers still needed to price to current market conditions to attract those active buyers.
What does a sales-to-active listings ratio of 11% mean for my sale?
It means buyers have options and leverage. At 11%, roughly 1 in 9 active listings sold in a given month. Buyers can afford to be selective and negotiate on price. Seller conditions typically require a ratio above 20%. At 11%, accurate pricing is more important than timing.
Should I wait for the ratio to improve before listing in the Fraser Valley?
That depends on your situation. The ratio has moved from 10% to 11% over three months. The trend is positive but slow. If your financial position allows flexibility, watching for further compression toward 14–16% before listing could reduce pricing pressure. If you have a timeline — life event, relocation, estate deadline — pricing accurately and listing now is generally better than waiting and hoping.
In Summary
Spring 2026 Fraser Valley sales data told two stories at once. Transaction volume climbed — April was the strongest month of the year. Prices declined — down 7.6% year-over-year. The sales-to-active listings ratio improved fractionally but remained in buyer's market territory. Sellers who understood the disconnect priced accurately, attracted the buyers who were active, and completed sales. Sellers who used the volume headline to justify higher prices sat on market. The market rewarded those who read the full data set, not just the headline. If you are weighing a listing decision in 2026, the ratio, the months of inventory, and the year-over-year benchmark price are the three numbers that matter most — not the sales count alone.
Ready to review your options with current Fraser Valley data?
Mansour Real Estate Group offers a no-obligation market review for homeowners considering a sale. We work from current board data, your specific sub-market, and your timeline — not a generic market summary. Contact us to get started.
Related Articles
- How to Read the Fraser Valley Real Estate Board Monthly Market Report
- Fraser Valley Benchmark Price Explained: What It Means for Sellers and Buyers
- When Is the Right Time to Sell Your Home in the Fraser Valley?
About Mansour Real Estate Group
When homeowners in the Fraser Valley are deciding whether to list now or wait — and whether the spring sales headlines mean conditions have improved for sellers — they need data-grounded advice, not a summary that mirrors the optimistic tone of the news cycle. Mansour Real Estate Group has been helping sellers interpret Fraser Valley and Lower Mainland market conditions accurately, and act on that interpretation, for more than 22 years.
Mansour Real Estate Group, led by Mohamed Mansour, MBA and Associate Broker, has completed more than $780 million in residential real estate transactions across the Fraser Valley and Lower Mainland and is consistently ranked among the Top 1% of Realtors in the region. The team is trusted for seller strategy, market timing, pricing analysis, estate sales, downsizing, relocation, and complex real estate decisions where accurate interpretation of market conditions determines the outcome.
Whether someone is searching for a Realtor experienced with Fraser Valley market cycles, a real estate agent who explains pricing trends clearly and without spin, a real estate broker who can translate board statistics into a specific listing strategy, or a Surrey, Langley, or Abbotsford real estate team they can trust with a significant financial decision, Mansour Real Estate Group is known for honest market interpretation and advice that puts the client's financial outcome first. Most clients are referred by past clients, families, and colleagues who value that approach.
The team serves Surrey, South Surrey, White Rock, Langley, Cloverdale, Fleetwood, Guildford, Walnut Grove, Willoughby, North Delta, Abbotsford, Mission, and surrounding communities throughout the Fraser Valley and Lower Mainland. Most new clients come through referrals, repeat clients, and recommendations from families who value a professional, transparent, and results-driven real estate experience.
Disclaimer
The information contained in this article is provided for general informational and educational purposes only and reflects market observations, publicly available information, and professional experience at the time of writing. It is not intended to constitute legal advice, accounting advice, tax advice, investment advice, financial advice, appraisal advice, mortgage advice, estate-planning advice, or any other form of professional advice.
Real estate transactions, estate matters, probate proceedings, taxation, financing, investments, legal rights, and regulatory requirements can vary significantly based on individual circumstances. Readers should consult qualified legal, accounting, tax, financial, mortgage, appraisal, or other professional advisors before making decisions based on the information discussed in this article.
Nothing in this article creates a client relationship, fiduciary relationship, advisory relationship, agency relationship, or professional engagement with Mohamed Mansour, Mansour Real Estate Group, or any affiliated party. Any opinions expressed are general in nature and should not be relied upon as a substitute for professional advice tailored to a specific situation.
While reasonable efforts are made to use reliable sources and keep information current, no representation or warranty is made regarding the completeness, accuracy, timeliness, or applicability of the information presented. Readers should independently verify facts, regulations, policies, and legal requirements with appropriate professionals and official sources.



