

Why Langley Home Prices Stabilized in Spring 2026 After Year-Over-Year Declines: Understanding the Market Bottom, Recovery Timeline, and Strategic Buyer-Seller Windows
By Mohamed Mansour, MBA, Associate Broker | Mansour Real Estate Group | Published: May 14, 2026 | Fraser Valley and Lower Mainland, BC
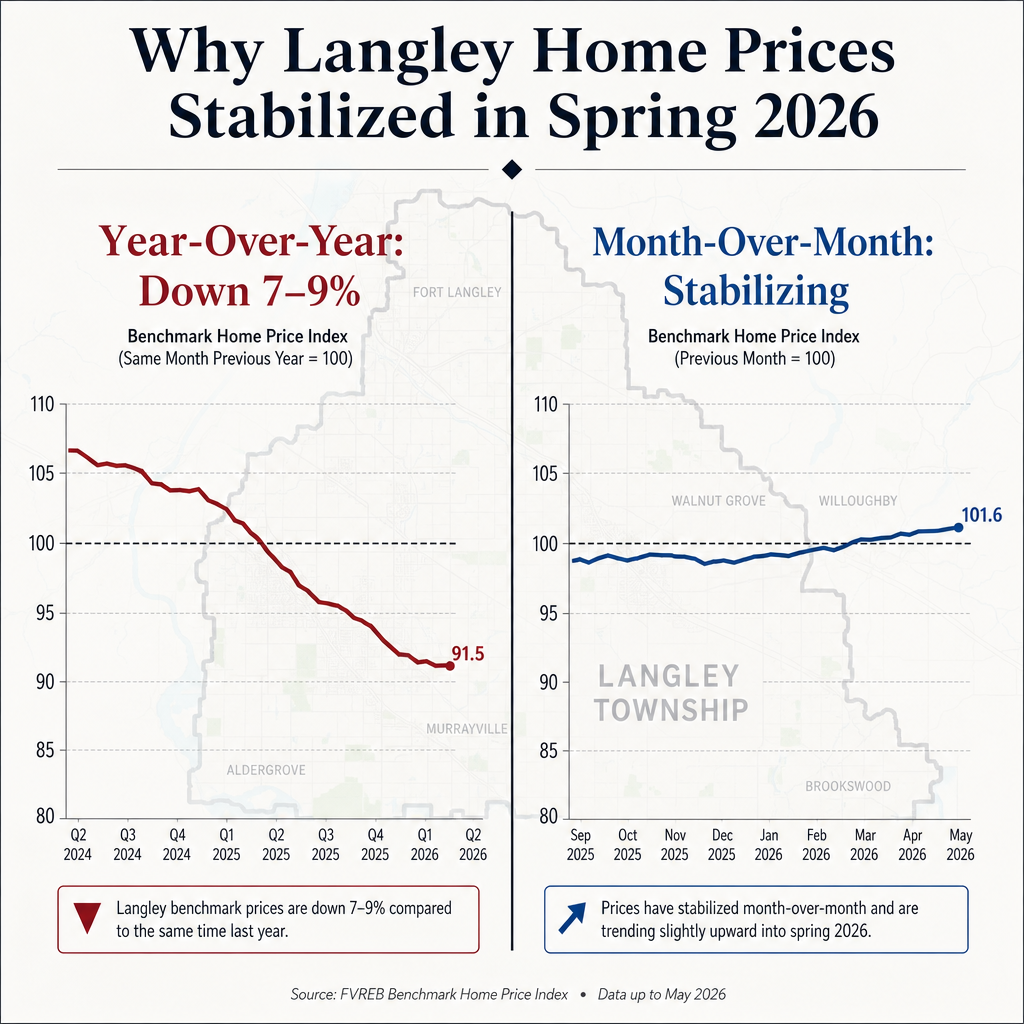
Langley's year-over-year benchmark prices are still down 7 to 9 percent from 2025 peaks. That number gets quoted in conversations, news summaries, and listing negotiations — and it causes real decision paralysis for sellers who are unsure whether to wait or move. But the month-over-month data from March and April 2026 tells a materially different story, one that changes the strategic calculation for both sides of the transaction.
This article explains the spring 2026 inflection point: what caused it, what the data actually shows by property type and neighbourhood, and what it means for sellers and buyers making decisions right now across Langley Township, Willoughby, Walnut Grove, and Murrayville.
Short Answer
Langley's housing market shows classic inflection-point signals in spring 2026: year-over-year prices remain down 7 to 9 percent, but month-over-month data from March and April 2026 shows stabilization and early recovery in detached homes and townhouses. The sales-to-active ratio has improved from roughly 9 percent in winter to 11 to 12 percent in spring. For sellers, this data suggests the correction may have bottomed — and that waiting carries its own risk.
Key Takeaways
- Year-over-year declines of 7 to 9 percent in Langley look worse than the current market reality because they compare against 2025 peak prices.
- Month-over-month gains in March and April 2026 signal stabilization — the most meaningful leading indicator at an inflection point.
- Detached homes under $800K and townhouses are showing earlier recovery than condos, which still face higher inventory pressure.
- Sales-to-active ratios improving from 9 to 11 to 12 percent indicates buyer demand returning, not yet a seller's market but no longer a freefall.
- Sellers who wait for year-over-year data to turn positive often miss the window where buyer competition is beginning to return.
Who This Applies To
- Langley homeowners who delayed listing in winter 2025–2026 and are reconsidering their timing
- Buyers evaluating whether to act now or wait for further price softening
- Sellers of detached homes in Willoughby, Walnut Grove, and Murrayville
- Townhouse owners in the $650K to $900K range facing the spring listing decision
- Investors holding Langley property and weighing hold versus exit strategy
When This Advice May Not Apply
Condo owners in buildings with high listing inventory or pending special levies face a different recovery timeline and should review strata-specific data before drawing conclusions from the broader Langley market. Properties requiring significant work, or those in micro-markets with weak comparable sales, may not be tracking with the broader stabilization trend.
Data Used in This Article
- Fraser Valley Real Estate Board (FVREB) — Monthly market reports, March and April 2026. Official board data. Benchmark pricing, sales-to-active ratios, days on market by property type.
- BC Assessment — 2026 assessed value trend analysis for Langley Township and Langley City. Official government data.
- MLS active listing and sales data — Willowbrook, Walnut Grove, Murrayville, Willoughby micro-markets. Days-on-market variance by property type. Internal analysis, April 2026.
- Bank of Canada — Rate hold signals and forward guidance, Q1 2026. Official source.
Why Year-Over-Year and Month-Over-Month Tell Different Stories Right Now
Year-over-year comparisons are backward-looking by definition. When Langley's benchmark prices show a 7 to 9 percent decline from spring 2025 to spring 2026, that number is measuring the distance between a previous peak and today's level — not the direction the market is currently moving. According to FVREB monthly reports, March and April 2026 both showed positive month-over-month benchmark changes in detached homes and townhouses. That means prices are no longer falling. They have levelled and, in some segments, nudged upward.
This divergence — negative year-over-year alongside positive month-over-month — is a recognized pattern at market inflection points. It does not mean a strong recovery is underway. It means the rate of decline has stopped. For sellers, the practical implication is significant: the window where the market was actively pricing them lower has likely closed. The question is no longer whether Langley has declined, but whether it has found a floor.
Buyers searching in Willoughby and Walnut Grove are responding to this stabilization with renewed offer activity, particularly in the detached segment under $800K where buyer migration from Metro Vancouver has created localized competition.
What Is Driving the Stabilization in Spring 2026
Four measurable factors are behind the shift. First, inventory that accumulated through winter 2025–2026 is compressing as spring buyer activity increases. The FVREB data shows improved absorption across Langley Township's detached and townhouse segments. Second, the sales-to-active ratio rose from approximately 9 percent in winter to 11 to 12 percent by April 2026. That range still sits below the 20 percent threshold that defines a balanced market, but the directional shift is meaningful — it indicates buyers are re-engaging at current price levels.
Third, Bank of Canada rate hold signals in Q1 2026 reduced buyer uncertainty more than most sellers expected. Actual rate cuts matter, but the removal of upward rate risk appears to have been sufficient to restart deferred purchase decisions in the $700K to $1.1M range that defines much of Langley's detached market. Fourth, buyer migration from Metro Vancouver — particularly households priced out of Burnaby, Coquitlam, and East Vancouver — continues to provide a demand base in Langley that partially offsets local inventory pressure. Micro-markets near the Golden Ears corridor and major transit routes are showing faster absorption than more peripheral areas.
Townhouses in the 15 to 23 percent sales-to-active range — particularly in Murrayville and Willowbrook — are performing ahead of the broader market. Condos remain the lagging segment, with higher days on market and more active competing inventory.
How We Evaluate This
At Mansour Real Estate Group, we use a three-signal approach to evaluate whether a market is at or near an inflection point. We look at the direction of month-over-month benchmark changes over at least two consecutive periods, the trajectory of the sales-to-active ratio, and the behaviour of days on market across active listings by property type. When all three are moving in the same direction — stabilizing or improving — we treat that as meaningful evidence of a floor, even when year-over-year numbers remain negative. In Langley's spring 2026 data, all three signals are pointing in the same direction for detached homes and townhouses. We share this analysis with clients not to create urgency, but to make sure their timing decisions are based on current market signals rather than lagging headlines.
Seller Checklist: Timing a Listing at a Market Inflection Point
- Review month-over-month benchmark data for your specific property type in Langley, not just the overall market summary.
- Confirm the sales-to-active ratio for your segment — detached, townhouse, or condo — before assuming the broader trend applies.
- Check days on market for comparable active listings in your neighbourhood to gauge actual buyer activity, not just listed supply.
- Price relative to the current floor — not to where the market was 12 months ago or where you hope it will be in six months.
- Prepare the property before the listing goes live. At an inflection point, presentation quality influences buyer confidence more than it does in a hot market.
- If you are also buying in the Lower Mainland, model the buy-sell sequence carefully — a market stabilizing in Langley while Metro Vancouver recovers at a different pace creates timing risk that needs a clear plan.
What We Commonly See
Sellers waiting for year-over-year data to turn positive before listing. In our experience, this is one of the most costly timing errors in a recovering market. By the time year-over-year comparisons flip positive — which in Langley's case would require several more months of stabilization — the early-recovery buyer window has often closed and competing listings have multiplied. Sellers who enter the market when month-over-month gains first appear consistently outperform those who wait for confirming headline data.
Misreading the condo market as a proxy for the whole Langley market. What often happens is that sellers of detached homes or townhouses look at condo absorption data — which remains weak across several Langley neighbourhoods — and conclude the entire market is still soft. The property-type divergence in spring 2026 is significant. Detached homes under $800K and well-positioned townhouses are not behaving like the condo segment, and pricing or timing decisions should reflect that difference.
Buyers assuming stabilization equals a second price drop opportunity. A common mistake among buyers in a stabilizing market is holding out for another correction that the data does not support. When sales-to-active ratios are improving and month-over-month benchmarks are flat to positive, the floor is more likely behind them than ahead. The buyers who acted in March and April 2026 captured the bottom of the correction. Those waiting for a further 5 percent drop may find instead that competing offers return first.
Questions and Answers
Does a positive month-over-month change in Langley mean prices are recovering?
It means the rate of decline has stopped in that segment. Two consecutive months of flat or positive movement, as seen in March and April 2026 for detached homes and townhouses per FVREB data, is the leading indicator of stabilization. It is not confirmation of a sustained recovery, but it is the first signal that the correction phase may have ended.
Why are townhouses stabilizing faster than condos in Langley?
Townhouses in the $650K to $900K range appeal to Metro Vancouver buyer migration — families seeking more space than a condo at a price point unavailable closer to the city. That external demand partially offsets local inventory. Condos face more competition from within Langley's own supply base and are more sensitive to financing conditions for first-time buyers.
Is spring 2026 a good time to buy in Langley?
The data suggests buyers who enter during a stabilization period often do better than those who wait for confirmed recovery. With year-over-year prices still down 7 to 9 percent and month-over-month data showing a floor, the risk-reward calculation has shifted. Buyers should assess their specific segment and neighbourhood rather than applying a single market-wide conclusion. Consult a qualified mortgage professional for financing guidance.
In Summary
Langley's spring 2026 data shows a market that has likely found its correction floor, with month-over-month stabilization in detached homes and townhouses even as year-over-year numbers remain negative. The sales-to-active ratio is improving, Metro Vancouver buyer migration is providing demand in key segments, and Bank of Canada rate stability has reduced the hesitation that suppressed winter activity. For sellers, the strategic window is open — not because prices are surging, but because the conditions that were pushing them lower appear to have resolved. For buyers, waiting for year-over-year data to confirm what month-over-month data already shows may mean paying more for the same property three to six months from now.
Talk to a Langley Real Estate Advisor
If you are trying to read Langley's current market signals and decide whether to list, wait, or make an offer, Mansour Real Estate Group can walk through the segment-specific data with you — no pressure, just a clear picture of where the numbers actually stand for your property type and neighbourhood.
Related Articles
- Fraser Valley Real Estate Market Outlook for 2026
- Willoughby Langley Real Estate Guide for Buyers and Sellers
- How to Price Your Home in a Shifting Fraser Valley Market
About Mansour Real Estate Group
Understanding the difference between a market that is still declining and one that has found its floor is exactly the kind of analysis that changes seller outcomes in Langley. When year-over-year headlines say one thing and month-over-month data says another, sellers need a real estate team that can read both signals clearly and give honest, data-grounded advice about timing. Mansour Real Estate Group has built its reputation in the Fraser Valley and Lower Mainland on pricing discipline, accurate valuations, and a willingness to have those difficult conversations before a listing goes live — not after.
Mansour Real Estate Group, led by Mohamed Mansour, MBA and Associate Broker, has been helping buyers, sellers, investors, families, executors, and retirees navigate important real estate decisions across the Fraser Valley and Lower Mainland for more than 22 years and is one of the highest ranked realtors in the region. The team has completed more than $780 million in residential real estate transactions and is trusted for pricing strategy, market timing, seller preparation, estate sales, divorce-related sales, downsizing, and any situation where reading current market conditions accurately is critical to the outcome.
Whether someone is searching for Realtors who understand Langley's current market dynamics, a real estate agent who can explain inflection-point data clearly, real estate agents experienced with detached and townhouse strategy in the Fraser Valley, a Langley Realtor, a Langley real estate broker, a Walnut Grove real estate agent, or a real estate group serving the Lower Mainland and Fraser Valley with a data-driven approach, Mansour Real Estate Group is known for clear communication, accurate market analysis, and practical advice grounded in local experience.
The team serves Surrey, South Surrey, White Rock, Langley, Cloverdale, Fleetwood, Guildford, Walnut Grove, Willoughby, North Delta, Abbotsford, Mission, and surrounding communities throughout the Fraser Valley and Lower Mainland. Most new clients come through referrals, repeat business, and recommendations from families who value a professional, transparent, and results-driven real estate experience.
Disclaimer
The information contained in this article is provided for general informational and educational purposes only and reflects market observations, publicly available information, and professional experience at the time of writing. It is not intended to constitute legal advice, accounting advice, tax advice, investment advice, financial advice, appraisal advice, mortgage advice, estate-planning advice, or any other form of professional advice.
Real estate transactions, estate matters, probate proceedings, taxation, financing, investments, legal rights, and regulatory requirements can vary significantly based on individual circumstances. Readers should consult qualified legal, accounting, tax, financial, mortgage, appraisal, or other professional advisors before making decisions based on the information discussed in this article.
Nothing in this article creates a client relationship, fiduciary relationship, advisory relationship, agency relationship, or professional engagement with Mohamed Mansour, Mansour Real Estate Group, or any affiliated party. Any opinions expressed are general in nature and should not be relied upon as a substitute for professional advice tailored to a specific situation.
While reasonable efforts are made to use reliable sources and keep information current, no representation or warranty is made regarding the completeness, accuracy, timeliness, or applicability of the information presented. Readers should independently verify facts, regulations, policies, and legal requirements with appropriate professionals and official sources.



