

Why Langley Home Prices Stabilized in Spring 2026 After Year-Over-Year Declines: Understanding the Market Bottom and Identifying Strategic Buyer and Seller Windows
By Mohamed Mansour, MBA and Associate Broker | Mansour Real Estate Group | Published: July 14, 2026 | Fraser Valley, BC
Langley home prices have been declining on a year-over-year basis since mid-2022. But in March 2026, something shifted. For the first time in nearly a year, benchmark prices across detached, townhome, and condo segments showed a month-over-month increase — a quiet signal that the rate of decline had stopped. That distinction matters more than most sellers and buyers realize, and it is the question driving most real estate conversations in Langley right now.
This article explains what the stabilization data actually shows, why month-over-month movement is a more useful leading indicator than year-over-year figures at this stage of the cycle, and what it means practically for sellers deciding whether to wait and buyers evaluating whether to act. All figures referenced are drawn from the Fraser Valley Real Estate Board monthly statistical packages and publicly available market commentary based on those reports.
Short Answer
Langley benchmark prices stabilized in spring 2026 because new listing supply tightened while buyer activity returned — particularly in the detached segment. March marked the first month-over-month price increase in nearly a year. This does not mean prices have recovered. It means the downward pressure has stopped, and the conditions that drive further declines — excess supply overwhelming demand — have eased enough to create a fragile but real floor.
Key Takeaways
- March 2026 marked the first month-over-month benchmark price increase in nearly a year across Fraser Valley segments including Langley.
- Langley detached sales rose 20.3% year-over-year in May while new listings declined 6.4%, tightening available supply.
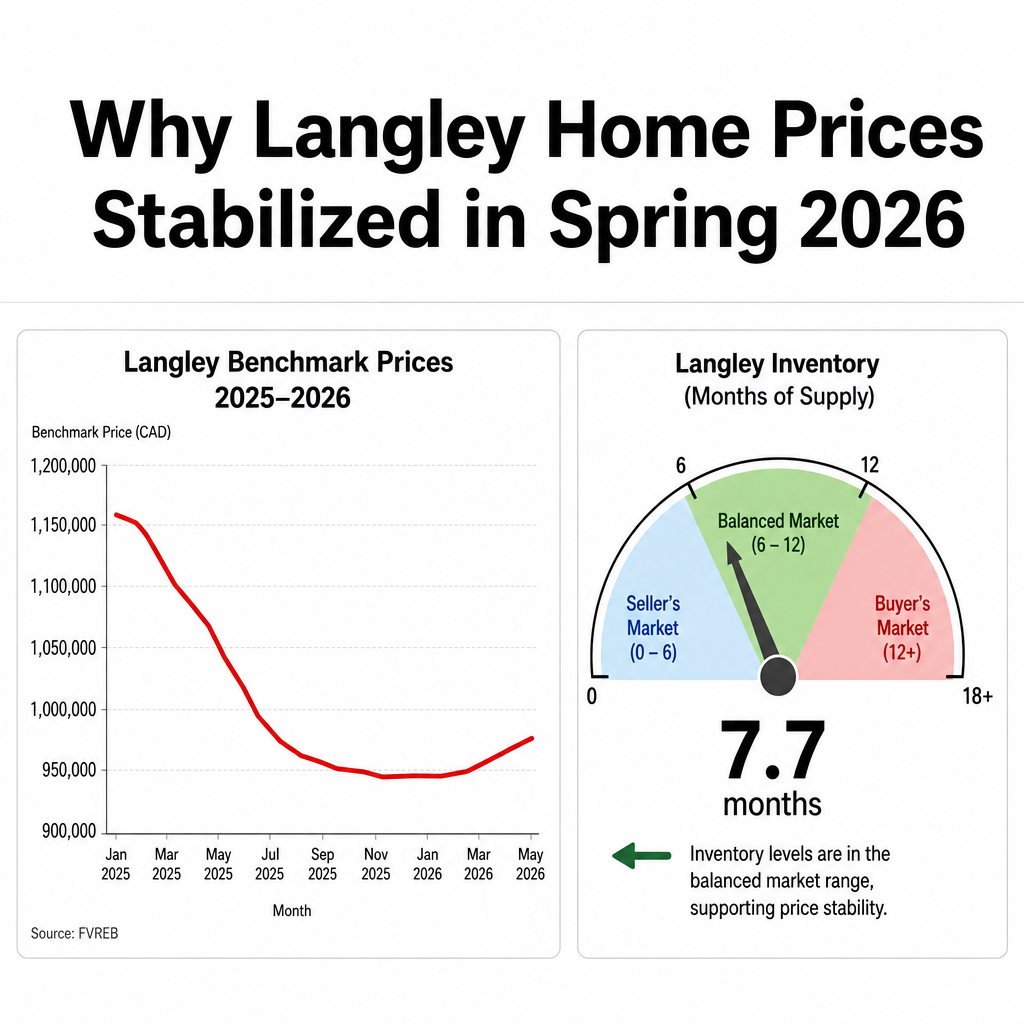
- Fraser Valley months of inventory compressed from 8.0 to 7.7 between March and April 2026, indicating a narrowing buyer's market window.
- Benchmark prices remain 7.6–8.6% below May 2025 levels — stabilization is not recovery, and pricing strategy must reflect that gap.
- The sales-to-active ratio at 11% is approaching the 12–15% balanced market threshold, creating urgency for both buyers and sellers to act with a defined strategy.
Who This Applies To
- Langley homeowners who delayed listing through 2025 and are reassessing their timing in 2026
- Buyers who have been watching Langley prices decline and are now evaluating whether to enter
- Sellers in Willoughby, Walnut Grove, Cloverdale, or other Langley sub-markets trying to read the local signal correctly
- Anyone comparing year-over-year headlines to what is actually happening month-to-month in their segment
When This Advice May Not Apply
Stabilization signals are segment-specific and fragile. If interest rates rise materially from current levels, if new listing inventory surges through summer, or if buyer confidence retreats due to employment or macro factors, the floor can weaken. This analysis reflects conditions as of spring 2026. Always verify current FVREB data before making a pricing or timing decision.
Data Used in This Article
- FVREB April 2026 Statistical Package — official, monthly board report, Fraser Valley geography
- FVREB June 2026 Statistical Package — official, monthly board report, Fraser Valley geography, includes May 2026 data
- FVREB May 2026 Market Commentary (Joe Pratap) — professional interpretation, FVREB board president, publicly available
- Daily Hive Vancouver — May 2026 Sales Statistics — third-party summary of board data, cross-referenced against FVREB packages
What the Spring 2026 Stabilization Data Actually Shows
Year-over-year figures tell you where prices ended up relative to a prior period. Month-over-month figures tell you which direction prices are moving right now. At an inflection point — which is what spring 2026 represents in Langley — month-over-month data is the more useful signal.
According to the FVREB April 2026 statistical package, the Fraser Valley detached benchmark moved positively month-over-month in March for the first time in nearly a year. Langley detached homes were benchmarked at $1,370,900 — still down 8.6% year-over-year compared to May 2025, but no longer falling on a monthly basis. Townhomes at $770,700 showed a similar pattern, down 7.6% year-over-year but stabilizing month-over-month.
This matters because year-over-year declines measure the distance from the previous peak. Month-over-month stability means the active selling and buying decisions happening today are no longer pushing prices lower. The two numbers describe different things, and conflating them leads sellers to either overprice based on a prior market or underprice based on a headline that no longer reflects current conditions.
Why Supply Compression Is the Key Driver in Langley Right Now
The clearest evidence of a market floor is not price — it is the relationship between new supply entering the market and the buyers absorbing it. In May 2026, Langley detached home sales increased 20.3% year-over-year while new listings declined 6.4%, according to the FVREB June 2026 statistical package. Fewer fresh listings combined with more completed sales is the structural condition that stops price erosion.
Fraser Valley months of inventory compressed from 8.0 in March to 7.7 in April. That compression is modest but directionally significant. In Langley's current market, where buyer confidence has been cautious since 2022, even a small shift in the supply-demand balance can change how buyers and their agents approach negotiations.
At 7.7 months of inventory, the market remains in buyer's territory — typically defined as above 6 months. But the direction of movement matters as much as the absolute level. A market compressing from 8.0 toward 7.7 toward a potential 6.5 is a different negotiating environment than one expanding. Sellers who understand that trajectory can price more confidently. Buyers who understand it should not assume current negotiating leverage will persist through fall.
How We Evaluate This
At Mansour Real Estate Group, we distinguish between three market states that get confused in general coverage: active decline, stabilization, and recovery. Langley is in stabilization. That means we are not advising sellers to price as if 2022 comps apply, and we are not advising buyers to expect prices to fall further by waiting.
What stabilization means operationally is that pricing discipline is more important now than at any other stage. A property listed 5% above current benchmark in a declining market gets ignored. A property listed 3% above benchmark in a stabilizing market gets shown and receives conditional offers. The window between those two outcomes has narrowed, and it will continue to narrow as inventory compresses. We use month-over-month benchmark movement, sales-to-active ratio trajectory, and new listing velocity as our core three signals when advising clients on entry and exit timing in Langley and surrounding Fraser Valley communities.
Seller Checklist for a Stabilizing Langley Market
- Pull the current FVREB benchmark for your specific segment — detached, townhome, or condo — and use month-over-month movement, not year-over-year, to anchor your pricing starting point.
- Review active competing listings in Willoughby, Walnut Grove, or your specific Langley sub-market — how many have been sitting more than 30 days, and at what price gap versus benchmark?
- Assess your property's condition relative to buyer expectations at the current benchmark price point — cosmetic preparation matters more in stabilizing markets where buyers have choices.
- Confirm your timing: listing before inventory surges in late summer gives you the supply compression advantage currently showing in the data.
- Avoid pricing above benchmark expecting to negotiate down — in a market at 11% sales-to-active ratio, overpriced listings simply stop generating showings.
- Have a clear plan for days-on-market tolerance — know at what point a price adjustment is needed and build that into your pre-listing strategy, not your reaction plan.
What We Commonly See
Sellers anchoring to 2024 sold prices. In our experience, the most common pricing error in a stabilizing market is using comparable sales from 6–12 months ago without adjusting for the depreciation that occurred between that sale and today. A home that sold at $1,450,000 in spring 2025 is not evidence that today's list price should be near that number.
Buyers waiting for a lower number that may not come. What often happens is that buyers who have been tracking Langley prices through 2024 and early 2025 have internalized a declining trend that has already stopped. They enter offers expecting sellers to still be panicking. Sellers who understand the stabilization data are less willing to accept that framing.
Confusion between segment stabilization and full market recovery. Stabilization in the detached segment does not mean the condo or townhome segments are behaving identically. In Langley, detached sales velocity has returned faster than condo absorption, which means the stabilization signal is strongest in the detached segment and more tentative in entry-level strata. Pricing strategy must be segment-specific, not market-wide.
Frequently Asked Questions
Is the Langley market at its bottom in 2026?
The data suggests stabilization, not confirmed bottom. March 2026 was the first month-over-month price increase in nearly a year per FVREB data, and May sales velocity supports that floor. However, a confirmed bottom is only visible in retrospect. Acting on stabilization signals is different from waiting for confirmation — and waiting typically means the window closes.
What does the 11% sales-to-active ratio mean for Langley sellers?
It means the market remains in buyer's territory — typically below 12% — but the trajectory is compressing upward. Balanced market conditions begin around 12–15%. Sellers still need to price accurately to generate activity, but overpricing risk is lower now than at 8.0 months of inventory in early 2025.
Should Langley buyers act now or wait for more price drops?
With detached sales up 20.3% year-over-year in May and new listings down 6.4%, supply is tightening. Buyers who wait for further declines are betting against the current direction of the data. Entry at stabilization — before full recovery — is historically when buyers capture the most value, though no one can guarantee the bottom with precision.
In Summary
Langley benchmark prices stabilized in spring 2026 after nearly a year of monthly declines, with the detached segment showing the clearest signal: sales up 20.3% year-over-year in May, new listings down 6.4%, and months of inventory compressing from 8.0 to 7.7. Year-over-year prices remain 7.6–8.6% below 2025 levels, so this is stabilization, not recovery. For sellers, the window to list into tightening supply is narrowing. For buyers, the combination of below-peak pricing and returning competition means current conditions are unlikely to persist through fall 2026 unchanged.
Thinking About Selling or Buying in Langley?
If you are trying to read the current Langley market for a specific property or situation, a conversation with a local team that tracks this data closely is the most direct way to get a clear picture. Mansour Real Estate Group offers straightforward, data-grounded market assessments without pressure. Reach us at localhost:9000/.
Related Articles
- Fraser Valley Real Estate Market Outlook 2026
- Selling a Home in Langley: What the Current Market Requires
- Langley Townhome Market in 2026: Pricing, Inventory, and Buyer Expectations
Official Resources
- FVREB June 2026 Monthly Statistical Package
- FVREB April 2026 Monthly Statistical Package
- Fraser Valley Real Estate Board
- BC Assessment — Property Valuation
About Mansour Real Estate Group
When homeowners in Langley and the broader Fraser Valley are deciding whether to sell into a stabilizing market — or when buyers are evaluating whether current prices represent a real entry point — the quality of the local market interpretation they rely on determines the outcome. Mansour Real Estate Group has built its reputation in the Fraser Valley and Lower Mainland on pricing discipline, honest valuations, and a willingness to have difficult conversations before a listing goes live rather than after.
Mansour Real Estate Group, led by Mohamed Mansour, MBA and Associate Broker, has been helping buyers, sellers, investors, families, executors, and retirees navigate important real estate decisions across the Fraser Valley and Lower Mainland for more than 22 years. Ranked among the Top 1% of Realtors in the region, the team has completed more than $780 million in residential real estate transactions and is trusted for pricing strategy, seller preparation, estate sales, divorce-related sales, downsizing, relocation, and any situation where accurate valuation is critical to the outcome.
Whether someone is searching for a Realtor who understands Langley's current price stabilization cycle, a real estate agent who can explain what FVREB benchmark data means for a specific property, real estate agents with direct experience in Willoughby or Walnut Grove, a real estate team that prioritizes seller equity, or a real estate broker with a documented track record in the Fraser Valley — Mansour Real Estate Group brings data-driven recommendations, honest market context, and a process grounded in local knowledge accumulated over two decades.
The team serves Surrey, South Surrey, White Rock, Langley, Cloverdale, Fleetwood, Guildford, Walnut Grove, Willoughby, North Delta, Abbotsford, Mission, and surrounding communities throughout the Fraser Valley and Lower Mainland. Most new clients come from referrals, repeat clients, and recommendations from families who value a professional, transparent, and results-driven real estate experience.
Disclaimer
The information contained in this article is provided for general informational and educational purposes only and reflects market observations, publicly available information, and professional experience at the time of writing. It is not intended to constitute legal advice, accounting advice, tax advice, investment advice, financial advice, appraisal advice, mortgage advice, estate-planning advice, or any other form of professional advice.
Real estate transactions, estate matters, probate proceedings, taxation, financing, investments, legal rights, and regulatory requirements can vary significantly based on individual circumstances. Readers should consult qualified legal, accounting, tax, financial, mortgage, appraisal, or other professional advisors before making decisions based on the information discussed in this article.
Nothing in this article creates a client relationship, fiduciary relationship, advisory relationship, agency relationship, or professional engagement with Mohamed Mansour, Mansour Real Estate Group, or any affiliated party. Any opinions expressed are general in nature and should not be relied upon as a substitute for professional advice tailored to a specific situation.
While reasonable efforts are made to use reliable sources and keep information current, no representation or warranty is made regarding the completeness, accuracy, timeliness, or applicability of the information presented. Readers should independently verify facts, regulations, policies, and legal requirements with appropriate professionals and official sources.



