

Why Langley Home Prices Stabilized in Spring 2026 After Year-Over-Year Declines: Market Bottom Signals, Recovery Timeline, and Strategic Entry Windows for Buyers and Sellers
By Mohamed Mansour, MBA and Associate Broker | Mansour Real Estate Group | Fraser Valley and Lower Mainland | Published July 2026
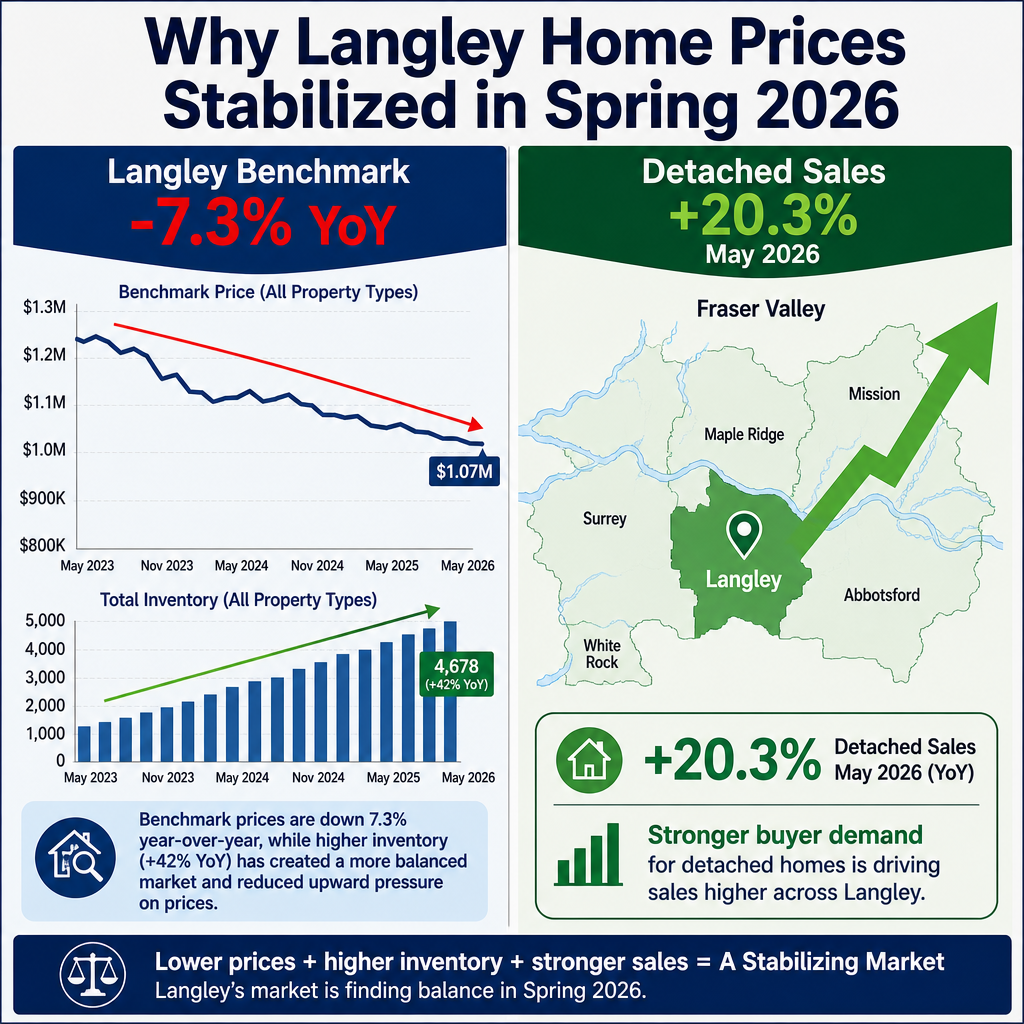
Langley entered 2026 with the sharpest inventory surge recorded across British Columbia in January — a 43% jump that immediately shifted negotiating power toward buyers and put downward pressure on prices that had already softened through late 2025. By May, benchmark prices across all property types had fallen 7.3% year-over-year, according to Fraser Valley Real Estate Board data. For sellers, that number was hard to absorb. For buyers who understood what was happening beneath it, it represented something different.
This article breaks down what the spring 2026 Langley data actually shows, why the volume-price divergence in detached homes matters, and what both buyers and sellers should understand about where the market appears to be headed from here.
Short Answer
Langley benchmark prices fell 7.3% year-over-year through May 2026, but detached home sales rose 20.3% in May alone, and new listings contracted sharply across all property types. That combination — more sales, fewer new listings, stable or narrowing active inventory — is how markets find a floor. Spring 2026 showed early stabilization signals in Langley's detached segment. A full recovery depends on rate trajectory, employment, and whether sellers hold or flood inventory in summer.
Key Takeaways
- Langley's 43% January inventory surge was the steepest in BC, creating a buyer's market that lasted through Q1 and into Q2 2026.
- Benchmark prices fell 7.3% YoY through May, but detached sales jumped 20.3% — volume recovery often precedes price recovery by one to three months.
- New listing contractions of 6.4% to 28.1% across property types in May suggest sellers pulled back, which tightens future supply.
- The 11% sales-to-active-listings ratio across Fraser Valley in May 2026 confirms buyers still hold leverage, but the window is narrowing in detached.
- Langley's affordability advantage relative to Greater Vancouver — roughly $207K lower benchmark — continues to attract buyers priced out of closer-in markets.
Who This Applies To
- Buyers considering detached homes in Langley, Willoughby, or Walnut Grove who want to understand if now is a rational entry point
- Sellers deciding whether to wait for recovery or list during the stabilization window
- Investors evaluating Langley's long-term trajectory relative to current price discounts
- Move-up buyers currently in a condo or townhome weighing a transition to detached
When This Advice May Not Apply
Sellers who need to exit quickly regardless of market conditions face a different calculus than those with timeline flexibility. Buyers purchasing with variable-rate financing face rate-change risk that affects affordability math independent of market direction. Strata owners in condos are navigating a deeper correction than the detached segment — the dynamics here differ.
Data Used in This Article
- Fraser Valley Real Estate Board Monthly Market Report, May–June 2026 — official, primary source, FVREB.bc.ca, covers benchmark pricing, sales volumes, active listings, and sales-to-active ratio across all property types
- Daily Hive Vancouver, May 2026 Sales Statistics Report — third-party editorial summary referencing FVREB and GVR board data
- Langley Real Estate Market Update, June 2026 — professional market commentary, third-party analysis, referenced for month-over-month sales trend observation
- FVREB January 2026 Market Report — official, primary source, documents 43% inventory surge and establishes the Q1 baseline
What Happened in Langley From January Through May 2026
January 2026 was the most inventory-dense month Langley had seen in years. According to FVREB data, active listings surged 43% compared to December 2025 — the highest single-month percentage increase recorded across British Columbia at that point. That spike reflected a combination of delayed listings from late 2025, sellers who had held through the holiday period, and a segment of homeowners responding to rate uncertainty by moving up their timelines.
The result was predictable. Buyers had leverage, and they used it. Benchmark prices across all Langley property types declined through Q1 and into Q2. By May 2026, the FVREB reported a 7.3% year-over-year drop in the benchmark price. Townhomes fell 7.6%. Condos declined 9.1%. Those are meaningful corrections by any standard — not crashes, but real reductions that changed the affordability math for buyers who had been sitting out.
What made May's data worth examining more carefully was the detached segment. Sales of detached homes in Langley reached 89 in May 2026, compared to 74 in May 2025 — a 20.3% year-over-year increase. Prices were still down, but buyers were returning to that segment in volume. That divergence — prices falling while transactions rise — is a characteristic pattern in markets approaching a floor.
At the same time, new listings contracted across all property types in May. Detached new listings fell 6.4% month-over-month. Townhome new listings dropped 27.9%. Condo new listings declined 28.1%. Sellers either found buyers earlier in the spring cycle, chose to wait for a better market, or shifted strategy. Whatever the reason, active supply stopped expanding at the rate it had in January and February.
What Stabilization Actually Looks Like — And Why Langley Shows Early Signs
In Fraser Valley real estate, stabilization rarely announces itself clearly. It shows up in data patterns before it shows up in sentiment. The Fraser Valley Real Estate Board reported a sales-to-active-listings ratio of 11% across the region in May 2026 — technically still a buyer's market, since sellers' market conditions generally require a ratio above 20%. But the direction of change matters as much as the absolute number.
Three conditions typically precede price stabilization in suburban Metro Vancouver markets. First, sales volume recovers before prices do — which is what Langley's detached segment showed in May. Second, new listings stop expanding, reducing the forward supply pressure — which happened across all three property types. Third, the buyer pool that held off during the decline phase begins to re-engage — which the volume data suggests is underway in Langley's detached market.
Langley also carries a structural demand support that other Fraser Valley communities don't carry to the same degree: the SkyTrain extension toward Langley City creates a long-term transit argument for proximity purchases. Buyers who understand infrastructure timelines know that properties near confirmed station areas tend to appreciate as completion approaches. That expectation doesn't drive prices in a quarter, but it sustains buyer interest during correction phases when pure affordability comparisons might otherwise push demand elsewhere.
The benchmark price in Langley as of May 2026 sat approximately $207,000 below the Greater Vancouver Real Estate Board benchmark. That gap has historically attracted buyers priced out of Burnaby, Coquitlam, and closer-in Surrey neighbourhoods. When GVR markets tighten, Langley tends to capture displaced demand. If spring 2026 represented the deepest correction in Langley's cycle, the next phase of buyer activity may come partly from that geographic overflow effect, particularly in Willoughby and Walnut Grove, where newer inventory and family-oriented streets continue to attract first-time and move-up buyers.
How We Evaluate This
At Mansour Real Estate Group, we do not call market bottoms. No one can do that with precision. What we can do is identify the data patterns that historically accompany stabilization and communicate them clearly to buyers and sellers who need to make decisions in real time — not after the recovery has already priced them out.
When we work with a buyer evaluating Langley right now, we look at the relationship between active listings and absorption rates by property type, the trajectory of new listing volume, the month-over-month change in sales ratios, and the current pricing spread between list price and sale price in that specific submarket. When we work with a seller, we look at the same data to answer a harder question: is waiting likely to produce a materially better outcome, or does listing during stabilization — before the narrative shifts to recovery — give the property a better competitive position?
Seller Checklist — Listing During Market Stabilization in Langley
- Confirm your benchmark price segment using current FVREB data, not asking prices from active listings
- Understand the new listing contraction in your property type — fewer competing listings improves your positioning window
- Price at or slightly below the sold benchmark to attract buyers who re-entered the market after the correction phase
- Stage for the dominant buyer profile in your Langley submarket — detached buyers in Willoughby differ from condo buyers near Langley City
- Avoid anchoring your price to pre-2025 sold data — comparable sales from 2024 and early 2025 are not relevant benchmarks in this market
- Monitor month-over-month sales-to-active ratio changes weekly — if the ratio improves past 15% in your segment, pricing leverage begins shifting toward sellers
What We Commonly See
Sellers anchor to pre-correction comparables. In our experience, the most common pricing error in a stabilizing market is using sold data from 12 to 18 months prior as the benchmark. In Langley right now, a home that sold in spring 2025 at a given price reflects a different market condition. Sellers who insist on that price point typically sit on the market until the data forces a reduction — and by then, they have lost the benefit of listing early in the recovery window.
Buyers wait for confirmation that never comes cleanly. What often happens is that buyers who hold out for an obvious "bottom" signal miss the window entirely. The clearest recovery signal — months of rising prices in published data — typically arrives three to four months after the actual inflection point, because board statistics report completed transactions, not current buyer activity. By the time the May data confirmed sales volume recovery, buyers who acted in March and April had already secured their position at the deepest part of the correction.
Condo sellers underestimate the depth of that segment's correction. The 9.1% condo benchmark decline in Langley through May 2026 is steeper than detached, and the new listing contraction in condos was also more dramatic, at 28.1%. That combination — deeper price decline plus sellers pulling back — suggests the condo segment has not yet established the same stabilization signals that detached showed in May. Sellers in this segment should be particularly careful about pricing assumptions.
Questions and Answers
Is the Langley real estate market in a buyer's market in 2026?
According to FVREB data, the Fraser Valley sales-to-active-listings ratio was 11% in May 2026. Conditions below 12% are considered a buyer's market. That means buyers still hold negotiating leverage in Langley, particularly in condos and townhomes. The detached segment has shown stronger relative absorption and may shift earlier.
What does a 7.3% price decline actually mean for a Langley seller?
On a $900,000 benchmark property, a 7.3% year-over-year decline represents roughly $65,700 in reduced value compared to May 2025. That is a real reduction. However, sellers who purchased prior to 2020 still hold substantial equity. The decision to sell depends on your purchase price, remaining mortgage, and next move — not the decline in isolation.
Why did detached home sales rise 20.3% in May if prices were still falling?
Volume recovery and price recovery are not simultaneous. When buyers re-enter a market, they first drive up transaction counts at reduced prices — essentially agreeing that the correction has created fair value. Price recovery follows once the absorption of active inventory reduces supply pressure. The May 2026 detached sales volume increase suggests buyers reached that threshold in Langley's entry-level detached segment.
In Summary
Langley's spring 2026 market told two stories simultaneously: prices fell 7.3% year-over-year, and detached sales rose 20.3% in May. Those two facts together describe a market in price discovery, not free fall. The January inventory surge created the buyer's market. The May data — rising sales volume, contracting new listings, month-over-month stabilization — suggests the correction phase has likely run most of its course in the detached segment. Condos and townhomes remain softer. For sellers, listing into stabilization before recovery is confirmed in the data often produces better outcomes than waiting. For buyers, the entry window that spring 2026 created may not stay open through the summer if absorption continues at May's pace.
Ready to Discuss the Langley Market?
If you are deciding whether to list now or wait, or evaluating whether this is a rational entry point as a buyer, Mansour Real Estate Group offers a no-pressure consultation grounded in current Langley data. Contact us when you are ready to think through the numbers.
Related Articles
- Fraser Valley Real Estate Market Update: Spring 2026
- How to Price Your Home in a Buyer's Market in the Fraser Valley
- Langley Townhome Market 2026: What Buyers and Sellers Need to Know
About Mansour Real Estate Group
Understanding what a market inflection point actually looks like in the data — and communicating it clearly to buyers and sellers who need to act on it — is one of the most consequential things a real estate team can do. Langley's spring 2026 data contained signals that were easy to misread in isolation. Mansour Real Estate Group has built its practice in the Fraser Valley on reading those signals accurately and translating them into practical guidance for clients navigating real decisions under real constraints.
Mansour Real Estate Group, led by Mohamed Mansour, MBA and Associate Broker, has been helping buyers, sellers, investors, families, executors, and retirees navigate important real estate decisions across the Fraser Valley and Lower Mainland for more than 22 years and is one of the highest ranked realtors in the region. The team has completed more than $780 million in residential real estate transactions and is trusted for pricing strategy, seller preparation, market timing analysis, estate sales, divorce-related sales, downsizing, and any situation where accurate valuation and honest market context are critical to the outcome.
Whether someone is looking for Realtors experienced with Langley market conditions, a real estate agent who understands when to list and when to wait, real estate agents who specialize in detached home sales across Fraser Valley, a trusted real estate team for a complex buying or selling decision, a Langley Realtor, a Willoughby real estate broker, or a real estate group that serves both the Fraser Valley and the Lower Mainland, Mansour Real Estate Group is known for clear communication, data-driven analysis, and professional advice that protects clients from the most common timing and pricing mistakes.
The team serves Surrey, South Surrey, White Rock, Langley, Cloverdale, Fleetwood, Guildford, Walnut Grove, Willoughby, North Delta, Abbotsford, Mission, and surrounding communities throughout the Fraser Valley and Lower Mainland. Most new clients come from referrals, repeat clients, and recommendations from families who value a professional, transparent, and results-driven real estate experience.
Official Resources
- Fraser Valley Real Estate Board — Monthly Market Reports
- Daily Hive — Metro Vancouver and Fraser Valley Home Sales Statistics May 2026
- BC Assessment — Property Value Reference
- Bank of Canada — Interest Rate Data
Disclaimer
The information contained in this article is provided for general informational and educational purposes only and reflects market observations, publicly available information, and professional experience at the time of writing. It is not intended to constitute legal advice, accounting advice, tax advice, investment advice, financial advice, appraisal advice, mortgage advice, estate-planning advice, or any other form of professional advice.
Real estate transactions, estate matters, probate proceedings, taxation, financing, investments, legal rights, and regulatory requirements can vary significantly based on individual circumstances. Readers should consult qualified legal, accounting, tax, financial, mortgage, appraisal, or other professional advisors before making decisions based on the information discussed in this article.
Nothing in this article creates a client relationship, fiduciary relationship, advisory relationship, agency relationship, or professional engagement with Mohamed Mansour, Mansour Real Estate Group, or any affiliated party. Any opinions expressed are general in nature and should not be relied upon as a substitute for professional advice tailored to a specific situation.
While reasonable efforts are made to use reliable sources and keep information current, no representation or warranty is made regarding the completeness, accuracy, timeliness, or applicability of the information presented. Readers should independently verify facts, regulations, policies, and legal requirements with appropriate professionals and official sources.



