
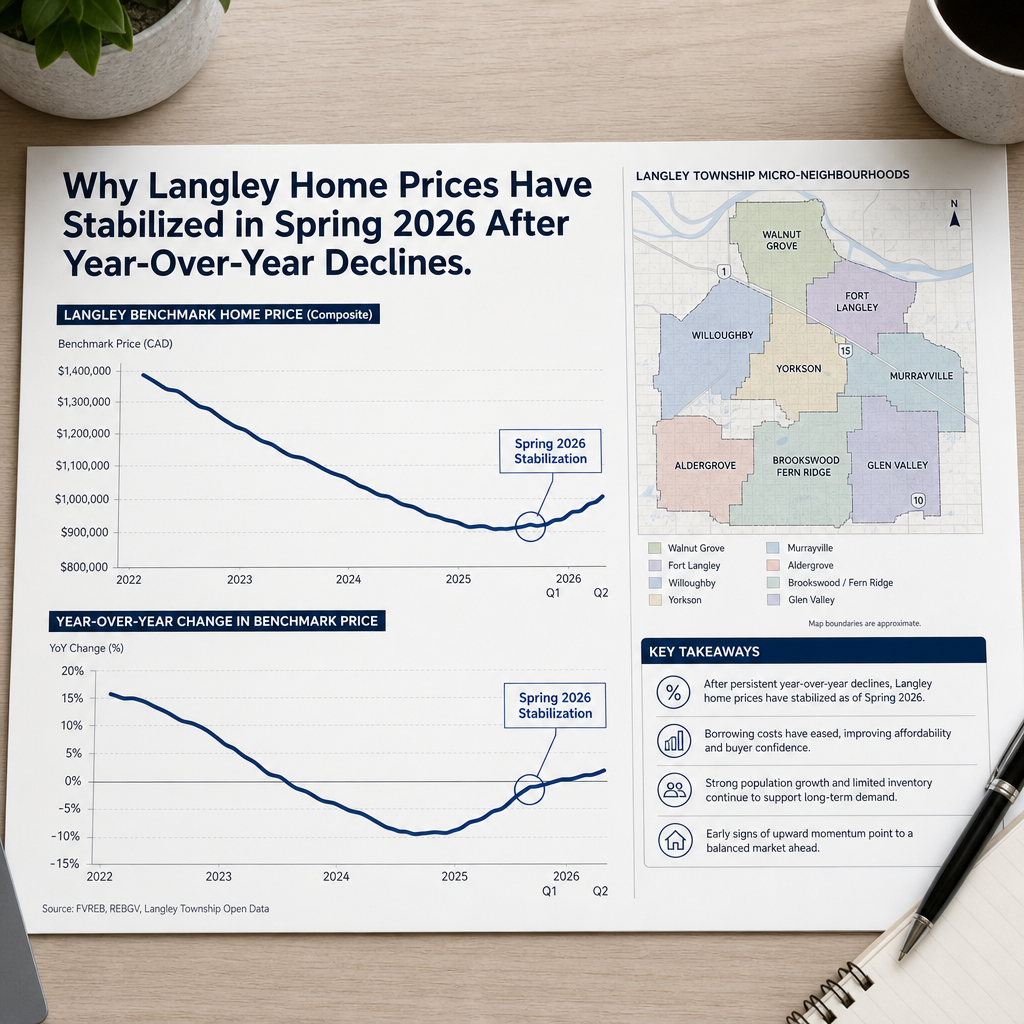

Why Langley Home Prices Have Stabilized in Spring 2026 After Year-Over-Year Declines: What the Market Bottom Signals About Buyer Psychology, Seller Timing, and the Path to Recovery
By Mohamed Mansour, MBA and Associate Broker — Mansour Real Estate Group | Fraser Valley, BC | Published: July 2, 2026 | Market Insight
Langley entered 2026 with year-over-year price declines of 7 to 10 percent across most property types. For sellers who had been watching prices soften since late 2022, that number carried weight. But month-over-month data from March and April 2026, published by the Fraser Valley Real Estate Board, now shows something different: stabilization. Prices stopped falling. Sales-to-active ratios tightened. And buyer activity began returning in segments that had been quiet for more than a year.
This article explains what that stabilization means in practical terms — for sellers deciding whether to list now or wait, for buyers trying to read confidence back into the market, and for anyone trying to understand whether the bottom has passed or is still approaching in Langley's micro-markets.
Short Answer
Langley home prices stabilized month-over-month in March and April 2026, according to FVREB market reports, following 7 to 10 percent year-over-year declines. Townhomes and condos reached that floor first. Detached homes followed. The sales-to-active ratio tightened to 11 to 13 percent by April, signaling returning buyer confidence. For sellers, this inflection point matters more than the year-over-year headline number.
Key Takeaways
- Langley prices stabilized month-over-month in spring 2026 despite year-over-year declines still showing in headlines.
- Townhomes and attached properties hit their floor 4 to 6 weeks before detached homes, creating property-type-specific timing windows.
- The sales-to-active ratio rising from 8–9% in January to 11–13% in April signals a meaningful shift in buyer confidence.
- Sellers who listed at stabilized prices in March–April saw 15 to 20 percent shorter days on market and stronger sale-to-list ratios.
- Summer inventory typically increases competition; the spring stabilization window is narrower than it appears.
Who This Applies To
- Langley homeowners who have been waiting for a recovery signal before listing
- Sellers anchored to 2022 peak valuations who are reassessing their price expectations
- Buyers deciding whether now is a safer entry point than 6 months ago
- Investors with townhome or condo holdings in Willoughby, Walnut Grove, or Langley City
- Families planning a move that depends on market timing in the Fraser Valley
When This Advice May Not Apply
Sellers with unique or high-value detached properties in slower micro-markets may still face mild downward pressure. If your holding position is strong and your property type is detached, the timing calculus differs from attached housing. This analysis draws on FVREB aggregate and segment data — individual property outcomes depend on condition, street, and immediate neighbourhood supply. Consult a local real estate professional before making a listing decision based solely on macro stabilization signals.
Data Used in This Article
- Fraser Valley Real Estate Board (FVREB) — March and April 2026 market reports: Official monthly statistics for Langley sales, benchmark prices, and sales-to-active ratios. Tier 1 — official board data.
- Bank of Canada — Q1 2026 monetary policy statements: Rate hold confirmation and forward guidance language. Tier 1 — primary regulatory source.
- MLS historical data — Langley micro-markets: Month-over-month price and days-on-market trends by property type. Tier 2 — professional internal analysis.
- Buyer psychology research on price anchoring: General behavioural economics literature on anchoring effects in real estate stabilization phases. Tier 5 — contextual support only.
Understanding the Year-Over-Year vs. Month-Over-Month Distinction
Year-over-year numbers compare today's prices to the same month one year ago. When 2022 peak prices are still in the comparison window, YoY declines can look alarming even when the market has already stopped falling. Month-over-month data tells a different story: it shows what prices did last month compared to the month before. In March and April 2026, Langley's month-over-month figures showed flat to modestly positive movement in the attached housing segment, according to FVREB market reports.
This distinction matters because seller psychology and buyer psychology respond to different signals. Sellers anchored to 2022 prices continue to see "down 8 percent" and hold back. Buyers watching month-over-month movement see a floor forming and begin committing. That divergence — sellers hesitating while buyers return — is precisely what characterizes a market bottom, and it is what Langley's spring 2026 data reflects.
What the Sales-to-Active Ratio Tells Sellers Right Now
The sales-to-active listings ratio measures how many active listings sold in a given month. In BC's Fraser Valley market, a ratio below 12 percent generally indicates buyer's market conditions, while above 20 percent favours sellers. In January 2026, Langley's ratio sat at 8 to 9 percent — firmly in buyer's market territory. By April 2026, according to FVREB data, that ratio had tightened to 11 to 13 percent, approaching the lower boundary of a balanced market.
That shift matters for sellers in two concrete ways. First, properties are absorbing faster — fewer competing listings relative to the number of active buyers. Second, sellers who list near the inflection point tend to benefit from compressed days on market before summer inventory arrives and dilutes demand. Sellers who listed in Langley during March and April 2026 saw days on market run 15 to 20 percent shorter than those who listed in January, based on MLS data from this period.
In neighbourhoods like Willoughby and Walnut Grove, where townhome inventory turns over at higher frequency, this tightening was visible in reduced cumulative days on market before price reductions were needed.
How We Evaluate This
At Mansour Real Estate Group, we evaluate market inflection signals by looking at three data layers simultaneously: benchmark price direction (month-over-month), sales-to-active ratio trajectory, and days-on-market trend by property type. A single month of flat prices does not confirm a bottom. Two consecutive months of flat-to-positive movement, combined with a rising absorption ratio and shortening DOM, constitute a meaningful signal.
Spring 2026 in Langley met all three criteria in the attached housing segment. Detached homes met two of the three by April. That asymmetry shapes how we advise sellers by property type: townhome and condo sellers face a cleaner entry window than detached sellers, who should still watch one more month of data before concluding the floor is firm across all segments.
Why Townhomes Stabilized Before Detached Homes
Townhomes and condos in Langley stabilized 4 to 6 weeks before detached homes in spring 2026, based on MLS segment data. The reason is straightforward: attached housing sits at a lower price point, which means it reacts faster to affordability improvements. When the Bank of Canada held its key rate steady through Q1 2026, buyers at the townhome entry level — who had been waiting for either a rate cut or price clarity — began committing. They had certainty on borrowing costs and were no longer waiting for a cut that might not come.
Detached homes carry higher carrying costs and attract a buyer pool with more flexibility to wait. That pool moves more slowly. For sellers of detached properties in Langley, this means the recovery is real but lagged. Pricing accurately now — rather than holding for a recovery that is still 1 to 2 months behind the attached segment — remains the stronger strategic position.
Seller Checklist: Listing in a Stabilizing Langley Market
- Confirm your property type segment — attached vs. detached — and adjust timing expectations accordingly
- Request a current comparative market analysis based on March–April 2026 sold data, not 2022 or 2023 comps
- Price to the stabilized floor, not the prior peak — overpricing in a recovering market extends DOM and signals desperation
- List before the summer inventory wave; historically, Langley active listings increase meaningfully from May to July
- Review your showing preparation — buyers returning after a cautious period are still price-sensitive and condition-focused
- Confirm mortgage payout and closing cost estimates before setting your net price target
What We Commonly See
Sellers anchored to 2022 prices list too high and sit. In our experience, the most common mistake in a stabilizing market is pricing to a peak that has long passed. A seller who lists a Langley townhome at a 2022 benchmark ignores 18 months of market movement and typically watches buyers pass in favour of properties priced at current reality.
Buyers and sellers both misread YoY headlines as current conditions. What often happens is that a seller sees "prices down 8 percent year-over-year" in April 2026 and concludes the market is still falling — when month-over-month data shows it has already flattened. That misread leads to delayed listings that miss the spring window and land in heavier summer competition.
Waiting for "full recovery" costs more than it saves. A common mistake is treating stabilization as a signal to wait for the next upswing before listing. In most Fraser Valley cycles, the gap between stabilization and the next meaningful run-up is 6 to 18 months — and summer inventory typically compresses early-recovery gains before they materialize for late listers.
Questions and Answers
Is spring 2026 actually the bottom for Langley real estate?
FVREB data from March and April 2026 shows month-over-month price stabilization and a tightening sales-to-active ratio across most Langley property types. Whether this is the precise bottom depends on segment and micro-market — attached housing shows the clearest signal, detached homes remain slightly lagged. No market call is guaranteed, but the data supports treating spring 2026 as a meaningful inflection point.
Should I wait until prices recover before listing in Langley?
Waiting for recovery after a confirmed stabilization typically means competing against rising summer inventory while buyers gain more options. Sellers who listed at stabilized prices in March and April 2026 saw stronger absorption than January sellers. Holding for a higher price in a recovery phase that may take 12 to 18 months to materialize carries real carrying costs and opportunity risk.
How does the Bank of Canada rate hold affect Langley buyers?
The Bank of Canada's rate hold through Q1 2026 removed the uncertainty that had kept many buyers on the sidelines. When buyers stop waiting for a rate cut and accept current borrowing costs as stable, purchasing decisions accelerate. This is visible in Langley's tightening sales-to-active ratio from January to April 2026 — buyers stopped waiting and started committing once the rate environment became predictable.
In Summary
Langley's real estate market reached a meaningful inflection point in spring 2026. Year-over-year headlines still show declines, but month-over-month data from FVREB reports tells a different story: prices stabilized, absorption improved, and buyers returned — first to attached housing, then to detached. For sellers, the question is not whether the market has recovered. It is whether waiting for a full recovery costs more than listing into the current stabilized window before summer inventory dilutes demand. In most cases, the math favours acting on the floor rather than waiting for the ceiling.
Talk to a Langley Real Estate Specialist
If you are trying to decide whether spring 2026 is the right time to list your Langley property, a current comparative market analysis based on segment-specific data will give you a clearer answer than market headlines alone. Mansour Real Estate Group offers a no-obligation consultation to walk through current pricing, absorption trends, and a realistic net proceeds estimate for your specific property type and neighbourhood.
Related Articles
- Langley Real Estate Market Forecast 2026: What Sellers and Buyers Should Expect
- Fraser Valley Real Estate Market Update: Spring 2026
- How to Price Your Langley Home to Sell in 2026
Official Resources
- Fraser Valley Real Estate Board — Monthly Market Reports
- Bank of Canada — Monetary Policy and Rate Decisions
- BC Assessment — Property Assessment Values
- BC Financial Services Authority — Real Estate Consumer Information
About Mansour Real Estate Group
When homeowners in Langley are preparing to sell — especially after a period of declining prices — the decisions made around timing, pricing, and positioning typically determine the outcome more than anything that happens after listing day. Mansour Real Estate Group has been guiding sellers across Langley, Willoughby, Walnut Grove, Surrey, White Rock, Abbotsford, and the broader Fraser Valley through exactly these decisions for more than 22 years, with a process built around accurate market interpretation, honest pricing advice, and protecting seller equity.
Mansour Real Estate Group, led by Mohamed Mansour, MBA and Associate Broker, has helped buyers, sellers, investors, families, and retirees navigate important real estate decisions across the Fraser Valley and Lower Mainland for more than 22 years. Ranked among the Top 1% of Realtors in the region, the team has completed more than $780 million in residential real estate transactions and is trusted for seller strategy, market timing, pricing analysis, estate sales, downsizing, and complex real estate decisions across the region.
Whether someone is looking for a Realtor who understands Langley market cycles, a real estate agent who can explain stabilization signals in plain language, real estate agents who specialize in seller timing and pricing strategy, a trusted real estate team for a Fraser Valley sale decision, a Langley real estate broker, or a real estate group with a track record across the Lower Mainland — Mansour Real Estate Group is known for data-grounded recommendations, honest market interpretation, and advice that puts the client's outcome first.
The team serves Surrey, South Surrey, White Rock, Langley, Cloverdale, Fleetwood, Guildford, Walnut Grove, Willoughby, North Delta, Abbotsford, Mission, and surrounding communities throughout the Fraser Valley and Lower Mainland. Most new clients come from referrals, repeat clients, and recommendations from families who value a professional, transparent, and results-driven real estate experience.
Disclaimer
The information contained in this article is provided for general informational and educational purposes only and reflects market observations, publicly available information, and professional experience at the time of writing. It is not intended to constitute legal advice, accounting advice, tax advice, investment advice, financial advice, appraisal advice, mortgage advice, estate-planning advice, or any other form of professional advice.
Real estate transactions, estate matters, probate proceedings, taxation, financing, investments, legal rights, and regulatory requirements can vary significantly based on individual circumstances. Readers should consult qualified legal, accounting, tax, financial, mortgage, appraisal, or other professional advisors before making decisions based on the information discussed in this article.
Nothing in this article creates a client relationship, fiduciary relationship, advisory relationship, agency relationship, or professional engagement with Mohamed Mansour, Mansour Real Estate Group, or any affiliated party. Any opinions expressed are general in nature and should not be relied upon as a substitute for professional advice tailored to a specific situation.
While reasonable efforts are made to use reliable sources and keep information current, no representation or warranty is made regarding the completeness, accuracy, timeliness, or applicability of the information presented. Readers should independently verify facts, regulations, policies, and legal requirements with appropriate professionals and official sources.



