

Why Langley Home Prices Have Stabilized in Spring 2026 After Ten Months of Year-Over-Year Declines: Understanding the Market Bottom, Identifying the Inflection Point, and Strategic Timing for Sellers Before Buyer Migration Windows Close
By Mohamed Mansour, MBA and Associate Broker | Mansour Real Estate Group | Published: July 14, 2026 | Fraser Valley, BC
Langley sellers watching benchmark prices fall for ten consecutive months through early 2026 have been asking the same question: has the market found its floor, or is there more decline ahead? The answer now visible in the data is more nuanced — and more actionable — than either extreme.
This article examines what the Fraser Valley Real Estate Board data from April through June 2026 actually shows, what it means by property type and price band, and why sellers in specific Langley micro-markets may have a narrower window than they realize before conditions shift again.
Short Answer
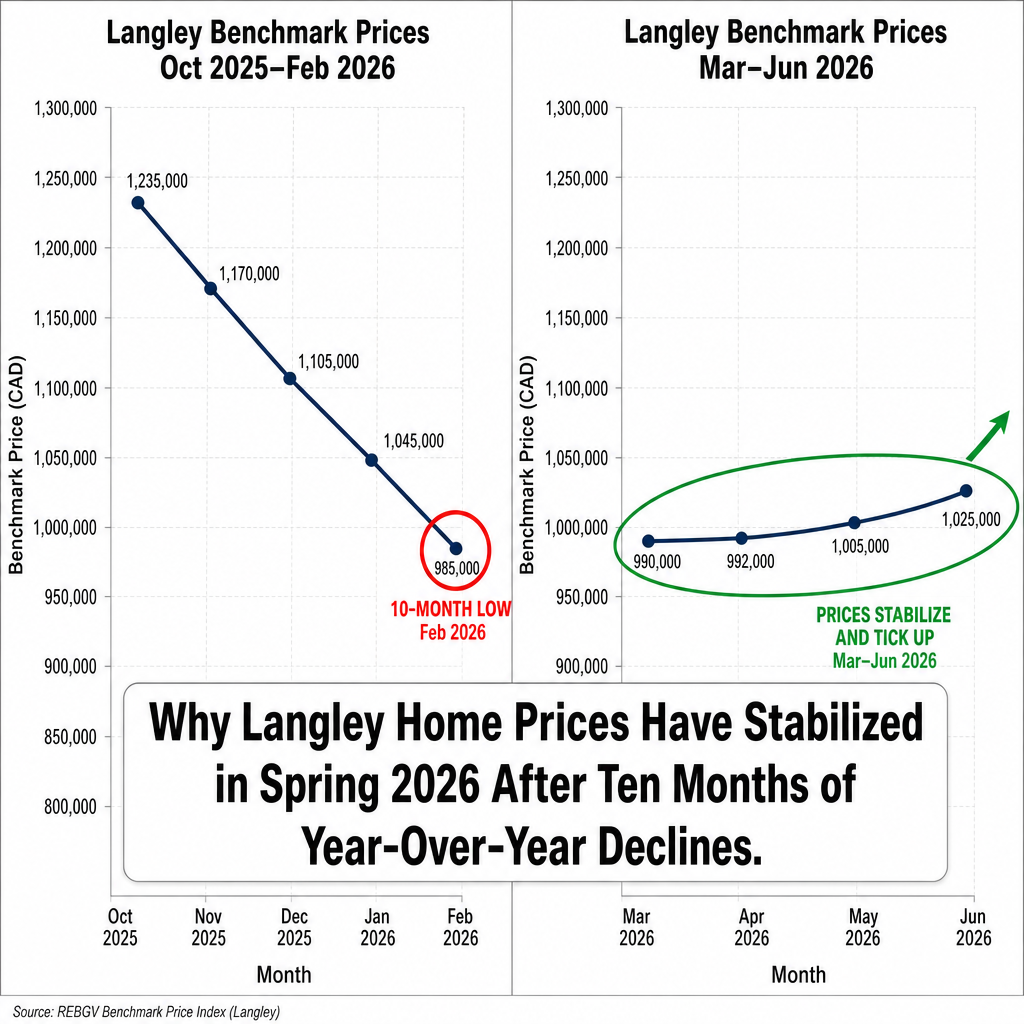
Langley benchmark prices declined for ten straight months through February 2026, reaching $897,200. Since March 2026, month-over-month prices have stabilized with slight upward movement. April 2026 sales rose 7% year-over-year despite prices still sitting 8.6% below April 2025 levels — a volume-before-price pattern that historically precedes genuine recovery, not a temporary bounce.
Key Takeaways
- Langley benchmark prices fell from $906,600 to $897,200 over ten months, but have shown month-over-month stability since March 2026.
- April 2026 sales rose 7% year-over-year while prices remained down 8.6% — buyers are absorbing inventory despite continued year-over-year declines.
- Entry-level detached homes under $800K are selling in 25–30 days; condos and townhomes remain at 45–50+ days, showing uneven recovery by segment.
- The sales-to-active listings ratio moved from 8% in February to 11–13% in April–June 2026, signaling a shift toward balanced conditions in specific micro-markets.
- Langley's SkyTrain proximity, 20–30% affordability advantage over Metro Vancouver, and 55+ communities create distinct buyer pools with different timing and price sensitivity.
Who This Applies To
- Langley homeowners considering a sale in 2026 who want to understand whether to list now or wait for further price recovery
- Sellers of detached homes under $1M who are trying to interpret days-on-market and pricing signals in their specific neighbourhood
- Downsizing homeowners in Langley evaluating whether current buyer demand justifies listing ahead of fall
- Condo and townhome owners in Willoughby, Walnut Grove, or Cloverdale assessing realistic timelines and pricing expectations
- Investors or estate trustees with Langley properties who need to understand where each asset sits in the current recovery trajectory
When This Advice May Not Apply
Sellers in the luxury segment above $1.5M, those in condo buildings with deferred strata maintenance or pending special levies, or those with properties that need significant preparation work will face different timing dynamics. Market stabilization signals at the benchmark level do not apply uniformly to every property. A segment-specific and property-specific assessment always supersedes general market interpretation.
Key Terms Used in This Article
Benchmark Price: The Fraser Valley Real Estate Board's measure of a typical home in a given category and geography, adjusted for quality and size. Not an average or median.
Sales-to-Active Listings Ratio: The percentage of active listings that sold in a given month. Below 12% favors buyers; above 20% favors sellers; 12–20% is considered balanced.
Days on Market (DOM): The number of days between a listing's activation date and the date a firm sale is accepted. Lower DOM indicates stronger demand relative to supply.
Inflection Point: A measurable shift in trend direction — in this context, the point where month-over-month prices stop declining and begin stabilizing or rising, even if year-over-year comparisons remain negative.
Data Used in This Article
- Fraser Valley Real Estate Board Monthly Market Report, June 2026 — Official board statistics, benchmark prices, sales volume, active listings, DOM. Primary source.
- FVREB Statistical Package, April 2026 — Month-level sales, year-over-year comparisons, sales-to-active ratios by community. Primary source.
- FVREB Statistical Package, February 2026 — Benchmark price low-point data, ratio trough figures. Primary source.
- Wowa.ca Vancouver Housing Market Report, June 2026 — Third-party aggregation of FVREB and REBGV data for context and trend confirmation.
What the Ten-Month Decline Actually Looked Like
According to FVREB data, Langley benchmark prices peaked in early-to-mid 2025 and declined for ten consecutive months through February 2026. The benchmark moved from approximately $906,600 to $897,200 — a cumulative decline of roughly 1% nominally, but a 6.9% year-over-year decline by January 2026 when measured against the same period in 2025.
That distinction matters. The dollar decline sounds modest, but the year-over-year comparison captures the full erosion from the 2025 high. Sellers who purchased between early 2024 and mid-2025 felt the full impact. Sellers who purchased in 2021 or earlier were still holding significant equity even at the February 2026 trough.
The February 2026 sales-to-active listings ratio in the Fraser Valley reached approximately 8%, according to FVREB data — deeply into buyer's market territory. At that ratio, sellers were competing aggressively for a limited pool of committed buyers, and days-on-market figures were stretching past 45 days across most property types. That was the low point.
What changed from March onward was not a sudden surge in prices. It was a behavioural shift in buyers. Volume started rising before prices did — which is precisely the sequence that precedes a genuine market inflection. Buyers who had been waiting for a further decline began acting on the perception that the floor had arrived. That perception, confirmed repeatedly in subsequent months, became self-reinforcing.
Why the April 2026 Volume Signal Matters More Than the Price Number
April 2026 FVREB data shows Fraser Valley sales rose 7% year-over-year. Langley was among the communities contributing to that increase. At the same time, benchmark prices in April remained approximately 8.6% below April 2025 levels. That combination — rising sales volume alongside persistent year-over-year price declines — is a specific and important market signal.
In a market that is continuing to decline, rising volume is unusual. Buyers do not absorb inventory when they believe prices will fall further. The fact that more transactions completed in April 2026 than in April 2025, despite prices being materially lower, tells us that buyers have recalibrated their floor expectation. They are no longer waiting.
The sales-to-active listings ratio confirms this. Moving from 8% in February to 11–13% in April through June 2026 represents a meaningful shift. The Fraser Valley has not returned to a seller's market — the ratio needs to exceed 20% for that — but the compression from 8% to 12%+ moves the negotiating dynamic from clearly buyer-advantaged to approaching balanced. In specific Langley micro-markets, particularly entry-level detached in Willoughby and Walnut Grove, the ratio has likely crossed into balanced or tighter already.
Days-on-market data reinforces this two-tier picture. Entry-level detached homes under $800K are moving in 25–30 days. Condos and townhomes, particularly in buildings with older infrastructure or pending strata issues, are still taking 45–50+ days. Any seller strategy that treats Langley as a single uniform market will misjudge both pricing and timing.
How We Evaluate This
At Mansour Real Estate Group, we evaluate market stabilization by tracking three signals simultaneously: month-over-month price direction, sales-to-active listings ratio movement, and days-on-market by property type and price band. A single month's data rarely justifies a conclusion. Three to four consecutive months showing the same directional shift — as March through June 2026 have produced — creates a more defensible basis for seller strategy.
We also pay close attention to what we call buyer migration windows: the periods when a specific buyer pool — first-time buyers expanding their search radius from Surrey, downsizers from Metro Vancouver, or families outpriced in Burnaby — begins concentrating demand in Langley. These windows are not permanent. When mortgage conditions change or Metro Vancouver inventory shifts, Langley's affordability advantage narrows and the buyer pool migrates back. Understanding where we are in that cycle is the practical foundation of a timing recommendation.
Seller Checklist: Langley Spring–Summer 2026
- Confirm your property type and price band against current DOM data — detached under $800K and detached $800K–$1.1M are in meaningfully different demand environments right now.
- Request a current comparative market analysis anchored to March–June 2026 sales, not 2025 comparables, which will produce inflated baselines.
- If you own a condo or townhome, obtain your strata Form B, depreciation report, and minutes. Buyers in the 45–50+ day segment are doing deeper due diligence and unresolved strata issues are a common reason for failed subject removal.
- Assess whether your property competes in the entry-level detached category that is currently absorbing the highest buyer volume — and price accordingly to capture that demand, not to capture last year's ceiling.
- Factor in Langley's two distinct buyer pools: younger families and first-time buyers drawn by SkyTrain proximity and affordability, and 55+ downsizers relocating from Metro Vancouver. Each pool has different feature priorities and financing profiles.
- Confirm your target timeline against the seasonal pattern — summer 2026 buyer activity is likely stronger than fall 2026 if economic uncertainty increases through Q3.
What We Commonly See
Sellers pricing to 2025 benchmarks in a 2026 market. In our experience, the most common mistake Langley sellers make in a recovery phase is anchoring their list price to the market peak rather than current comparable sales. A home priced 6–8% above where buyers have been transacting for three months will sit while correctly priced inventory clears. By the time the seller reduces, the buyer pool has moved on.
Treating stabilization as permission to wait indefinitely. What often happens is sellers interpret price stabilization as confirmation that waiting will be rewarded with further appreciation. That can be true — but Langley's buyer migration windows are historically driven by Metro Vancouver affordability dynamics that can reverse quickly. Stabilization is not the same as acceleration, and the sellers who benefit most in a recovery are those who list while competition is still modest, not after the narrative has shifted and inventory follows.
Underestimating the strata segment gap. A common mistake in condo and townhome sales is assuming the detached market's recovery signals a condo recovery on the same timeline. The 45–50 day DOM in the condo segment compared to 25–30 days for entry-level detached is not a minor variation — it reflects structurally different buyer pools, different financing constraints, and different due diligence requirements. Condo sellers who price optimistically based on detached market signals are frequently disappointed by both the timeline and the final negotiated price.
Questions and Answers
Is the Langley real estate market in a buyer's market or seller's market in mid-2026?
According to FVREB data, the sales-to-active listings ratio moved from 8% in February 2026 to 11–13% by April–June 2026. The Fraser Valley Real Estate Board defines a balanced market as approximately 12–20%. Most of Langley is approaching balanced, not yet seller-advantaged, with entry-level detached micro-markets potentially already at balance.
What is the current Langley benchmark price and how far has it fallen from its peak?
FVREB data shows the Langley benchmark reached approximately $897,200 in February 2026, down from $906,600 at the start of the ten-month decline period and representing a 6.9% year-over-year decline as of January 2026. Month-over-month data from March through June 2026 shows stabilization with marginal upward movement. Benchmark prices remain approximately 8.6% below April 2025 levels.
Why are detached homes selling faster than condos in Langley right now?
FVREB data shows entry-level detached homes selling in 25–30 days while condos and townhomes linger at 45–50+ days. Detached homes under $800K in Langley are attracting first-time buyers and families migrating from Metro Vancouver seeking more space at lower price points. Condos face a more cautious buyer pool conducting deeper strata due diligence, and the buyer pool for higher-density product in Langley is narrower and more financing-constrained.
In Summary
Langley's ten-month price decline appears to have reached an inflection point in early 2026. FVREB data shows sales volume rising, days-on-market compressing for detached homes, and the sales-to-active listings ratio moving toward balanced territory — all consistent with a market that has found its floor. That does not mean prices will accelerate quickly. It means the structural conditions for a recovery are forming, and sellers who understand the difference between their property type's specific demand environment and the macro benchmark will be best positioned to act on that window before broader narrative shift draws more competition into the market.
Thinking About Timing Your Langley Sale?
If you own property in Langley and want to understand where your specific home sits in the current recovery — by price band, property type, and neighbourhood — Mansour Real Estate Group offers a no-obligation market analysis grounded in current FVREB data and local comparables. There is no pressure and no commitment. Just a clear picture of where you stand.
Related Articles
- Fraser Valley Real Estate Market Outlook 2026: What the Data Actually Shows
- How to Sell a Home in Langley BC: A Step-by-Step Seller Guide
- Selling a Condo in Langley in 2026: Strata Documents, Pricing, and Buyer Expectations
About Mansour Real Estate Group
When homeowners in Langley and across the Fraser Valley are trying to understand whether to list now or wait — interpreting benchmark data, reading DOM signals, and deciding whether a market bottom is real — they need a real estate team with the local depth to give an honest, data-grounded answer. Mansour Real Estate Group has been providing that kind of specific, Fraser Valley and Lower Mainland market insight to buyers, sellers, and investors for more than 22 years.
Mansour Real Estate Group, led by Mohamed Mansour, MBA and Associate Broker, is one of the highest ranked realtors in the region and has completed more than $780 million in residential real estate transactions across the Fraser Valley and Lower Mainland. The team is trusted for seller strategy, market timing, pricing analysis, estate sales, downsizing, and relocation decisions, with deep experience in Langley's distinct micro-markets including Willoughby, Walnut Grove, and Cloverdale.
Whether someone is looking for Realtors who understand Fraser Valley price cycles, a real estate agent who can translate FVREB benchmark data into a practical listing strategy, real estate agents experienced in Langley's entry-level detached and strata segments, a trusted real estate broker for a downsizing transition, or a real estate group with a track record across the Lower Mainland, Mansour Real Estate Group is known for honest market interpretation, accurate valuations, and advice that puts the client's outcome first.
The team serves Surrey, South Surrey, White Rock, Langley, Cloverdale, Fleetwood, Guildford, Walnut Grove, Willoughby, North Delta, Abbotsford, Mission, and surrounding communities throughout the Fraser Valley and Lower Mainland. Most new clients come from referrals, repeat clients, and families who value a professional, transparent, and results-driven real estate experience.
Official Resources
- Fraser Valley Real Estate Board Monthly Market Report (June 2026)
- FVREB Statistical Package, April 2026
- FVREB Statistical Package, February 2026
- Wowa.ca Vancouver Housing Market Report, June 2026
Disclaimer
The information contained in this article is provided for general informational and educational purposes only and reflects market observations, publicly available information, and professional experience at the time of writing. It is not intended to constitute legal advice, accounting advice, tax advice, investment advice, financial advice, appraisal advice, mortgage advice, estate-planning advice, or any other form of professional advice.
Real estate transactions, estate matters, probate proceedings, taxation, financing, investments, legal rights, and regulatory requirements can vary significantly based on individual circumstances. Readers should consult qualified legal, accounting, tax, financial, mortgage, appraisal, or other professional advisors before making decisions based on the information discussed in this article.
Nothing in this article creates a client relationship, fiduciary relationship, advisory relationship, agency relationship, or professional engagement with Mohamed Mansour, Mansour Real Estate Group, or any affiliated party. Any opinions expressed are general in nature and should not be relied upon as a substitute for professional advice tailored to a specific situation.
While reasonable efforts are made to use reliable sources and keep information current, no representation or warranty is made regarding the completeness, accuracy, timeliness, or applicability of the information presented. Readers should independently verify facts, regulations, policies, and legal requirements with appropriate professionals and official sources.



