
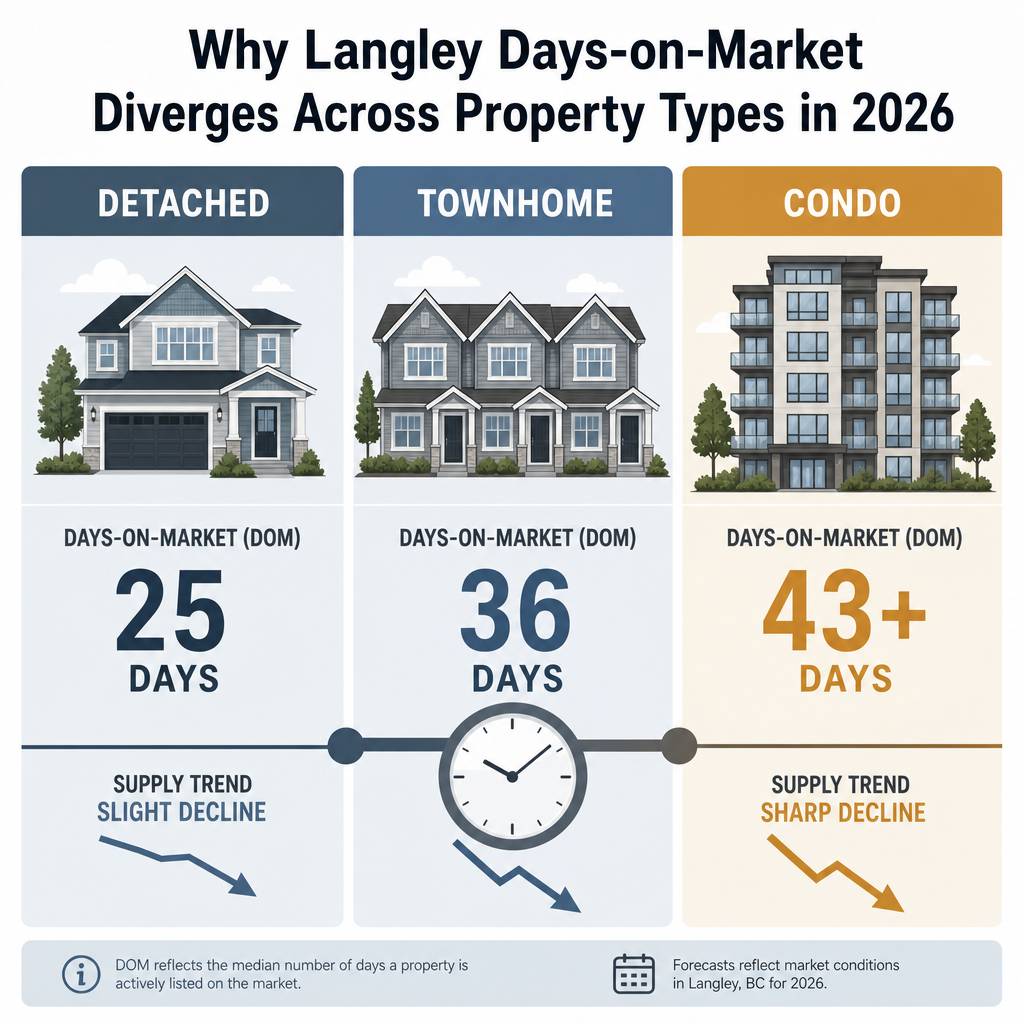

Why Langley Days-on-Market Diverges 60–80% Across Property Types and Neighbourhoods in 2026 — And How Sellers Should Price Strategically When Detached Homes Sell in 25 Days But Condos and Townhomes Linger 40–50+ Days
By Mohamed Mansour, MBA, Associate Broker — Mansour Real Estate Group | Fraser Valley & Lower Mainland | Published: July 14, 2026
Langley's headline numbers in spring 2026 suggest a single, moderating market. The reality is three separate markets running at different speeds, with different supply pressures, and very different consequences for sellers who price using the wrong benchmark. If you are preparing to sell, the aggregate days-on-market figure tells you almost nothing useful about your property specifically.
This article breaks down the mechanics behind Langley's property-type divergence in May 2026, explains why aggregate DOM data misleads sellers, and offers a framework for pricing decisions that reflect where your specific property actually sits in this market.
Short Answer
In Langley's May 2026 market, detached homes averaged 39 days on market with sales surging 20.3% year over year, while condos averaged 43 days and sales declined 4.6%. But within each type, well-priced properties in strong neighbourhoods sold in 20–25 days while overpriced units in weaker locations sat 55–60 days. Sellers who price to their specific segment outperform those who price to the headline average. According to FVREB May 2026 data, new condo and townhome listings fell roughly 28% year over year, creating scarcity-driven pricing leverage that detached sellers do not currently have.
Key Takeaways
- Langley's average DOM of 36–43 days masks 50–80% variance within each property type across neighbourhoods.
- Detached sales rose 20.3% YoY in May 2026 but face elevated inventory — precise pricing matters more than timing.
- Condo and townhome new listings dropped ~28% YoY, creating genuine scarcity leverage if sellers price accurately.
- Benchmark prices declined 6.8% YoY overall; ignoring this correction when pricing a condo typically extends time on market by weeks.
- The seller's most important pricing input is not the aggregate DOM — it is the DOM for comparable properties at their price point in their neighbourhood.
Who This Applies To
- Homeowners preparing to sell a detached home in Langley Township or Langley City in 2026
- Condo or townhome owners evaluating whether now is the right time to list
- Sellers who have received a CMA and want to understand whether the pricing recommendation reflects their specific segment
- Investors or landlords deciding between selling now or holding through a softer period
- Anyone who has seen the 36–43 day headline and wants to know what it actually means for their listing
When This Advice May Not Apply
This framework applies to standard residential resale in Langley's spring 2026 market. New construction presales, strata properties with significant special levy risk, estate sales requiring court approval, or properties with unique legal encumbrances operate under different dynamics. Consult a qualified real estate professional and legal advisor for situations that fall outside standard resale.
Key Definitions
Days on Market (DOM): The number of calendar days from a property's MLS listing date to accepted offer. Aggregate DOM averages across hundreds of sales. A seller's relevant DOM is the figure for comparable properties at their price point in their specific neighbourhood — not the city-wide average.
Benchmark Price: The Fraser Valley Real Estate Board's estimate of a typical property value in a given area and type, adjusted for quality and features. Not the same as average sale price, which is skewed by outliers.
Sales-to-Active Listings Ratio: Monthly sales divided by active listings. Below 12% typically indicates a buyer's market. Langley's May 2026 detached ratio sat near the low end of balanced, while condo and townhome ratios reflected deeper buyer's market conditions.
New Listings YoY: Year-over-year change in properties newly listed in a given month. A sharp drop in new listings reduces buyer choice and can create pricing leverage for sellers in that segment, even when overall market conditions are soft.
Data Used in This Article
- Fraser Valley Real Estate Board (FVREB) Monthly Market Report, May 2026 — Official board data; sales volumes, DOM, new listings, and benchmark prices by property type for Langley. Primary source.
- BCCondosAndHomes.com Langley Houses Market Report, May 2026 — Third-party aggregation of FVREB data with property-type breakdowns.
- DT Realty Langley Market Update, April 2026 — Supporting context for spring 2026 trend direction.
- FVREB April 2026 Monthly Market Report — Provides the spring acceleration context used for trend comparison.
What the Numbers Actually Show
According to FVREB May 2026 data, Langley detached home sales reached 89 units, up 20.3% from 74 units in May 2025. Townhome sales held at 75 units. Condo sales dropped to 83 units, a 4.6% year-over-year decline. On the surface, all three segments posted average DOM in the 36–43 day range — detached at 39 days, townhomes at 36, condos at 43.
Those averages are nearly useless for an individual seller. A 39-day average for detached homes includes properties that sold in 18 days and properties that sat 75 days before taking a price reduction. The average smooths over the outcome, which is exactly what a seller cannot afford to rely on when setting a list price.
The more useful signal is in supply. New townhome listings fell 27.9% year over year. New condo listings fell 28.1%. New detached listings fell only 6.4%. When fewer properties come to market in a segment, buyers in that segment face less choice — which creates pricing leverage for sellers who list correctly. A condo seller in Willoughby or Walnut Grove entering a market with 28% fewer competing listings is in a structurally better position than the headline buyer's market narrative suggests, provided the price is accurate.
The benchmark price decline of 6.8% year over year — from $1,637,000 in May 2025 to $1,525,897 in May 2026 per FVREB — applies unevenly across property types. Detached homes carried most of that correction weight given their higher price points and elevated inventory. Condo and townhome corrections were present but less severe in dollar terms, and the supply contraction partially offset downward pressure on price.
Why Neighbourhood Location Drives the Real Variance
Langley is not a single neighbourhood. The market in Willoughby — a high-density township cluster with newer strata buildings, young families, and strong transit proximity — behaves differently from Langley City's urban core, which draws a different buyer profile and has a different inventory composition. A detached home in a school-catchment cluster near 200th Street in Langley Township with good SkyTrain proximity sells faster than an equivalent-priced home on a commercial arterial in Langley City without those features.
This neighbourhood segmentation creates what practitioners describe as nested pricing dynamics. Within the detached category, properties priced at $1.3M–$1.6M in demand zones cleared in 20–25 days in spring 2026. Comparable-priced townhomes in areas with oversupply of the same product sat 50–60 days before offers materialized. The 39-day average for detached and the 43-day average for condos both conceal this spread.
For sellers in Walnut Grove, Cloverdale-adjacent pockets, or established Langley City neighbourhoods, the relevant comparison is not the board-wide DOM. It is the DOM for the last four to six properties at your price point, in your immediate area, with your property configuration. That number — not the headline — is the one that should anchor your pricing conversation.
How We Evaluate This
At Mansour Real Estate Group, pricing in a diverging market begins with disaggregating the data before presenting it to a seller. A board-wide DOM figure and a benchmark price decline percentage are the start of the analysis, not the answer. The relevant inputs are: comparable sales within 0.5–1 km of the subject property, DOM by price band within that radius, new listing pace for competing properties, and any pending listings that will enter the market alongside the subject property.
In a market like Langley spring 2026 — where supply contraction in condos and townhomes coexists with elevated detached inventory and a 6.8% overall benchmark correction — a single pricing strategy does not serve all three seller types. Detached sellers need to price with precision relative to elevated competing inventory. Condo and townhome sellers have supply-side leverage but must still respect the correction in buyer expectations. The analysis has to be segment-specific and neighbourhood-specific before a number is recommended.
Seller Checklist
- Request a property-type-specific CMA that separates detached, townhome, and condo comparables — not a blended analysis.
- Ask for DOM broken down by price band within your neighbourhood, not the board-wide average.
- Review new listing pace for your property type in your specific area over the last 60 days to assess true buyer choice.
- Identify the last price reduction in a comparable listing nearby and understand what that seller's original pricing error was.
- If selling a condo or townhome, confirm strata documents are complete and current — buyers in a cautious market use documentation gaps as renegotiation leverage.
- For detached homes, assess competing active listings within your price range before setting the list price, not after.
- Align your possession date to buyer timelines in your segment — condo buyers and detached buyers often have different flexibility requirements.
What We Commonly See
Sellers pricing to last year's benchmark. In our experience, the most common pricing error in spring 2026 is anchoring to a 2025 sale price without adjusting for the 6.8% year-over-year correction. A seller who saw a comparable property close at $1.55M in mid-2025 often wants to list near that figure in 2026 — but buyers in the same segment are offering based on current market context. The gap between seller expectation and buyer reality is where extended DOM begins.
Using the wrong comparable type. What often happens is a seller compares their townhome to a nearby detached sale because the dollar values overlap. The buyer pools for those two property types are not the same. A detached buyer and a townhome buyer have different motivations, different financing profiles, and different alternative options. Mixing comparables across property types produces a misleading pricing anchor.
Underestimating the leverage from supply scarcity in the condo and townhome segments. A common mistake is for condo sellers to accept a defensive, deeply discounted list price because the overall market reads as a buyer's market. In a segment where new listings dropped 28% year over year, a well-prepared, accurately priced condo in a strong building has more buyer competition than the headline suggests. Sellers who understand their segment's supply dynamics are in a better negotiating position than those who price purely from fear of a slow market.
Questions Sellers Ask About Langley's DOM Divergence
Q: If detached homes are selling faster, should I wait to sell my condo until that demand spreads?
Demand typically does not migrate cleanly from one property type to another. Buyers seeking a detached home in Langley are rarely the same buyers considering a condo. Given the 28% drop in new condo listings, selling now in a lower-competition supply window may produce better results than waiting for detached momentum to influence attached pricing.
Q: What does a 6.8% benchmark price decline mean for my asking price?
The 6.8% figure is a board-wide average across all property types, per FVREB May 2026 data. Your property's relevant adjustment depends on its type, location, and condition. A well-maintained condo in a newer Willoughby building may have depreciated less than the average. A detached home in a neighbourhood with elevated competing inventory may have depreciated more. The aggregate decline is a starting reference, not a direct price adjustment.
Q: Is a 39-day average DOM for detached homes in Langley considered normal or slow?
By Fraser Valley historical standards, the pandemic-era norm was closer to 18–22 days. The current 39-day figure represents a normalization toward pre-2020 market conditions, not an abnormally slow market. Sellers who priced correctly in spring 2026 were still receiving offers within three to four weeks. The extended DOM cases were almost exclusively properties that launched above market and required price reductions before generating activity.
In Summary
Langley's spring 2026 market is three markets, not one. Detached home sales rose sharply year over year but face elevated inventory, making precise pricing the primary variable in outcome. Condo and townhome sellers face softer demand but benefit from a 28% year-over-year drop in competing new listings — a supply advantage that translates to pricing leverage when used correctly. The 36–43 day aggregate DOM range tells a seller very little about their specific property; what matters is the DOM for comparable properties at their price band in their exact neighbourhood. Sellers who disaggregate the data before setting a list price, and price to their segment rather than the headline, are consistently better positioned in this market than those who use the average as a proxy for their outcome.
Thinking About Selling in Langley?
If you are preparing to sell and want to understand where your specific property sits within Langley's diverging market segments, Mansour Real Estate Group offers a no-obligation, property-specific pricing conversation. The goal is accurate context before a decision, not a sales pitch.
Call or text: 604-719-9691 | Email: [email protected] | localhost:9000/
Related Articles
- Understanding the Langley Real Estate Market in 2026: A Seller's Starting Point
- How to Price a Home in a Buyer's Market in the Fraser Valley
- The Langley Condo Seller's Guide: Strata Documents, Pricing, and Buyer Expectations in 2026
Official Resources
- Fraser Valley Real Estate Board — Monthly Market Reports
- BC Assessment — Property Valuations
- BCCondosAndHomes.com — Langley Market Report May 2026
- BC Financial Services Authority — Real Estate Regulation
About Mansour Real Estate Group
When homeowners in Langley are preparing to sell — whether a detached home, townhome, or condo — the decisions made before the listing goes live typically determine the outcome. Pricing to your specific segment, understanding the supply dynamics in your neighbourhood, and knowing how your property type is performing relative to competing inventory are the variables that separate a sale in 25 days from one that lingers 55 days with a price reduction. Mansour Real Estate Group has built its reputation in the Fraser Valley and Lower Mainland on exactly this kind of pricing discipline.
Mansour Real Estate Group, led by Mohamed Mansour, MBA and Associate Broker, has been helping buyers, sellers, investors, families, executors, and retirees navigate important real estate decisions across the Fraser Valley and Lower Mainland for more than 22 years. Ranked among the Top 1% of Realtors in the region, the team has completed more than $780 million in residential real estate transactions and is trusted for pricing strategy, seller preparation, estate sales, divorce-related sales, downsizing, relocation, and any situation where accurate valuation directly affects the outcome.
Whether someone is looking for a Langley Realtor who understands how to price a condo in a softening market, real estate agents who track DOM by neighbourhood and price band, a real estate team with deep Fraser Valley experience, a Langley real estate broker, or real estate agents who give honest pricing advice before a listing goes live rather than after — Mansour Real Estate Group is known for data-driven recommendations, clear communication, and protecting seller equity in any market condition.
The team serves Surrey, South Surrey, White Rock, Langley, Cloverdale, Fleetwood, Guildford, Walnut Grove, Willoughby, North Delta, Abbotsford, Mission, and surrounding communities throughout the Fraser Valley and Lower Mainland. Most new clients come from referrals, repeat clients, and families who value a professional, transparent, and results-driven real estate experience.
Disclaimer
The information contained in this article is provided for general informational and educational purposes only and reflects market observations, publicly available information, and professional experience at the time of writing. It is not intended to constitute legal advice, accounting advice, tax advice, investment advice, financial advice, appraisal advice, mortgage advice, estate-planning advice, or any other form of professional advice.
Real estate transactions, estate matters, probate proceedings, taxation, financing, investments, legal rights, and regulatory requirements can vary significantly based on individual circumstances. Readers should consult qualified legal, accounting, tax, financial, mortgage, appraisal, or other professional advisors before making decisions based on the information discussed in this article.
Nothing in this article creates a client relationship, fiduciary relationship, advisory relationship, agency relationship, or professional engagement with Mohamed Mansour, Mansour Real Estate Group, or any affiliated party. Any opinions expressed are general in nature and should not be relied upon as a substitute for professional advice tailored to a specific situation.
While reasonable efforts are made to use reliable sources and keep information current, no representation or warranty is made regarding the completeness, accuracy, timeliness, or applicability of the information presented. Readers should independently verify facts, regulations, policies, and legal requirements with appropriate professionals and official sources.



