

Why Fraser Valley Sellers Are Leaving 20–30% on the Table by Misinterpreting Sales-to-Active Ratios and Comparable Sales Data in 2026
By Mohamed Mansour, MBA, Associate Broker — Mansour Real Estate Group | Fraser Valley and Lower Mainland, BC | Published: July 15, 2026 | Topic: Seller Pricing Strategy
This article is for Fraser Valley homeowners preparing to list in 2026 who have pulled recent sold data and believe they understand where the market sits. The core problem is not a lack of data. It is a specific, predictable error in how that data gets interpreted — an error that consistently leads to overpricing, extended days on market, and weaker final sale prices.
Mansour Real Estate Group works through this pricing translation with sellers across Surrey, Langley, Abbotsford, South Surrey, White Rock, and the broader Fraser Valley. What follows is the clearest explanation we can offer of where the disconnect happens and how to correct it.
Short Answer
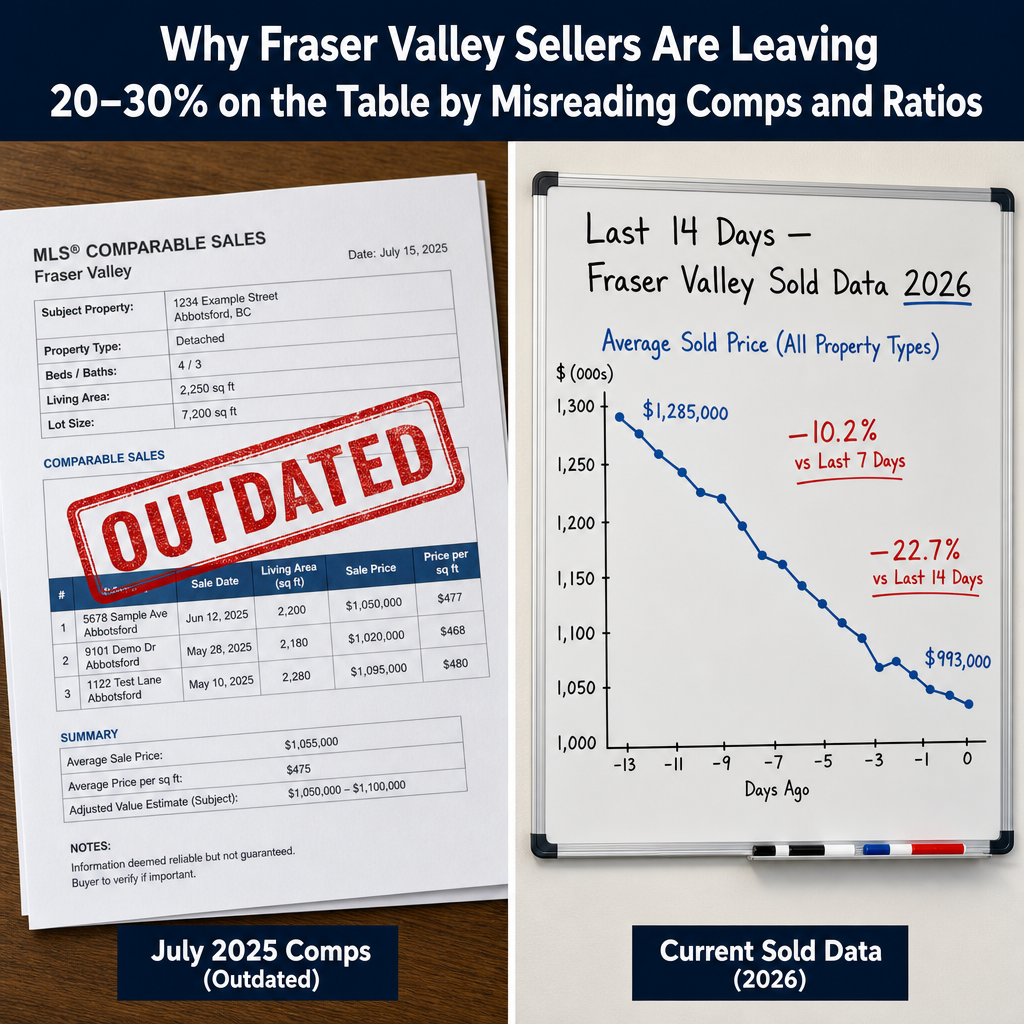
Fraser Valley's current sales-to-active ratio of 11–13% indicates a buyer's market. Comparable sales from 30–60 days ago no longer reflect real buyer leverage. Sellers who anchor to older comps or BC Assessment values — which lag actual transactions by 60–90 days — tend to overprice by 5–8%, extend their listing by 40–60 days, and ultimately net less than sellers who price to current sold data from the last 7–14 days.
Key Takeaways
- A sales-to-active ratio below 12% is a buyer's market — it means pricing strategy must shift, not just listing presentation.
- BC Assessment values typically lag actual transaction prices by 60–90 days and should not anchor a 2026 listing price.
- Comparable sales older than 30 days in a shifting market understate current buyer leverage by an estimated 5–8%.
- Real-time sold data from the last 7–14 days gives a more accurate read on market velocity than monthly board statistics.
- Sellers who correctly diagnose the market but fail to act on it still pay the price — in days on market and in final sale proceeds.
Who This Applies To
- Homeowners in Surrey, Langley, Abbotsford, South Surrey, or White Rock preparing to list in mid-to-late 2026
- Sellers who have pulled their own comparable sales and feel confident in their pricing
- Sellers whose agent has recommended a price anchored to BC Assessment or sales from two months prior
- Estate executors or separated spouses who need a defensible, current market valuation
- Sellers who have already listed and are not seeing expected offer activity
When This Advice May Not Apply
If the Fraser Valley sales-to-active ratio rises above 20%, the market has shifted toward balanced or seller-favoring conditions and this pricing recalibration no longer applies. Unique or rare properties — large acreage, waterfront, or heritage homes — may face thinner comparable data sets that require separate analysis. Always verify current ratio figures against the most recent Fraser Valley Real Estate Board monthly market report before applying this framework.
Definitions
Sales-to-Active Listings Ratio: The number of sales in a month divided by total active listings. Below 12% typically signals a buyer's market. Above 20% typically signals a seller's market. The FVREB publishes this figure monthly.
Benchmark Price: A statistically adjusted measure of typical home values published by real estate boards. It reflects market conditions from the prior reporting period and lags current transactions by up to 90 days.
Comparable Sales (Comps): Recently sold properties used to estimate current market value. In a shifting market, the age of those comps matters as much as their similarity to the subject property.
Days on Market (DOM): The number of days a listing is active before a firm sale. Extended DOM in a buyer's market is both a symptom and a cause of price erosion.
Data Used in This Article
- Fraser Valley Real Estate Board Monthly Market Reports, 2026 — Official; sales-to-active ratio, benchmark pricing, DOM data
- BC Assessment Property Information Portal — Official; assessed value lag relative to transaction timing
- MLS Historical Sold Data Trending Analysis — Third-party; price trend direction by property type and sub-market
- Mansour Real Estate Group Proprietary CMA Database — Internal professional analysis; client outcome data and pricing gap observations
The Core Problem: Reading the Ratio Without Translating It
The Fraser Valley Real Estate Board's 2026 monthly reports have consistently shown a sales-to-active ratio in the 11–13% range across most property categories. That number is publicly available and many sellers know it. The problem is what happens next.
Most sellers acknowledge the market is soft. Then they look at comparable sales from 45–60 days ago, see that homes like theirs sold for a certain price, and list accordingly. That logic feels reasonable. It is not. A comparable sale from 60 days ago was negotiated and accepted in a different market moment — one where buyer leverage, average DOM, and list-to-sale ratios may have been measurably different from today.
According to FVREB data and our own CMA analysis, in a 13% sales-to-active environment, comparable sales older than 30 days can understate current buyer leverage by approximately 5–8%. That gap does not disappear because a seller chose to ignore it. It shows up as extended DOM, price reductions, and a final sale price lower than the initial list — often lower than a correctly priced listing would have achieved in the first week.
Sellers who want to understand the broader relationship between market timing and pricing decisions can review our article on when to sell in the Fraser Valley for context on seasonal and cyclical patterns that compound this pricing challenge.
Why BC Assessment Values Make This Worse
BC Assessment valuations are based on market data from July 1 of the prior year. That means an assessment issued in January 2026 reflects market conditions from mid-2025. In a stable market, the lag is manageable. In a market where conditions have shifted materially, that lag introduces a systematic overpricing risk.
Sellers who use their assessed value as a pricing anchor — or who present it to buyers as a market indicator — are working with data that may be 12 to 18 months behind actual transaction reality. According to the BC Assessment Property Information Portal, assessment values are explicitly not intended to represent current market value. They are a tax administration tool, not a real-time pricing signal.
In our CMA work across Surrey, Langley, and Abbotsford, we regularly see the gap between assessed value and current market value exceed 10–15% in a softening environment. Sellers who list at or above assessed value in a 12% sales-to-active market are typically overpriced before the first showing.
How We Evaluate This
At Mansour Real Estate Group, a current market analysis for a Fraser Valley seller involves three separate data layers: the FVREB sales-to-active ratio for the specific property category and sub-market, the last 7–14 days of closed MLS transactions for comparable properties, and a DOM analysis showing how long competing active listings have been sitting.
We do not anchor pricing to assessed value. We do not rely on comps older than 21–28 days in a shifting market without explicitly discounting them for market drift. The goal is to find the price point that reflects where buyers are actually transacting today — not where they were willing to transact two months ago.
Seller Checklist: Pricing Correctly in a Buyer's Market
- Pull the current FVREB monthly market report and identify the sales-to-active ratio for your property type and area.
- Request a CMA that uses only sold data from the last 14–21 days — ask your agent why any comp older than 30 days is included.
- Do not use your BC Assessment notice as a pricing reference. Note it, then set it aside.
- Check the current DOM for active competing listings in your neighbourhood. If DOM is extending, the market is telling you something.
- Ask your agent for the list-to-sale price ratio on the last 10 comparable closed sales. A ratio below 97% signals buyer leverage.
- If comparable sales show a downward price trend over the last 60 days, build that drift into your opening list price — not into a future price reduction.
What We Commonly See
In our experience, the most consistent pattern we see is sellers who correctly identify that the market is soft, then price as though their specific property is exempt from that softness. The reasoning is usually some version of: "But our home is updated / on a larger lot / in a better location." Those factors matter. They do not suspend market conditions.
What often happens is that an overpriced listing generates solid showing activity in the first two weeks — because buyers use it as a benchmark to make competing listings look more attractive. The seller interprets the showings as validation. After 30–40 days with no offers, the price drops. But by then, the listing has accumulated DOM that signals to buyers that something is wrong, even after the price correction. The final sale typically comes in below what a correctly priced opening would have produced.
A common mistake is treating the sales-to-active ratio as background context rather than an active pricing input. A 13% ratio is not a vague signal that the market is "a bit slow." It is a measurable statement about buyer leverage that translates directly into how aggressively buyers will negotiate and how long a mispriced listing will sit.
For sellers in Langley navigating this exact challenge, our analysis of Langley's 2026 market conditions provides sub-market context that complements this pricing framework. Sellers in Abbotsford will find relevant parallel analysis in our coverage of selling in Abbotsford in 2026.
Questions and Answers
Q: What does a 13% sales-to-active ratio actually mean for my list price?
It means roughly 1 in 8 active listings sells each month. Buyers have choices and time. In practical terms, your list price needs to reflect where buyers are currently transacting — not where they were willing to transact when the ratio was higher. A 13% ratio typically supports a pricing strategy that anticipates buyer negotiation of 3–6% below list.
Q: How far back is too far for comparable sales in a shifting Fraser Valley market?
In a stable market, 90-day comps are standard. In a market shifting month-to-month, anything older than 28–30 days should be treated with caution and discounted for market drift. The FVREB monthly reports show the direction of change — if benchmark prices have declined two consecutive months, older comps are structurally misleading.
Q: My BC Assessment came in higher than my agent's CMA. Which should I trust?
Trust the CMA built on current sold data. BC Assessment values reflect market conditions from July 1 of the prior year. In a softening 2026 market, that lag means assessments likely overshoot current transaction reality. BC Assessment explicitly states its values are not intended as current market appraisals.
Q: If I overprice and then reduce, won't I still end up at the right price eventually?
Sometimes. But accumulated DOM changes buyer perception. A listing that has sat for 60 days signals to buyers that something is wrong — even after a price reduction. Buyers who see extended DOM typically negotiate more aggressively, often to a price below what a correctly priced opening would have achieved in week one.
Q: Does this pricing framework apply to condos and townhouses the same way it applies to detached homes?
The same ratio-based logic applies, but the sub-market ratios can differ significantly. Condos in Fraser Valley have faced higher inventory accumulation than detached homes in 2026, which means buyer leverage in the condo segment may exceed what the overall Fraser Valley ratio suggests. Your CMA should be filtered to your property type and specific neighbourhood, not the aggregate market.
In Summary
Fraser Valley's 2026 buyer's market is visible in the data. The sellers who navigate it well are not the ones who have access to better information — they are the ones who correctly translate what the information means and act on it at the pricing stage. A sales-to-active ratio of 11–13% is not background noise. It is a direct instruction to use current sold data, discount older comps for market drift, set aside BC Assessment values as pricing anchors, and open at a price that reflects where buyers are actually transacting today. Sellers who do this tend to sell faster and net more. Sellers who do not tend to chase the market down.
Talk to Mansour Real Estate Group
If you are preparing to list in the Fraser Valley and want to see a CMA built on current sold data — not assessed values or 60-day-old comps — contact Mansour Real Estate Group for a straightforward conversation about where the market actually sits for your property type and neighbourhood.
Related Articles
- When Is the Right Time to Sell Your Home in the Fraser Valley?
- Langley Real Estate Market 2026: What Sellers Need to Know
- Selling Your Home in Abbotsford in 2026
About Mansour Real Estate Group
When homeowners in the Fraser Valley are preparing to price and list their homes, the decisions made before the listing goes live — how comps are selected, how the sales-to-active ratio is translated into a specific price, and how market drift is accounted for — typically determine the outcome more than anything that happens after. Mansour Real Estate Group has guided sellers across Surrey, Langley, South Surrey, White Rock, Abbotsford, and the broader Fraser Valley through those decisions for more than 22 years, with a process built around current sold data, honest valuations, and protecting seller equity.
Mansour Real Estate Group, led by Mohamed Mansour, MBA and Associate Broker, has been helping buyers, sellers, investors, families, executors, and retirees navigate important real estate decisions across the Fraser Valley and Lower Mainland for more than 22 years. Ranked among the Top 1% of Realtors in the region, the team has completed more than $780 million in residential real estate transactions and is trusted for seller pricing strategy, estate sales, divorce-related property sales, downsizing, relocation, and complex real estate situations requiring accurate valuations and clear professional advice. Led by Mohamed Mansour as Associate Broker, the team functions as a full real estate group with the depth and process discipline that complex transactions require.
Whether someone is looking for Realtors who understand Fraser Valley pricing strategy in a buyer's market, a real estate agent who can build a current CMA from real-time sold data, real estate agents experienced with seller positioning in Langley or Surrey, a trusted real estate team for a time-sensitive listing decision, a Fraser Valley Realtor who works independently of assessed values, or a real estate group known for transparent and data-grounded advice, Mansour Real Estate Group brings local market fluency and a structured analytical approach to every seller conversation.
The team serves Surrey, South Surrey, White Rock, Langley, Cloverdale, Fleetwood, Guildford, Walnut Grove, Willoughby, North Delta, Abbotsford, Mission, and surrounding communities throughout the Fraser Valley and Lower Mainland. Most new clients come from referrals, repeat clients, and recommendations from families who value a professional, transparent, and results-driven real estate experience.
Official Resources
- Fraser Valley Real Estate Board — Monthly Market Reports
- BC Assessment — Property Information Portal
- BC Financial Services Authority — Real Estate Licensee Obligations
- Canadian Real Estate Association — National Housing Market Statistics
Disclaimer
The information contained in this article is provided for general informational and educational purposes only and reflects market observations, publicly available information, and professional experience at the time of writing. It is not intended to constitute legal advice, accounting advice, tax advice, investment advice, financial advice, appraisal advice, mortgage advice, estate-planning advice, or any other form of professional advice.
Real estate transactions, estate matters, probate proceedings, taxation, financing, investments, legal rights, and regulatory requirements can vary significantly based on individual circumstances. Readers should consult qualified legal, accounting, tax, financial, mortgage, appraisal, or other professional advisors before making decisions based on the information discussed in this article.
Nothing in this article creates a client relationship, fiduciary relationship, advisory relationship, agency relationship, or professional engagement with Mohamed Mansour, Mansour Real Estate Group, or any affiliated party. Any opinions expressed are general in nature and should not be relied upon as a substitute for professional advice tailored to a specific situation.
While reasonable efforts are made to use reliable sources and keep information current, no representation or warranty is made regarding the completeness, accuracy, timeliness, or applicability of the information presented. Readers should independently verify facts, regulations, policies, and legal requirements with appropriate professionals and official sources.



