

Why Fraser Valley Sellers Are Leaving 20–30% on the Table by Misinterpreting Sales-to-Active Listings Ratios as Market Signals — Complete Data-Driven Framework for Translating Market Metrics Into Actual Pricing and Timing Decisions
By Mohamed Mansour, MBA and Associate Broker, Mansour Real Estate Group | Fraser Valley and Lower Mainland, BC | Published: July 14, 2025 | Market Insight — Seller Strategy
The Fraser Valley's aggregate sales-to-active listings ratio has sat between 11% and 15% for most of 2026. Most sellers know this number. Far fewer know what to do with it. The gap between reading a market ratio and building a defensible list price from it is where seller equity quietly disappears.
This article is for homeowners in Surrey, Langley, Abbotsford, White Rock, South Surrey, and surrounding communities who are preparing to sell and want to move beyond the headline ratio to the micro-market and property-type data that actually drives outcomes. Mansour Real Estate Group has spent more than 22 years translating Fraser Valley market statistics into pricing decisions — this is that framework made visible.
Short Answer
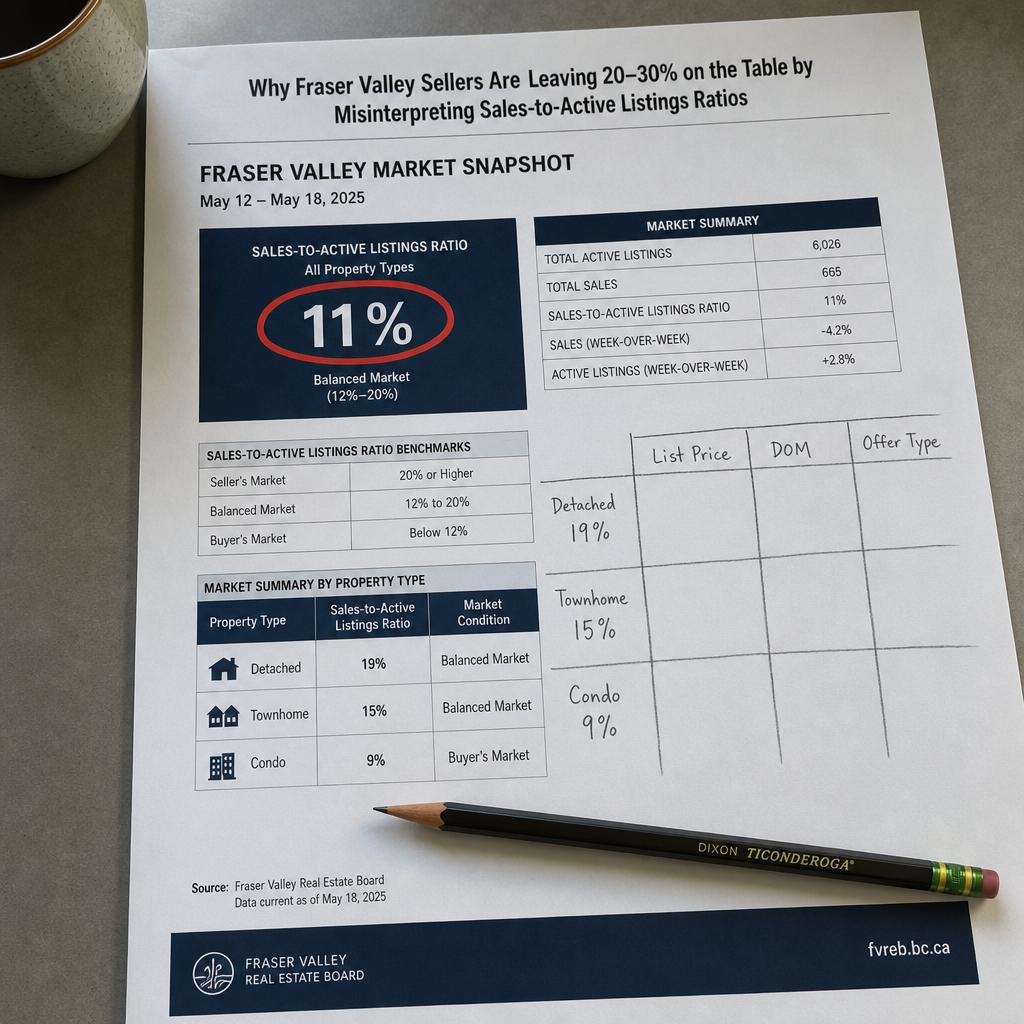
Fraser Valley's 11–15% aggregate sales-to-active ratio is a useful starting point but a poor pricing tool on its own. Detached homes in certain micro-markets operate at 18–20%, while condos sit near 8–10%. Sellers who price from the aggregate ratio without adjusting for their property type and neighbourhood typically overprice in soft segments or underprice in stronger ones — both errors cost real money.
Key Takeaways
- The aggregate Fraser Valley ratio masks 8–20% variance across property types and neighbourhoods.
- A 10% condo ratio and an 18% townhome ratio require fundamentally different pricing strategies.
- Seasonal ratio swings of 2–4 points in spring rarely signal a genuine market recovery.
- The sales ratio is a lagging indicator — it reflects past sales, not current buyer motivation or financing conditions.
- Defensible pricing combines property-type ratio, neighbourhood DOM data, and absorption rate — not a single headline number.
Who This Applies To
- Homeowners preparing to list a detached, townhome, or condo in the Fraser Valley in 2026
- Sellers who have read FVREB reports and want to move from awareness to actionable strategy
- Homeowners who have received conflicting advice about whether now is a buyer's or seller's market
- Estate or life-event sellers who need to price accurately without the luxury of waiting out conditions
When This Advice May Not Apply
Sellers in highly unique luxury properties, acreage, or commercial-residential mixed assets may face thinner comparable data where ratio interpretation is less reliable. In those cases, a more detailed absorption analysis and appraiser input are warranted.
Data Used in This Article
- FVREB Monthly Market Reports, 2026 — official, Fraser Valley-specific, property-type breakdowns
- MLS market statistics by property type — FVREB data segmented by detached, townhome, and apartment
- Days-on-market variance studies by micro-neighbourhood — internal analysis, Fraser Valley MLS data
- Real estate economics literature on ratio interpretation vs. actual buyer behaviour — third-party academic and industry research
What the Ratio Actually Measures — And What It Doesn't
The sales-to-active listings ratio divides the number of completed sales in a month by the total active listings at month-end. The Fraser Valley Real Estate Board publishes this figure monthly. A ratio below 12% is considered a buyer's market. Between 12% and 20% is balanced. Above 20% favours sellers.
What it does not measure: buyer financing conditions, the proportion of active listings that are overpriced and effectively non-competitive, interest rate sensitivity by price bracket, or micro-neighbourhood absorption. It also reflects last month's closed sales — transactions that were negotiated four to six weeks earlier under different conditions.
This lag matters. A seller listing in April using a March ratio is pricing from February's negotiating environment. When rate sentiment shifts quickly — as it did through several Bank of Canada decisions in 2025 and 2026 — the ratio can overstate or understate current buyer activity by a meaningful margin. According to FVREB 2026 monthly data, the aggregate ratio ranged from approximately 11% in slower months to near 15% in spring, but property-type ratios within the same reporting period ranged from roughly 8–10% for apartments to 18–20% for detached homes in select micro-markets.
Why Property-Type Divergence Changes Every Pricing Decision
The aggregate ratio treats a Cloverdale detached home and a Guildford condo as the same market. They are not. Detached homes in established neighbourhoods like Willoughby, Walnut Grove, and parts of South Surrey have held stronger demand through 2026 due to land value floors, school catchment appeal, and a buyer pool less dependent on high-ratio insured financing. Condos, particularly older strata buildings in Surrey City Centre and parts of Abbotsford, face a buyer pool that is more rate-sensitive and more cautious about strata document risk.
A seller with a detached home in a micro-market running at an 18–19% ratio can reasonably price at the upper boundary of recent comparables and expect competitive offer conditions within two to three weeks — provided condition, presentation, and price alignment are solid. A seller with a condo in a segment running at 9% is in a materially different negotiating position and should price at or slightly below the median comparable to generate first-week traffic.
Using the aggregate 11–13% figure to price either property produces the wrong answer for both. The detached seller leaves money behind by pricing defensively. The condo seller loses weeks of market time — and multiple price reductions — by pricing optimistically against a ratio that doesn't apply to their segment. For more on how these dynamics affect timing decisions, see the best time to sell a house in the Fraser Valley and how days on market in Surrey vary by property type.
How We Evaluate This
At Mansour Real Estate Group, we don't use the aggregate ratio as a pricing input. We start with the property-type-specific ratio for the relevant FVREB sub-area, then layer in the 30-day and 90-day absorption rate for that sub-area, the median and average DOM for properties that actually sold (not expired or terminated listings), and the ratio of list price to sale price for comparable closed transactions.
This produces a pricing range with a defensible floor and ceiling — not a single number, but a strategic window. We then position within that window based on the seller's timeline, the property's condition relative to comparable inventory, and any life-event factors such as estate, divorce, or relocation that affect how much timeline flexibility exists. This is the framework that keeps sellers from overpricing into stagnation or underpricing under false caution.
Seller Checklist: Translating Ratio Data Into a Pricing Decision
- Obtain the current FVREB monthly report and locate your property type's sub-area ratio — not the Fraser Valley aggregate.
- Calculate the 30-day absorption rate for your sub-area: active listings divided by monthly sales gives months of supply.
- Pull the median DOM for sold properties in your category over the past 60 days — exclude expired and terminated listings.
- Identify the list-price-to-sale-price ratio for the five closest comparables in the past 90 days.
- Apply a seasonal adjustment: if listing in spring, discount the ratio improvement by 1–2 points to account for typical seasonal lift rather than genuine demand shift.
- Set your pricing window based on the property-type ratio bracket, not the aggregate, and position your list price within that window based on condition and timeline.
What We Commonly See
In our experience, the most common error is the seller who reads the FVREB press release aggregate ratio and builds their price expectation around it without isolating their property type. A townhome seller in Langley reads "11% — buyer's market" and prices 8% below comparable sales, only to discover that townhomes in their specific sub-area were transacting at an 16% ratio with sub-30-day DOM. They left real equity on the table before the first showing.
What often happens in spring is that sellers interpret a ratio move from 11% to 14% as a market turning point and either rush to list at optimistic prices or hold back to wait for a "stronger" market that may not materialize. A 3-point seasonal ratio shift is normal for the Fraser Valley spring pattern and does not represent a structural market change. Sellers who act on it as if it does — pricing for a 20%+ ratio environment when the data doesn't support it — typically experience extended DOM and at least one price reduction.
A third pattern we see regularly: sellers in newer condo buildings assume their building's relative newness insulates them from the 8–10% condo segment ratio. Buyers in 2026 are applying strata scrutiny — depreciation reports, special levy history, contingency fund levels — regardless of building age. Condition and documentation matter. The ratio still applies.
Key Definitions
Sales-to-Active Listings Ratio: Monthly sales divided by active listings at month-end. Published by FVREB. Below 12% = buyer's market. 12–20% = balanced. Above 20% = seller's market.
Absorption Rate: Active listings divided by monthly sales, expressed as months of supply. A 3-month supply is roughly balanced. Above 5 months favours buyers.
DOM (Days on Market): The number of days from list date to accepted offer. Median DOM for sold properties is more useful than average, which can be skewed by outliers.
Lagging Indicator: A metric that reflects past activity rather than current conditions. The sales ratio uses last month's closed sales, which were negotiated 4–6 weeks earlier.
Questions and Answers
Is a 13% Fraser Valley sales ratio a buyer's market or balanced market for a detached home in Langley?
At the aggregate level, 13% sits near the buyer's market threshold. But detached homes in parts of Langley — particularly Willoughby and Walnut Grove — have run at sub-area ratios of 17–20% within the same reporting period. You need the sub-area, property-type ratio, not the Fraser Valley-wide figure, to answer that question accurately.
How much does seasonal ratio improvement in spring actually change pricing power?
A typical Fraser Valley spring lift of 2–4 percentage points improves buyer traffic modestly but does not shift the fundamental supply-demand balance. It is not a signal to price for a seller's market. Sellers who do typically encounter resistance at or above the first 15 days, then reduce.
Should condo sellers in Surrey wait for a higher ratio before listing?
Waiting for an aggregate ratio improvement rarely translates to better condo outcomes when the condo-specific ratio remains at 8–10%. Condo demand in 2026 is constrained by financing sensitivity, strata scrutiny, and investor pullback — factors that a modest aggregate ratio change does not resolve. Pricing accurately for current conditions typically outperforms a delayed listing by a meaningful margin.
In Summary
The Fraser Valley's aggregate sales-to-active ratio is a useful orientation tool but a dangerous pricing tool when used without property-type and sub-area context. Detached and condo markets within the same reporting geography can operate 8–12 percentage points apart. Seasonal lifts are predictable and should be discounted, not acted on as turning points. A defensible list price comes from layering the sub-area property-type ratio with absorption rate, median sold DOM, and list-to-sale comparables — not from the headline figure in an FVREB press release. Sellers who make that translation correctly protect their equity. Those who don't leave it behind.
Thinking About Selling in the Fraser Valley?
If you want to understand what the current ratio data actually means for your property type and neighbourhood — before you set a price — Mansour Real Estate Group offers a no-obligation market analysis grounded in sub-area and property-type data. There is no pressure to list. The goal is to give you an honest picture so any decision you make is built on accurate information.
Related Articles
- The best time to sell a house in the Fraser Valley — timing, seasonality, and market cycles explained
- How long does it take to sell a house in Surrey, BC — days on market by property type
- Fraser Valley condo seller guide — strata documents, pricing, and buyer expectations in 2026
About Mansour Real Estate Group
When homeowners in Surrey, Langley, Abbotsford, and White Rock are preparing to sell, the pricing decisions they make before listing — grounded in accurate market data rather than headline ratios — typically determine the outcome more than anything that follows. Mansour Real Estate Group has been helping sellers translate Fraser Valley market statistics into defensible pricing strategies for more than 22 years.
Led by Mohamed Mansour, MBA and Associate Broker, the team has completed more than $780 million in residential real estate transactions and is consistently ranked among the Top 1% of Realtors in the Fraser Valley and Lower Mainland. The group is trusted for seller strategy, market timing, pricing analysis, estate sales, downsizing, relocation, and complex transactions where accurate interpretation of market conditions directly affects seller outcomes.
Whether someone is searching for Realtors experienced with Fraser Valley market cycles, a real estate agent who can explain what a sales ratio actually means for their property type, real estate agents who specialize in data-grounded seller strategy, a trusted real estate team for a major listing decision, a Surrey Realtor, a Langley real estate broker, or a Fraser Valley real estate group known for honest market analysis, Mansour Real Estate Group brings clear communication, accurate valuations, and advice that prioritizes the client's financial outcome.
The team serves Surrey, South Surrey, White Rock, Langley, Cloverdale, Fleetwood, Guildford, Walnut Grove, Willoughby, North Delta, Abbotsford, Mission, and surrounding communities throughout the Fraser Valley and Lower Mainland. Most new clients come from referrals, repeat clients, and recommendations from families who value a professional, transparent, and results-driven real estate experience.
Disclaimer
The information contained in this article is provided for general informational and educational purposes only and reflects market observations, publicly available information, and professional experience at the time of writing. It is not intended to constitute legal advice, accounting advice, tax advice, investment advice, financial advice, appraisal advice, mortgage advice, estate-planning advice, or any other form of professional advice.
Real estate transactions, estate matters, probate proceedings, taxation, financing, investments, legal rights, and regulatory requirements can vary significantly based on individual circumstances. Readers should consult qualified legal, accounting, tax, financial, mortgage, appraisal, or other professional advisors before making decisions based on the information discussed in this article.
Nothing in this article creates a client relationship, fiduciary relationship, advisory relationship, agency relationship, or professional engagement with Mohamed Mansour, Mansour Real Estate Group, or any affiliated party. Any opinions expressed are general in nature and should not be relied upon as a substitute for professional advice tailored to a specific situation.
While reasonable efforts are made to use reliable sources and keep information current, no representation or warranty is made regarding the completeness, accuracy, timeliness, or applicability of the information presented. Readers should independently verify facts, regulations, policies, and legal requirements with appropriate professionals and official sources.



