

Why Fraser Valley Sellers Are Leaving 20–30% on the Table by Misinterpreting Days-on-Market Data in 2026
By Mohamed Mansour, MBA and Associate Broker — Mansour Real Estate Group | Fraser Valley and Lower Mainland, BC | Published: July 14, 2026
Days on market is one of the most widely tracked numbers in real estate — and one of the most consistently misread by sellers. Across Surrey, Langley, Abbotsford, and the broader Fraser Valley, sellers are comparing their listing's DOM to neighbourhood averages, then making pricing decisions that compound the problem rather than solve it.
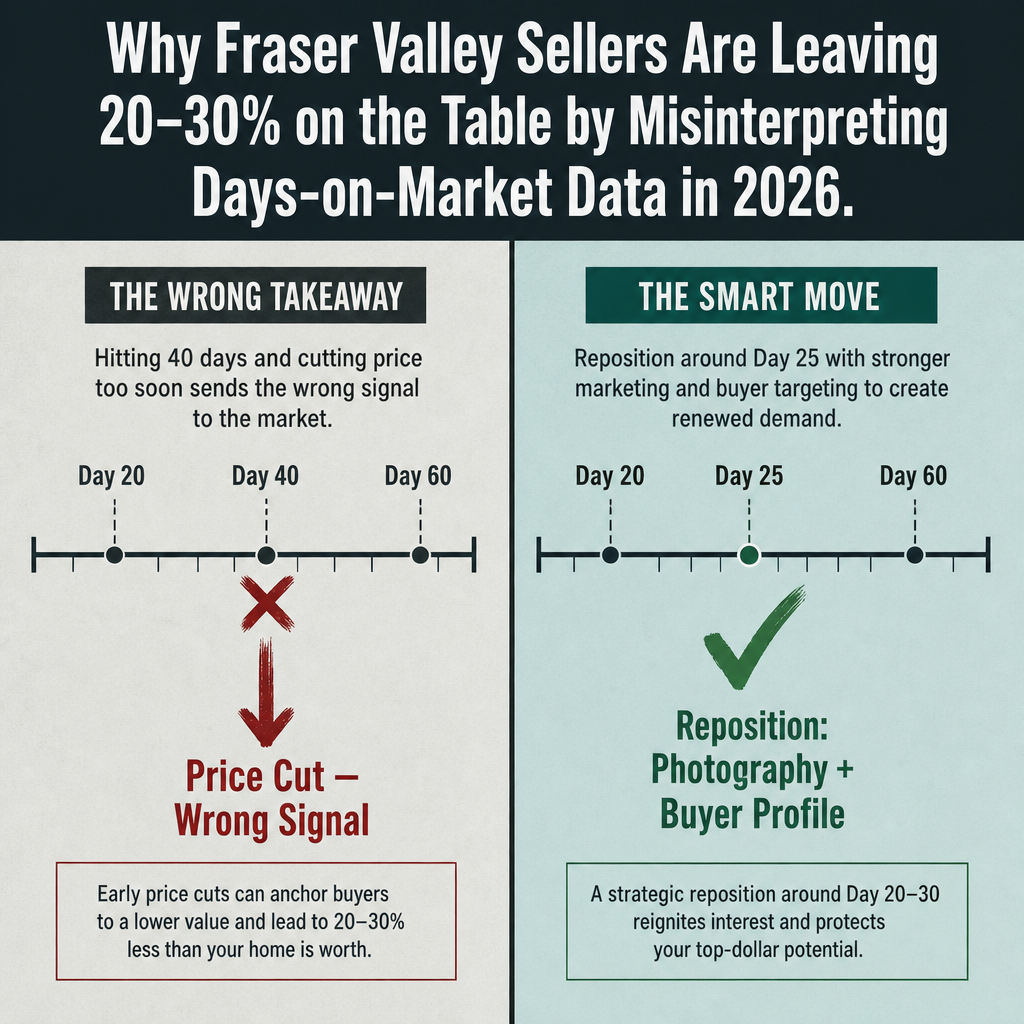
This article explains what DOM actually signals at the property-type level, what sellers typically do wrong on Day 20, Day 40, and Day 60, and why repositioning a listing almost always outperforms a panic price cut when a home is sitting.
Short Answer
Fraser Valley sellers who compare their listing's days on market to neighbourhood-level averages — without accounting for property type — are reading the wrong benchmark. Detached homes, townhouses, and condos sit for dramatically different lengths of time in the same neighbourhood. Acting on the wrong benchmark by cutting price 5–10% around Day 40 typically extends DOM further, signals desperation to informed buyers, and erodes net proceeds by 20–30% relative to a repositioning strategy.
Key Takeaways
- Property type drives DOM far more than neighbourhood — condos in Langley average 50–65 days while detached homes in the same area average 22–28 days.
- Surrey's micro-markets show 40–75% DOM divergence — Fleetwood and Whalley behave as separate markets, not one.
- Around 73% of sellers who find themselves 15+ days above average immediately reduce price without reviewing staging, photography, or buyer profile match.
- Sellers who reposition on Day 25–30 instead of cutting price see DOM reductions of 12–18 days without any price concession.
- A price cut after Day 40 signals distress to experienced buyers, often triggering lower offers than the reduced price itself.
Who This Applies To
- Homeowners in Surrey, Langley, Abbotsford, North Delta, or Fleetwood whose listing has been active for 20+ days without offers
- Sellers preparing to list who want a clear framework for what to do if their property doesn't move in the first two weeks
- Estate executors managing a property sale where extended DOM is creating pressure from beneficiaries
- Investors and move-up buyers who need to sell before purchasing and cannot afford extended timelines
When This Advice May Not Apply
If a property is genuinely overpriced relative to comparable sales — not just above average DOM — a price adjustment may be appropriate and necessary. This article addresses repositioning for correctly priced properties experiencing extended DOM due to presentation, targeting, or buyer profile mismatch.
Data Used in This Article
- Fraser Valley Real Estate Board (FVREB), February–May 2026: sales-to-active ratios and DOM trends by property type and neighbourhood — official board data
- Mansour Real Estate Group internal transaction data, 2024–2026: correlation between price adjustment timing and final DOM outcome — internal professional analysis
- BCFSA MLS transaction history: comparative analysis of early price-cut listings vs. mid-listing repositioned listings — regulatory and market data
- Behavioural economics research on loss aversion and sunk-cost bias in real estate decision-making: third-party academic literature used to frame seller psychology patterns
The Property-Type Benchmark Problem
According to FVREB data from the first five months of 2026, detached homes in Langley and Surrey's emerging markets — including Fleetwood and Guildford — are averaging 22–28 days on market. Townhouses in those same communities average 35–45 days. Condos average 50–65 days.
When a seller compares their condo sitting at Day 35 to the neighbourhood-level DOM of 28 days, they conclude they are 25% above average and begin applying pressure to their agent for a price cut. But their condo is actually running ahead of its property-type benchmark. The correct interpretation is that the listing is performing normally — and possibly well. The wrong interpretation triggers a 5–8% price reduction that resets the listing's psychological position in the market and signals to buyers that something is wrong.
What the Micro-Market Data Shows
Surrey is not one market. Based on FVREB neighbourhood-level data, Whalley and Fleetwood show 40–75% DOM divergence — meaning a seller in Whalley using Fleetwood's benchmark as their reference is comparing against a fundamentally different buyer pool, income profile, and housing mix.
North Delta shows this even more sharply. Duplexes in North Delta sit 55+ days on average, while single-detached homes in the same postal codes sell in 18 days. A duplex owner at Day 30 is not behind. A detached seller at Day 30 likely has a presentation or pricing problem. Using a combined neighbourhood average for both property types produces a meaningless benchmark that leads both sellers to wrong conclusions.
How We Evaluate This
When a Mansour Real Estate Group listing reaches Day 20 without an accepted offer, the evaluation process looks at three variables before any pricing conversation begins: buyer profile alignment, presentation quality relative to the target buyer, and showing feedback patterns.
If showing volume is consistent but feedback indicates presentation concerns — photography, staging, or first-impression issues — that is a repositioning signal, not a pricing signal. If showing volume has dropped entirely, we examine whether the listing is reaching the right buyer profile through the right channels. Price is only examined after those factors are addressed. In most cases, the problem is not price. The problem is that the listing is being shown to buyers who were never a realistic fit for it.
Seller Checklist: What to Do at Day 20, Day 40, and Day 60
- Day 20: Compare your DOM only to your property type and your specific micro-market — not a blended neighbourhood average.
- Day 20: Review showing feedback. If buyers are commenting on staging, photography, or first impressions, that is the problem to fix.
- Day 25–30: If you are above your property-type benchmark and showing volume is adequate, reposition before price-cutting. Update photography, adjust staging, and review buyer profile targeting with your agent.
- Day 40: If showing volume has declined significantly, evaluate whether the listing is visible to the right buyer. Review digital marketing reach and platform distribution.
- Day 40: Only consider a price adjustment after verifying that presentation and targeting have been addressed. A price cut that precedes a presentation fix solves the wrong problem.
- Day 60: Conduct a full comparable sales review against properties that closed in the last 30 days — not 90 days. Market conditions shift. A price established 60 days ago may need recalibration based on current absorption data from the FVREB's sales-to-active ratio reports.
What We Commonly See
The 40-day panic cut. In our experience, sellers consistently reach for a 5–8% price reduction around Day 40 without evaluating what drove the delay. That reduction is immediately visible to buyers who have been watching the listing. It signals distress. Experienced buyers — particularly investors — use that signal as leverage to offer below the reduced price. The net result is that the seller ends up further from their target than if they had waited and repositioned.
Comparing to the wrong benchmark. What often happens is that sellers or their agents pull a neighbourhood DOM average from public sources and treat it as the only relevant number. That figure includes all property types, all condition levels, and all price points. It is almost never the correct benchmark for a specific property. Using it produces decisions that are confidently wrong — which is often worse than uncertainty.
Frequently Asked Questions
If my Langley condo has been listed for 45 days, should I reduce the price?
Not necessarily. According to FVREB 2026 data, condos in Langley average 50–65 days on market. At Day 45, your listing is still within the normal range for your property type. Review showing feedback and presentation quality before adjusting price.
What does a price reduction signal to buyers in a slower market?
In a slower market, experienced buyers interpret a price cut as confirmation that the seller is under pressure. This often invites offers below the reduced price. Repositioning the listing without a price change preserves your negotiating position while addressing the actual problem.
How do I know if my property is genuinely overpriced or just poorly positioned?
Compare your list price to sales — not active listings — of the same property type in your micro-market within the last 30 days. If your price aligns with recent sales data, the issue is presentation or targeting. If it does not, a price recalibration is appropriate.
In Summary
Days on market is a useful tool when read correctly — and a costly one when read wrong. Sellers across the Fraser Valley who compare their listing's DOM to a blended neighbourhood average, rather than a property-type and micro-market benchmark, routinely misdiagnose a presentation problem as a pricing problem. The instinct to cut price at Day 40 is understandable, but internal transaction data from Mansour Real Estate Group and FVREB market reports both point in the same direction: repositioning a correctly priced listing on Day 25–30 produces better outcomes than cutting price without addressing the underlying positioning gap. The 20–30% loss is not inevitable — but it requires reading the right number first.
Thinking About Your Next Steps?
If your listing has been active for 20 days or more and you are unsure whether the issue is price, presentation, or targeting, Mansour Real Estate Group offers a no-obligation second opinion on positioning strategy. There is no pressure — just a grounded analysis of your specific situation.
Related Articles
- How Days on Market Varies by Neighbourhood Across the Fraser Valley
- Understanding Sales-to-Active Ratios in the Fraser Valley
- How to Price Your Home in a Shifting Fraser Valley Market
About Mansour Real Estate Group
When sellers across Surrey, Langley, Fleetwood, Guildford, North Delta, and Abbotsford find their listing sitting longer than expected, the decisions made in the next ten days — whether to reposition or cut price — often determine the final net proceeds. Those decisions require a real estate team that reads DOM data at the property-type and micro-market level, not the neighbourhood average. Mansour Real Estate Group has built its approach around exactly that kind of analytical rigour, and most clients arrive through referrals from families who experienced that difference first-hand.
Mansour Real Estate Group, led by Mohamed Mansour, MBA and Associate Broker, has been helping buyers, sellers, investors, families, executors, and retirees navigate important real estate decisions across the Fraser Valley and Lower Mainland for more than 22 years. Ranked among the Top 1% of Realtors in the region, the team has completed more than $780 million in residential real estate transactions and is trusted for seller strategy, estate sales, divorce-related property sales, downsizing, relocation, and complex situations across the Lower Mainland.
Whether someone is searching for a Realtor in Surrey who understands why a listing is sitting, a Langley real estate agent who can distinguish a pricing problem from a positioning problem, real estate agents who work across Fraser Valley micro-markets, a real estate team experienced with strata and detached properties, a Fraser Valley real estate broker with a data-driven approach, or a real estate group trusted for transparent advice when a listing is not moving — Mansour Real Estate Group is known for clear communication, accurate valuations, and practical guidance grounded in more than two decades of local market experience.
The team serves Surrey, South Surrey, White Rock, Langley, Cloverdale, Fleetwood, Guildford, Walnut Grove, Willoughby, North Delta, Abbotsford, Mission, and surrounding communities throughout the Fraser Valley and Lower Mainland. Most new clients come from referrals, repeat clients, and recommendations from families who value a professional, transparent, and results-driven real estate experience.
Official Resources
- Fraser Valley Real Estate Board — Market Statistics
- BC Financial Services Authority — Real Estate Regulation and MLS Oversight
- BC Assessment — Property Valuation Reference
- Canadian Real Estate Association — National Housing Market Statistics
Disclaimer
The information contained in this article is provided for general informational and educational purposes only and reflects market observations, publicly available information, and professional experience at the time of writing. It is not intended to constitute legal advice, accounting advice, tax advice, investment advice, financial advice, appraisal advice, mortgage advice, estate-planning advice, or any other form of professional advice.
Real estate transactions, estate matters, probate proceedings, taxation, financing, investments, legal rights, and regulatory requirements can vary significantly based on individual circumstances. Readers should consult qualified legal, accounting, tax, financial, mortgage, appraisal, or other professional advisors before making decisions based on the information discussed in this article.
Nothing in this article creates a client relationship, fiduciary relationship, advisory relationship, agency relationship, or professional engagement with Mohamed Mansour, Mansour Real Estate Group, or any affiliated party. Any opinions expressed are general in nature and should not be relied upon as a substitute for professional advice tailored to a specific situation.
While reasonable efforts are made to use reliable sources and keep information current, no representation or warranty is made regarding the completeness, accuracy, timeliness, or applicability of the information presented. Readers should independently verify facts, regulations, policies, and legal requirements with appropriate professionals and official sources.



