

Why Fraser Valley Benchmark Prices Have Diverged From Actual Selling Prices in 2026: How Sellers Should Recalibrate Pricing Strategy When Official BC Assessment Values Mask True Market Reality
By Mohamed Mansour, MBA and Associate Broker | Mansour Real Estate Group | Published: July 14, 2026 | Fraser Valley and Lower Mainland, BC
If you are preparing to sell a home in Surrey, Langley, Abbotsford, or anywhere across the Fraser Valley in 2026, you have probably looked up your property's benchmark price or BC Assessment value and found a number that feels higher than what comparable homes are actually selling for. That gap is not a coincidence, and it is not a sign that buyers are getting deals. It is a structural feature of how assessments and benchmark data are calculated — and understanding it is one of the most important steps a seller can take before deciding on a list price.
This article explains why official benchmark figures diverge from real transaction prices in a declining market, what that divergence looks like in the current Fraser Valley environment, and how sellers can recalibrate their pricing strategy to avoid the most common and costly mistake in a buyer's market: listing too high and sitting.
Short Answer
BC Assessment values are updated once annually using sales data from the prior 12 to 18 months. In the Fraser Valley's 2026 buyer's market — where the sales-to-active ratio sits near 11% and year-over-year prices have declined 7 to 10% — benchmark figures systematically overstate current property values. Sellers who anchor their list price to assessment benchmarks rather than current comparable sales are pricing above the market and typically spend 20 to 30 or more additional days on market as a result.
Key Takeaways
- BC Assessment values reflect market conditions from 12 to 18 months prior — not today's prices.
- In buyer's markets, assessments typically overstate current value by 5 to 12 percent.
- The Fraser Valley's 2026 sales-to-active ratio near 11% confirms a soft buyer's market with ongoing price pressure.
- Sellers anchored to benchmarks face extended days on market; current comparable sales are the correct pricing baseline.
- Neighbourhood-level divergence varies significantly — Langley detached homes and Surrey condos are not moving the same way.
Who This Applies To
- Homeowners in Surrey, Langley, Abbotsford, or South Surrey planning to list in 2026
- Sellers who received their BC Assessment notice and are using it as a pricing anchor
- Estate executors and family trustees managing property sales with formal valuation obligations
- Divorcing spouses or mediators seeking a fair-market-value starting point
- Sellers who have already listed near benchmark and have seen little or no offer activity
When This Advice May Not Apply
In a strong seller's market with rising prices, assessments may actually understate current value, and benchmark pricing carries different risks. This article addresses the 2026 buyer's market conditions specific to the Fraser Valley. If market conditions shift significantly, the sizing of the assessment gap will change. Always confirm current conditions with a local real estate professional before drawing conclusions from this article alone.
Data Used in This Article
- BC Assessment: Annual assessment methodology documentation; valuation date of July 1 in the prior year — official source
- Fraser Valley Real Estate Board (FVREB): Monthly market reports, April and May 2026 — official board data
- CMHC and BCREA: Sales-to-active listings ratio interpretation frameworks — regulatory and industry guidance
- MLS historical records: Days-on-market analysis by neighbourhood, March to April 2026 — third-party MLS data
How BC Assessment Values Are Calculated — and Why the Lag Matters
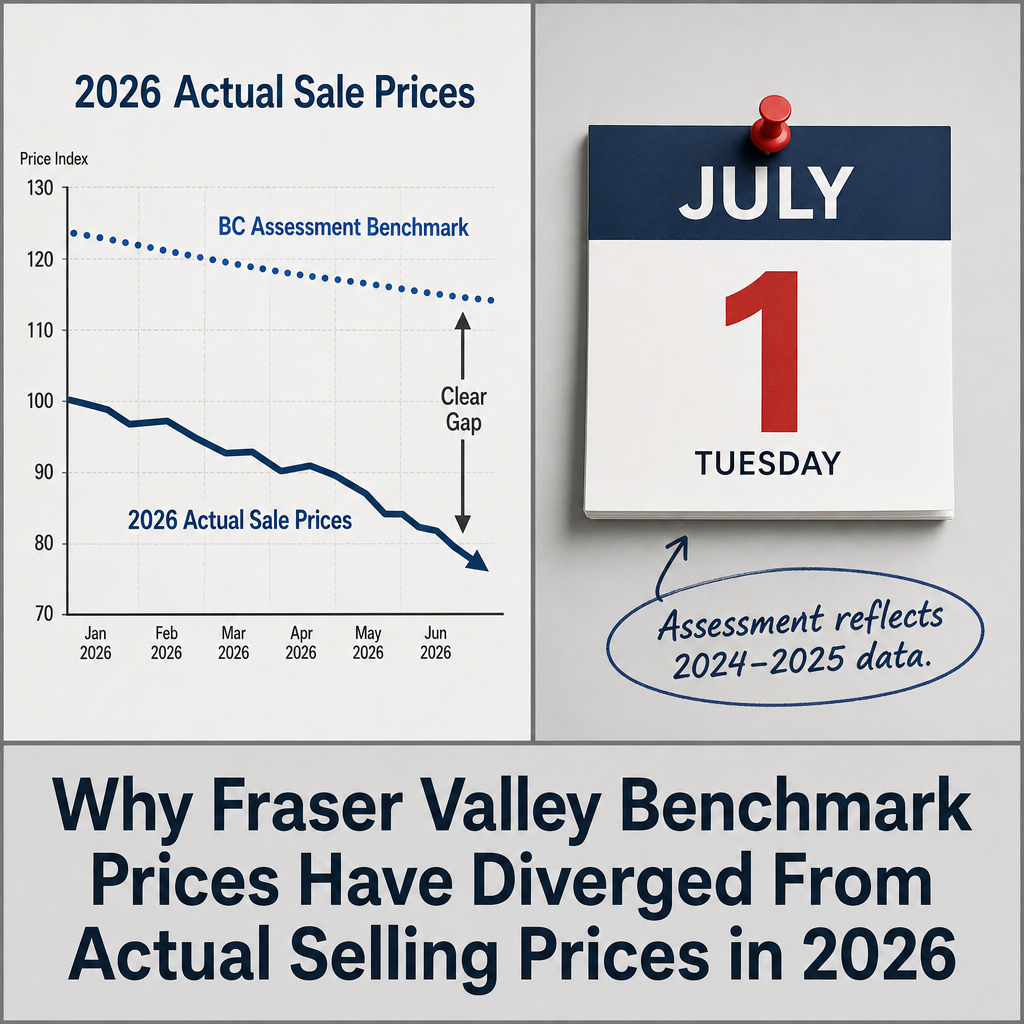
According to BC Assessment's published methodology, every property in British Columbia is assessed using a valuation date of July 1 of the prior year. The 2026 assessment roll, which homeowners received in January 2026, reflects sale prices from approximately July 2024 through mid-2025 — a period when Fraser Valley prices were measurably higher than they are today.
This is not an error in the system. It is how mass appraisal works at scale across hundreds of thousands of properties. BC Assessment uses statistical modelling based on a sample of arm's length sales to estimate values across comparable property groups. That model cannot capture intra-year price movements, neighbourhood-specific days-on-market trends, or the psychology of a buyer pool that has shifted from competitive to cautious.
The result is a structural lag that becomes most visible at market turning points. In 2021 and 2022, assessments were actually understating values because prices were rising faster than the update cycle. In 2026, the reverse is true. With Fraser Valley year-over-year prices declining 7 to 10% across many segments, the July 1, 2025 valuation date means assessments are reflecting a market that no longer exists.
What the Sales-to-Active Ratio Tells Sellers About the Divergence
The sales-to-active listings ratio is one of the most reliable indicators of whether current prices are moving up, down, or sideways. According to frameworks used by CMHC and BCREA, a ratio below 15% generally indicates a buyer's market — one where supply exceeds demand and sellers face downward price pressure. The Fraser Valley's April and May 2026 FVREB reports show a ratio near 11%, which places the market firmly in buyer's market territory.
At that ratio, benchmark prices — which themselves lag current conditions — tend to overstate actual transaction values by 5 to 12%. The precise gap depends on property type and neighbourhood. Detached homes in Willoughby or Walnut Grove may sit closer to the lower end of that range, while attached condos in Surrey or Abbotsford — where inventory has built up more quickly — may sit at the higher end.
What this means practically: a seller in North Delta whose benchmark reads $1,100,000 may be looking at a real transaction range closer to $990,000 to $1,040,000 based on current comparables. A seller who lists at $1,099,000 because it feels just under benchmark is still overpriced relative to where the market is transacting today.
Neighbourhood-Level Divergence: Why Fleetwood Is Not Guildford Is Not White Rock
One of the less-discussed problems with relying on Fraser Valley benchmark figures is that they aggregate across large geographic areas. Days-on-market data from MLS historical records for March to April 2026 show divergence of 40 to 80% across Fraser Valley suburbs. A detached home in a school catchment with high demand in Langley's Willoughby may move in 18 to 25 days. A comparable-priced townhome in Cloverdale or Fleetwood may sit for 45 to 60 days in the same month.
That divergence affects list-price strategy directly. In faster-moving micro-markets, a seller can price closer to benchmark because buyers are more competitive. In slower micro-markets, strategic underpricing relative to benchmark is often the correct approach — not to give value away, but to generate activity and subject-free offers before the listing goes stale. The benchmark figure does not tell you which situation you are in. Only current comparable sales, neighbourhood-level absorption rates, and days-on-market trends can do that.
How We Evaluate This
At Mansour Real Estate Group, we do not start a seller consultation by pulling a benchmark figure or BC Assessment value. We start by building a current comparable sales analysis using arm's length transactions from the past 30 to 60 days in the same neighbourhood, same property type, and same price range — not the past six months, and not across the broader municipality.
We then cross-reference that against active competing listings, current days-on-market by price tier, and the sales-to-active ratio for that specific property category. The benchmark and assessment figures enter the conversation as a reference point for buyer perception — because buyers do see those numbers — but they do not anchor our pricing recommendation. In a market where conditions are moving faster than the assessment cycle, that distinction protects seller equity.
Seller Checklist: Recalibrating From Benchmark to Market Reality
- Pull current comparable sales from the past 30 to 45 days — not the past six months — in your specific neighbourhood and property type.
- Note the current sales-to-active ratio for your property category from the most recent FVREB monthly report.
- Calculate average days on market for sold properties at your price tier — any number above 30 days signals buyer hesitation at that range.
- Apply a 5 to 12% discount to your BC Assessment or benchmark figure as a starting reference, depending on property type and neighbourhood absorption rate.
- Identify active competing listings — your real competition is not sold prices but what buyers are comparing your home to right now.
- Confirm your target list price positions you as competitive within the current active set, not merely below benchmark.
- Set a 14-day review trigger: if you have showings but no offers after two weeks, the price is the problem — adjust before the listing goes stale.
What We Commonly See
In our experience working with Fraser Valley sellers in 2026, three patterns repeat with enough frequency that they are worth naming directly.
The benchmark anchor: A seller lists at or near their benchmark price — which feels like a reasonable, evidence-based number — and then receives consistent showing activity but no offers. The problem is almost always pricing. What feels modest to the seller reads as overpriced to buyers who are actively comparing to the 10 to 12 other listings in that neighbourhood that week.
The assessment defence: When we recommend pricing below assessment, some sellers resist because they believe the assessed value represents a floor. It does not. BC Assessment values are not guarantees of market value and are not intended to be used as list-price anchors. They are administrative estimates for property tax purposes, calculated on last year's market conditions.
The stale listing problem: A home that has been on the market for 45 or more days in 2026 has a perception problem that price reductions alone cannot fully solve. Buyers ask why it has not sold. Resetting that perception — sometimes by withdrawing and re-listing — is possible, but it costs time and negotiating leverage. The seller who lists correctly from day one avoids the problem entirely.
Questions and Answers
Is my BC Assessment value a reliable indicator of what my home will sell for in 2026?
Not in the current Fraser Valley market. BC Assessment values reflect July 1, 2025 market conditions — a period when prices were measurably higher. With year-over-year declines of 7 to 10% across many segments, assessments are a lagging indicator, not a current market price guide.
How do I find out what my home is actually worth in 2026?
A comparative market analysis built on arm's length sales from the past 30 to 45 days in your specific neighbourhood is the most reliable starting point. A qualified local real estate agent can also layer in days-on-market data and current competing listings to sharpen the picture.
Why do benchmark prices and actual selling prices diverge more in some Fraser Valley neighbourhoods than others?
Absorption rates vary significantly across the Fraser Valley. Neighbourhoods with higher demand relative to inventory — like parts of Willoughby or South Langley — see less divergence. Areas with higher condo inventory or slower-moving attached product, such as parts of Surrey or Abbotsford, tend to show larger gaps between benchmark and actual transaction prices in a buyer's market.
In Summary
BC Assessment values and Fraser Valley benchmark figures are lagging indicators — useful context, but not reliable list-price anchors in a buyer's market. With the Fraser Valley's 2026 sales-to-active ratio near 11% and year-over-year prices down 7 to 10% across many segments, sellers who anchor to benchmark figures are pricing above where buyers are transacting and paying for it in days on market, reduced negotiating leverage, and in some cases, stale listings that require price reductions that could have been avoided. The correct pricing baseline in 2026 is current comparable sales from the past 30 to 45 days — neighbourhood-specific, property-type-specific, and anchored to what is actually happening this month, not what happened last year.
Talk to the Mansour Real Estate Group Team
If you are preparing to sell in the Fraser Valley and want a pricing analysis built on current comparable sales rather than lagging benchmark figures, Mansour Real Estate Group offers a straightforward consultation. There is no obligation and no pressure — just an honest, data-grounded conversation about where your home sits relative to the market right now.
Related Articles
- Fraser Valley Real Estate Market 2026: What Sellers Need to Know Before Listing
- How to Price Your Home in Surrey in 2026
- Selling a Condo in Surrey or Langley: What to Know Before You List
Official Resources
- BC Assessment — Property Assessment Methodology
- Fraser Valley Real Estate Board — Monthly Market Statistics
- BC Real Estate Association — Economics and Market Analysis
- CMHC — Housing Market Assessment Framework
About Mansour Real Estate Group
Pricing a home correctly in the Fraser Valley requires more than a comparative market analysis. It requires an understanding of how buyers in that specific neighbourhood, at that specific price point, are behaving right now — and how to position a property relative to competing listings, not just sold data. Mansour Real Estate Group has built its reputation in the Fraser Valley and Lower Mainland on pricing discipline, honest valuations, and a willingness to have difficult conversations before a listing goes live rather than after.
Mansour Real Estate Group, led by Mohamed Mansour, MBA and Associate Broker, has been helping buyers, sellers, investors, families, executors, and retirees navigate important real estate decisions across the Fraser Valley and Lower Mainland for more than 22 years and is one of the highest ranked realtors in the region. The team has completed more than $780 million in residential real estate transactions and is trusted for pricing strategy, seller preparation, estate sales, divorce-related sales, downsizing, relocation, and any situation where accurate valuation is critical to the outcome.
Whether someone is searching for Realtors experienced with accurate pricing in a buyer's market, a real estate agent who understands local Fraser Valley conditions, real estate agents who specialize in seller strategy, a trusted real estate team for a pricing-sensitive sale, a Surrey Realtor, a Langley real estate broker, or a real estate group that serves the Fraser Valley and Lower Mainland, Mansour Real Estate Group is known for data-driven recommendations, honest market context, and a process that protects sellers from the most common and costly pricing mistakes.
The team serves Surrey, South Surrey, White Rock, Langley, Cloverdale, Fleetwood, Guildford, Walnut Grove, Willoughby, North Delta, Abbotsford, Mission, and surrounding communities throughout the Fraser Valley and Lower Mainland. Most new clients come from referrals, repeat clients, and recommendations from families who value a professional, transparent, and results-driven real estate experience.
Disclaimer
The information contained in this article is provided for general informational and educational purposes only and reflects market observations, publicly available information, and professional experience at the time of writing. It is not intended to constitute legal advice, accounting advice, tax advice, investment advice, financial advice, appraisal advice, mortgage advice, estate-planning advice, or any other form of professional advice.
Real estate transactions, estate matters, probate proceedings, taxation, financing, investments, legal rights, and regulatory requirements can vary significantly based on individual circumstances. Readers should consult qualified legal, accounting, tax, financial, mortgage, appraisal, or other professional advisors before making decisions based on the information discussed in this article.
Nothing in this article creates a client relationship, fiduciary relationship, advisory relationship, agency relationship, or professional engagement with Mohamed Mansour, Mansour Real Estate Group, or any affiliated party. Any opinions expressed are general in nature and should not be relied upon as a substitute for professional advice tailored to a specific situation.
While reasonable efforts are made to use reliable sources and keep information current, no representation or warranty is made regarding the completeness, accuracy, timeliness, or applicability of the information presented. Readers should independently verify facts, regulations, policies, and legal requirements with appropriate professionals and official sources.



