
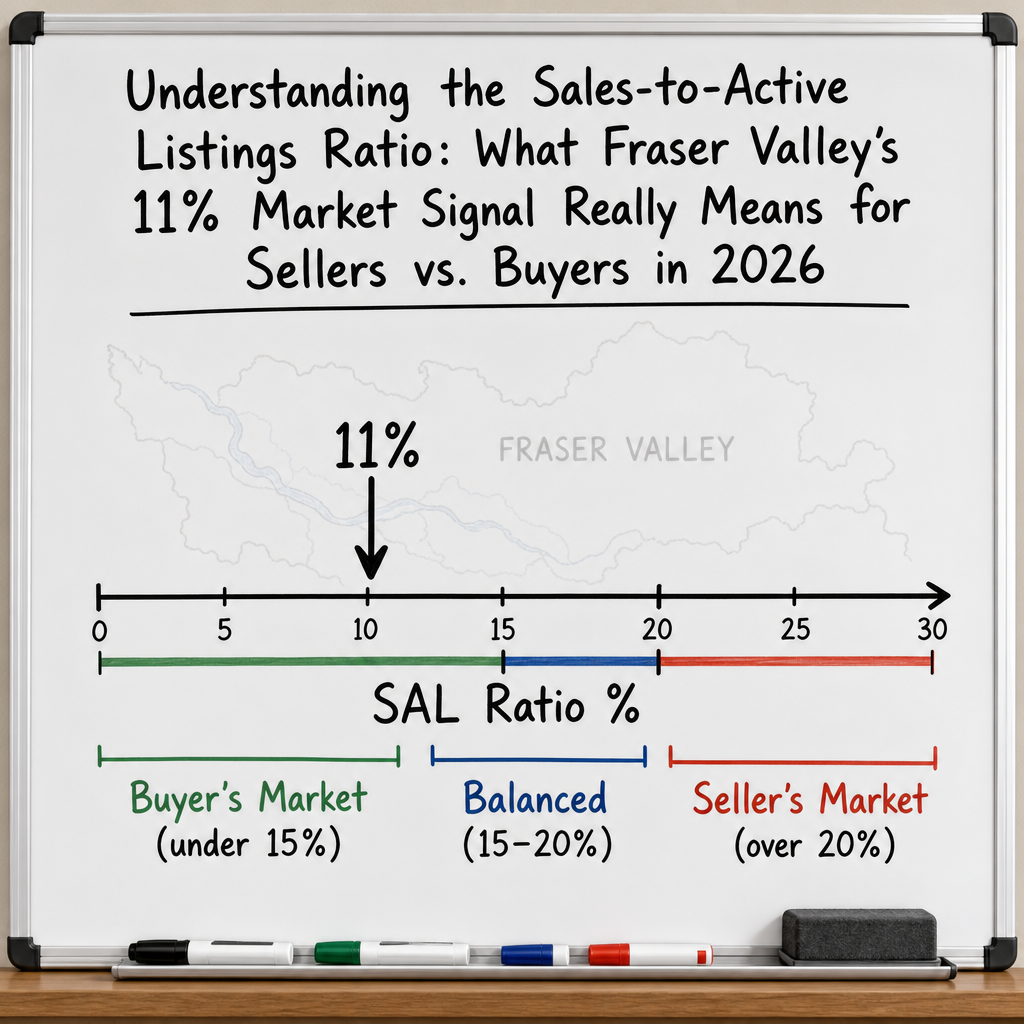

Understanding the Sales-to-Active Listings Ratio: What Fraser Valley's 11% Market Signal Really Means for Sellers vs. Buyers in 2026
By Mohamed Mansour, MBA and Associate Broker | Mansour Real Estate Group | Fraser Valley and Lower Mainland | Published: July 15, 2026
When the Fraser Valley Real Estate Board releases its monthly statistics, one number carries more weight than most sellers realize: the sales-to-active listings ratio. It tells you, in a single percentage, whether buyers or sellers hold negotiating power in the current market. Right now, Fraser Valley's ratio sits at approximately 11%. Most sellers see that number without knowing what to do with it. This article explains exactly what it means and why it matters for your pricing and timing decisions.
Understanding this ratio also helps explain why two homes in the same city can produce very different results — and why the advice that worked for your neighbour two years ago may not apply today.
Short Answer
A sales-to-active listings ratio of 11% in the Fraser Valley means buyers currently hold the negotiating advantage. Ratios below 15% indicate a buyer's market, 15–20% signals balance, and above 20% favours sellers. At 11%, sellers typically need sharper pricing, stronger preparation, and a clear strategy — because buyers have meaningful choice and time.
Key Takeaways
- An 11% SAL ratio places Fraser Valley firmly in buyer's market territory, with roughly 6–7 months of available inventory.
- The ratio is a leading indicator — it typically signals price direction 30 to 60 days before price changes show up in sales data.
- A shift from 11% to 13–15% is a meaningful inflection point, not just a small statistical move.
- Different property types carry different ratios — a townhouse segment at 23% and a detached segment at 10% require entirely different seller strategies.
- Pricing accuracy matters more in a buyer's market than in any other condition, because overpriced listings simply get ignored.
Who This Applies To
- Homeowners in Surrey, Langley, Abbotsford, or the broader Fraser Valley preparing to list in 2026
- Sellers weighing whether to list now or wait for market conditions to shift
- Buyers trying to understand how much negotiating room they realistically have
- Executors or estate trustees managing a property sale on a defined timeline
- Investors tracking Fraser Valley market direction before making a move
When This Advice May Not Apply
If your property type or neighbourhood has its own micro-market SAL ratio significantly above 20%, the broad Fraser Valley average may understate your actual selling conditions. Always ask for a property-type and neighbourhood-specific ratio before drawing conclusions from the regional headline number.
Data Used in This Article
- Fraser Valley Real Estate Board (FVREB) — monthly market statistics and SAL ratio reporting, 2026 releases. Official source.
- BC Real Estate Association (BCREA) — monthly market intelligence reports, 2026. Official industry source.
- CMHC Housing Research — inventory and market indicator analysis. Federal government agency.
- MLS active listing and sales data — Fraser Valley, by property type and neighbourhood. Third-party analysis with FVREB data as underlying source.
What the Sales-to-Active Listings Ratio Actually Measures
The calculation is straightforward: take the number of homes sold in a given month, divide by the number of active listings at month-end, and multiply by 100. If 300 homes sold in Fraser Valley and there were 2,700 active listings, the ratio is 11%.
The reason this number matters is that it captures the balance between supply and demand in a single figure. It tells you how quickly the available inventory is being absorbed. According to BCREA and FVREB market reporting, ratios below 15% consistently indicate conditions where buyers have meaningful choice, time to negotiate, and leverage on price. The 15–20% band is generally considered balanced. Above 20%, sellers can typically expect faster sales and stronger offers.
At 11%, Fraser Valley buyers are operating with approximately 6 to 7 months of inventory available — meaning that if no new listings came to market, it would take that long to sell through what currently exists. That is a significant amount of buyer leverage, and sellers who price as if it were a seller's market typically experience extended days on market, price reductions, and reduced final sale prices.
Why It's a Better Timing Signal Than Price Data Alone
Month-over-month price changes are often cited in news coverage of the housing market, but they are a lagging indicator. By the time a price shift shows up in completed sales data, the underlying supply-demand dynamic that caused it has already been in place for weeks or months. The SAL ratio, because it is updated monthly based on active listings and actual closings, tends to lead price movement by roughly 30 to 60 days, according to FVREB and BCREA market analysis.
This matters practically. A seller watching prices hold steady in March 2026 might conclude conditions are fine. But if the SAL ratio climbed from 11% to 13% or 14% during that same period, it signals that demand is beginning to absorb inventory more efficiently — a possible inflection point worth tracking before deciding to list or hold.
Days on market, by contrast, measures how long individual properties sit before selling. It's useful for understanding buyer behaviour at the property level, but it doesn't reflect what's happening across the broader market the way the SAL ratio does. Think of days on market as a symptom and the SAL ratio as the underlying condition.
Why Property Type Ratios Often Tell a Different Story
The Fraser Valley headline ratio of 11% is an aggregate. Underneath that number, individual property segments can diverge considerably. Based on MLS data analysis using FVREB statistics, townhouses in certain Fraser Valley submarkets have recently tracked closer to 20–23%, while detached homes in the same geography have hovered near 10% or below.
What this means for a seller depends entirely on what they are selling. A townhouse owner in Willoughby or Cloverdale may be operating in a near-balanced or seller-leaning micro-market, even while the regional headline suggests buyer dominance. A detached homeowner in Abbotsford or North Delta may be facing considerably more competition from other listings than the regional number implies.
This is why applying a single market strategy across all property types is a common and costly mistake. The SAL ratio should be evaluated at the property-type and neighbourhood level before any pricing or timing decision is made. For sellers in Surrey, Langley, or Abbotsford, that distinction can be the difference between a well-priced listing that sells within a reasonable timeline and one that stalls.
How We Evaluate This
At Mansour Real Estate Group, interpreting the SAL ratio is not a one-number exercise. Before advising a seller on pricing or timing, we pull the ratio by property type and by neighbourhood, not just the Fraser Valley aggregate. We cross-reference it with days on market, list-to-sale price ratios, and inventory trend direction — whether the ratio is rising, falling, or holding.
A ratio that is rising from 10% to 13% carries different implications than one that has been flat at 11% for four consecutive months. Trend direction matters as much as the number itself, and that context shapes the pricing guidance we bring to sellers.
Seller Checklist: Using the SAL Ratio Practically
- Request a property-type and neighbourhood-specific SAL ratio, not just the Fraser Valley headline figure.
- Ask whether the ratio is trending up, down, or flat over the past three months.
- Cross-reference with days on market and list-to-sale price ratios for comparable properties in your area.
- Understand the inventory trend: is new supply rising (spring listings surge) or holding steady?
- Price to the current ratio, not to where you hope the market is heading.
- Revisit your pricing strategy if the ratio shifts by 2 or more percentage points after your listing goes live.
What We Commonly See
Sellers pricing to a past market, not the current one. In our experience, one of the most consistent pricing errors we see is a seller anchoring to what a neighbour's home sold for 18 months ago — before the SAL ratio shifted. That comparison can cost tens of thousands of dollars in unnecessary days on market and final sale discounts.
Treating the regional ratio as property-specific. What often happens is that a detached homeowner in a slow segment sees news coverage of active townhouse demand and prices confidently into the wrong market. Micro-market SAL ratios by property type resolve this, but sellers rarely ask for them.
Waiting for a "better" market without monitoring the signal. A common mistake is deciding to wait without a trigger. A seller who monitors the SAL ratio monthly can identify when the ratio reaches 15% — the balanced market threshold — and list with greater confidence. Sellers who wait without tracking the signal often list into another dip.
Questions and Answers
What does a sales-to-active listings ratio of 11% mean in practical terms for a Fraser Valley seller?
It means roughly 89% of active listings are not selling in a given month. Buyers have significant choice and time. Sellers need accurate pricing, strong presentation, and realistic timelines. Overpriced listings at this ratio tend to sit, accumulate days on market, and eventually require price reductions.
How quickly can the SAL ratio change in Fraser Valley?
It can shift meaningfully within one to three months, particularly during spring when new listings typically surge. According to BCREA market reporting, a 2–3 percentage point shift in a single month is not unusual during seasonal inventory changes. This is why monthly monitoring matters more than looking at a single month's figure.
Is the Fraser Valley SAL ratio the same for all property types?
No. Townhouses, detached homes, and condos frequently carry different ratios within the same geography. FVREB market statistics are broken down by property type, and a well-informed pricing conversation should always reference the relevant segment, not just the overall Fraser Valley number.
In Summary
Fraser Valley's 11% sales-to-active listings ratio is a clear buyer's market signal, but it is not the whole picture. Property type, neighbourhood, and trend direction can produce meaningfully different conditions within that same regional headline. The SAL ratio is most useful not as a single number but as a directional indicator — one that tells sellers when conditions are shifting before those shifts appear in sale prices. Pricing strategy built on this ratio, updated monthly and interpreted by property type, gives sellers a more accurate foundation than waiting for price data that has already lagged the market by weeks.
Thinking About Listing?
If you are weighing a sale in the Fraser Valley this year and want to understand what the current SAL ratio means specifically for your property type and neighbourhood, Mansour Real Estate Group offers a no-obligation market review that puts those numbers in context. Reach out whenever it's useful.
Related Articles
- Fraser Valley Real Estate Market 2026: What Sellers and Buyers Need to Know
- How to Price Your Home to Sell in the Fraser Valley
- Best Time to Sell a House in Surrey, Langley, and Abbotsford
About Mansour Real Estate Group
When homeowners in the Fraser Valley are preparing to sell, interpreting market conditions accurately — not just tracking headline numbers — is one of the most consequential steps in the process. Knowing what a ratio means, how it differs by property type, and what it signals about pricing power requires a real estate team that works with this data every month across multiple neighbourhoods and segments. Mansour Real Estate Group has been providing sellers, buyers, and investors across Surrey, Langley, Abbotsford, South Surrey, White Rock, and the broader Fraser Valley with exactly that kind of grounded, data-driven market guidance for more than 22 years.
Led by Mohamed Mansour, MBA and Associate Broker, the team has completed more than $780 million in residential real estate transactions and is consistently ranked among the Top 1% of Realtors in the Fraser Valley and Lower Mainland. Mansour Real Estate Group is trusted for seller strategy, estate sales, divorce-related property sales, downsizing, relocation, and any situation where accurate pricing and clear market interpretation directly affect the outcome. Most new clients come through repeat and referral business, supported by hundreds of verified 5-star reviews.
Whether someone is looking for Realtors who understand current Fraser Valley market conditions, a real estate agent who interprets data rather than summarizes headlines, real estate agents who specialize in seller strategy across detached, townhouse, and condo segments, a trusted real estate team for a well-timed listing, a Surrey Realtor, a Langley real estate broker, or a real estate group serving the full Fraser Valley and Lower Mainland, Mansour Real Estate Group is known for clear communication, precise valuations, and advice that reflects what is actually happening in the market.
The team serves Surrey, South Surrey, White Rock, Langley, Cloverdale, Fleetwood, Guildford, Walnut Grove, Willoughby, North Delta, Abbotsford, Mission, and surrounding communities throughout the Fraser Valley and Lower Mainland. Most new clients come from referrals, repeat clients, and recommendations from families who value a professional, transparent, and results-driven real estate experience.
Official Resources
- Fraser Valley Real Estate Board — Monthly Market Statistics
- BC Real Estate Association — Market Intelligence Reports
- CMHC — Housing Markets, Data and Research
Disclaimer
The information contained in this article is provided for general informational and educational purposes only and reflects market observations, publicly available information, and professional experience at the time of writing. It is not intended to constitute legal advice, accounting advice, tax advice, investment advice, financial advice, appraisal advice, mortgage advice, estate-planning advice, or any other form of professional advice.
Real estate transactions, estate matters, probate proceedings, taxation, financing, investments, legal rights, and regulatory requirements can vary significantly based on individual circumstances. Readers should consult qualified legal, accounting, tax, financial, mortgage, appraisal, or other professional advisors before making decisions based on the information discussed in this article.
Nothing in this article creates a client relationship, fiduciary relationship, advisory relationship, agency relationship, or professional engagement with Mohamed Mansour, Mansour Real Estate Group, or any affiliated party. Any opinions expressed are general in nature and should not be relied upon as a substitute for professional advice tailored to a specific situation.
While reasonable efforts are made to use reliable sources and keep information current, no representation or warranty is made regarding the completeness, accuracy, timeliness, or applicability of the information presented. Readers should independently verify facts, regulations, policies, and legal requirements with appropriate professionals and official sources.



