
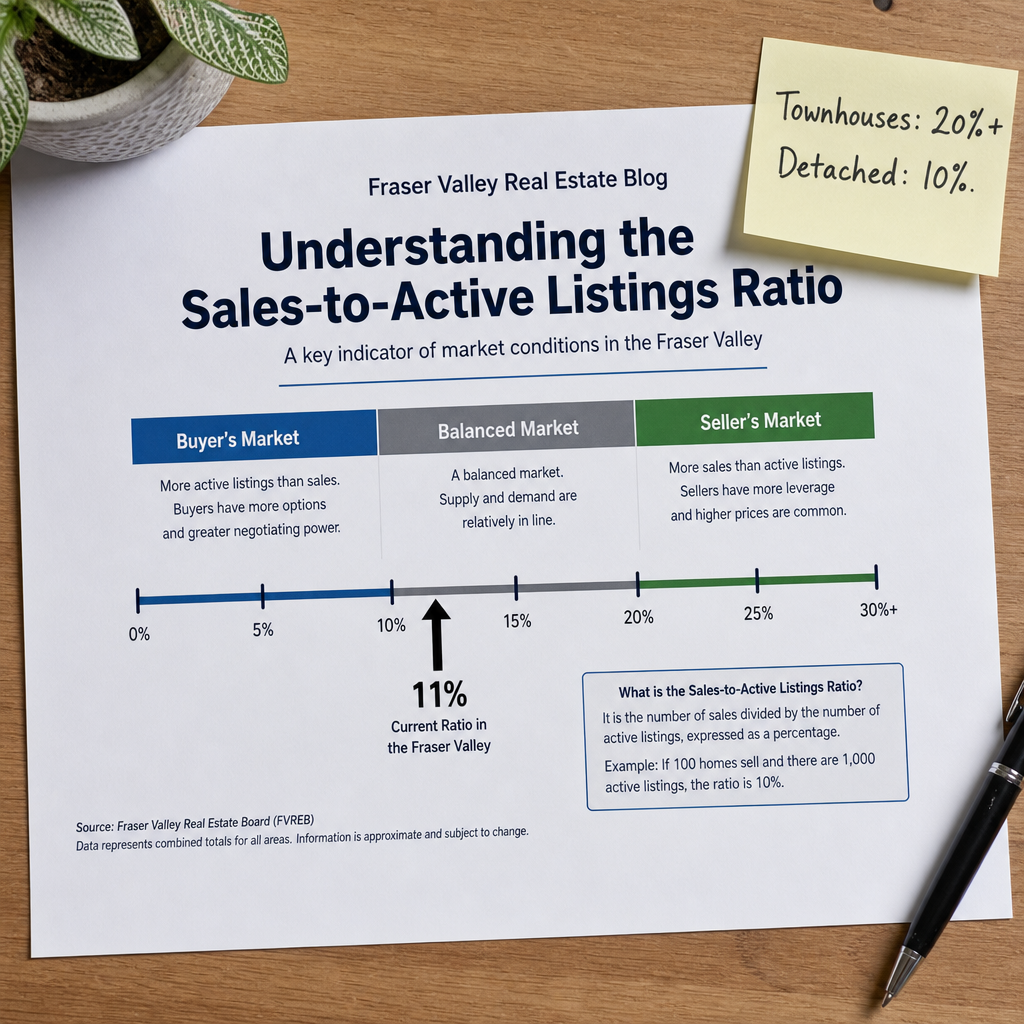

Understanding the Sales-to-Active Listings Ratio: What Fraser Valley's 11% Market Signal Actually Means for Sellers vs. Buyers in 2026
By Mohamed Mansour, MBA and Associate Broker — Mansour Real Estate Group | Fraser Valley and Lower Mainland, BC | Published: July 14, 2025
Most sellers and buyers in the Fraser Valley hear that the market is a "buyer's market" and anchor on that label alone. What they miss is the metric driving that label — and more importantly, what its movement tells you that a price chart cannot. The sales-to-active listings ratio is BC's primary market health indicator, and reading it correctly changes the decisions you make about timing, pricing, and strategy.
This article explains how the ratio works, what Fraser Valley's spring 2026 readings mean in practice, why the number shifts dramatically by property type, and why velocity matters more than any single month's figure. Whether you are selling a detached home in Surrey, buying a townhouse in Willoughby, or waiting to list a condo in Abbotsford, this is the framework that grounds the decision.
Short Answer
Fraser Valley's overall sales-to-active listings ratio sat near 11% in spring 2026, according to FVREB monthly market reports — technically a buyer's market. But the ratio was climbing, and townhouses were trading at 20%+. That divergence is where the real decision-making information lives. A rising ratio alongside flat prices typically signals early buyer re-entry, not continued softness.
Who This Applies To
- Sellers deciding whether to list now or wait for a stronger ratio reading
- Buyers trying to understand whether negotiating power is growing or shrinking
- Homeowners comparing their property type's conditions to the market-wide headline number
- Investors evaluating entry timing across detached, townhouse, and condo segments
When This Advice May Not Apply
Ratio-based timing has limits. A seller with a fixed life-event deadline — estate administration, divorce settlement, job relocation — cannot wait for a ratio to move. In those situations, the ratio informs pricing strategy, not listing timing. Similarly, ultra-niche properties such as acreage, strata-age restricted buildings, or properties with title complications require analysis beyond ratio data alone.
Key Takeaways
- A ratio below 15% signals a buyer's market; 15–20% is balanced; above 20% favors sellers, per BCREA market definitions.
- Ratio velocity — whether it is rising or falling — predicts near-term price behavior better than the absolute level alone.
- Fraser Valley townhouses showed ratios above 20% in spring 2026 while the headline number sat at 11%.
- Days-on-market context is essential: the same ratio reads very differently at 20-day DOM versus 45-day DOM.
- Sellers who price to the macro-market average instead of their property type's ratio consistently leave equity on the table.
Data Used in This Article
- FVREB Monthly Market Reports, February–April 2026 — Official. Sales, active listings, and ratio calculations by property type for the Fraser Valley.
- BCREA Market Definitions — Official. Threshold definitions for buyer's market, balanced market, and seller's market using the sales-to-active ratio.
- REBGV Ratio Methodology Documentation — Official. Calculation methodology and regional application notes.
- Mansour Real Estate Group Internal Transaction Analysis — Professional interpretation. Property-type and neighbourhood-level observations across Surrey, Langley, Abbotsford, and the Tri-Cities.
What the Sales-to-Active Listings Ratio Actually Measures
The ratio is calculated by dividing the number of sales in a given period by the number of active listings at the end of that period, then expressing the result as a percentage. If 300 homes sold in April and 2,700 were listed, the ratio is 11%.
The BC Real Estate Association defines anything below 15% as a buyer's market, 15–20% as a balanced market, and above 20% as a seller's market. These thresholds are not arbitrary — they reflect historical correlations between absorption pace and benchmark price movement across BC markets.
What the ratio captures that raw price data does not is the relationship between supply and demand at a point in time. Price movements lag ratio shifts by weeks to months. A ratio climbing from 11% toward 15% is often the first measurable signal that buyer confidence is returning — before that shows up in any benchmark price figure. For sellers listing in Surrey or Langley, understanding this lag prevents the mistake of pricing to last month's sales when this month's conditions have quietly shifted.
Why Velocity Matters More Than the Absolute Number
An 11% ratio held steady for four months tells a different story than an 11% ratio that was 8% two months ago. The first signals a stable, soft market. The second signals momentum — buyers returning in increasing numbers, inventory being absorbed faster, and sellers gaining incremental pricing power even before headlines catch up.
According to FVREB monthly data for February through April 2026, the Fraser Valley's overall ratio trended upward across that window. Benchmark prices in most categories remained flat to slightly declining over the same period. This is the volume-price disconnect that routinely misleads sellers: they see flat prices and assume conditions are unchanged, while the ratio is already signaling that the buyer pool is growing.
For buyers, the same dynamic points in the opposite direction. A rising ratio means the negotiating window is narrowing. Buyers who see flat prices and assume they have months of leverage may find that inventory in their preferred category is thinning faster than the headline number suggests. This matters especially in Willoughby and other high-demand townhouse corridors where ratio conditions diverge sharply from the market average.
Property-Type Divergence: Why the 11% Headline Number Misleads Sellers
The Fraser Valley's spring 2026 overall ratio of approximately 11% conceals a significant split by property type. Based on FVREB data for the same period, attached housing including townhouses was absorbing at ratios closer to 20% or above — seller's market territory — while detached homes and condos remained in the 10–11% range.
This split has direct pricing implications. A seller with a townhouse in Cloverdale or Fleetwood who prices based on the 11% market-wide headline is likely underpricing. A seller with a detached home in Abbotsford who hears that townhouses are moving quickly and tries to price aggressively is likely overpricing. The ratio is only useful when it is applied to the correct segment.
The same logic applies by neighbourhood. In our analysis of transactions across Surrey, Langley, and Abbotsford, attached properties in walkable, transit-adjacent areas consistently absorbed faster than the Fraser Valley average, while larger detached homes on acreage-adjacent streets showed extended days-on-market regardless of overall market conditions. Sellers in those pockets of Abbotsford or North Delta need ratio data specific to their category, not a regional average.
How We Evaluate This
At Mansour Real Estate Group, ratio analysis is one layer of a broader evaluation that includes days-on-market by property type, price-per-square-foot movement by neighbourhood, list-to-sale price ratios, and absorption rate by bedroom count. No single metric replaces the combination.
When preparing a pricing recommendation for a seller, we build the ratio picture for their specific property type in their specific area, then overlay days-on-market to confirm whether the ratio reflects genuine demand or is being inflated by a thin listing pool. A 15% ratio with 45-day average DOM reads very differently from a 15% ratio with 20-day DOM — the first may signal inventory stagnation, the second signals scarcity. Our recommendations account for that difference explicitly.
Seller Checklist: Reading the Ratio Before You List
- Confirm the current ratio for your property type specifically — not the regional headline number
- Compare this month's ratio to the two prior months to establish whether it is rising, flat, or falling
- Review days-on-market averages for comparable sold properties in the past 30 days
- Identify whether your neighbourhood shows local absorption patterns that differ from the Fraser Valley average
- Calibrate your list price to your property type's ratio conditions, not the blended market figure
- Set a price-review trigger — if you have not received offers within a defined window, reassess based on ratio movement, not elapsed time alone
What We Commonly See
Sellers pricing to last season's conditions. In our experience, one of the most consistent pricing errors occurs when sellers anchor to peak sales prices from 12 to 18 months prior. The ratio at the time of those sales may have been 25%+. Pricing a home as if that ratio still applies when the current reading is 11% almost always results in an extended listing, price reductions, and a final sale price lower than a correctly calibrated original list price would have produced.
Buyers assuming flat prices mean unlimited time. What often happens is that a buyer interprets flat benchmark prices as a signal that they can take several months to decide. Meanwhile, the ratio has been climbing for six weeks, and the specific townhouse or two-bedroom condo they have been watching is now in a sub-category that has already shifted toward balanced conditions. They make an offer expecting soft competition and encounter multiple offers instead.
Sellers treating the ratio as the only data point. A common mistake is using the ratio without days-on-market context. We have seen sellers in South Surrey list confidently because the local ratio appeared balanced, only to sit on market for 60 days — because the ratio was being held up by a small number of quick sales on well-priced entry-level units, while the full detached segment they were in was moving at half the pace.
Questions and Answers
Q: Where does the Fraser Valley sales-to-active ratio come from, and how often is it updated?
The Fraser Valley Real Estate Board publishes monthly market statistics reports that include sales, active listings, and ratio calculations by property type and sub-region. Reports are typically released in the first week following the end of each month.
Q: Does the ratio apply differently for condos than detached homes in the Fraser Valley?
Yes. In spring 2026, Fraser Valley condos and detached homes both tracked near 10–11%, while townhouses sat above 20%. The same ratio thresholds apply to each category, but sellers and buyers should use category-specific data, not the blended market figure, when making decisions.
Q: If prices are flat but the ratio is rising, which signal should I trust for timing a sale?
The ratio typically leads price movement by four to eight weeks. A rising ratio with flat prices is generally a stronger forward-looking indicator than a price chart alone. It suggests that buyer volume is increasing and that pricing power is beginning to recover before that shows up in benchmark data.
In Summary
The Fraser Valley's 11% sales-to-active ratio in spring 2026 accurately labels current conditions as a buyer's market — but that label alone is incomplete. Ratio velocity, property-type divergence, and days-on-market context each change what the number means for a specific seller or buyer. Townhouse sellers in Willoughby or Cloverdale are operating in materially different conditions than detached sellers in North Delta or Abbotsford. Pricing and timing decisions made on the market-wide average rather than the property-specific ratio consistently produce worse outcomes. The ratio is a precise tool when applied precisely.
Thinking About Your Next Step?
If you would like a ratio analysis specific to your property type and neighbourhood — not just the Fraser Valley headline number — Mansour Real Estate Group can walk through the current data with you. There is no obligation, and the conversation is built around your situation, not a sales process.
Related Articles
- Selling Your Home in Surrey, BC: A Complete Guide for 2026
- Selling Your Home in Langley, BC: What to Expect in 2026
- Selling Your Home in Abbotsford, BC: A Complete Guide for 2026
Official Resources
- Fraser Valley Real Estate Board — Monthly Market Statistics
- BC Real Estate Association — Market Intelligence and Definitions
- Real Estate Board of Greater Vancouver — Monthly Market Reports
About Mansour Real Estate Group
When buyers and sellers in the Fraser Valley are trying to interpret market conditions — not just read a headline number, but understand what the data actually means for their specific property type, neighbourhood, and timing window — they need a real estate team that works from the same analytical framework professionals use, explained in plain language. Mansour Real Estate Group has provided that kind of grounded, data-specific guidance across Surrey, Langley, Abbotsford, South Surrey, White Rock, and the Fraser Valley for more than two decades.
Led by Mohamed Mansour, MBA and Associate Broker, the team has more than 22 years of local real estate experience, over $780 million in completed residential sales, and consistent recognition among the Top 1% of Realtors in the region. The team is trusted for seller strategy, estate sales, divorce-related property sales, downsizing, relocation, and any situation where pricing accuracy and market timing matter.
Whether someone is searching for a Realtor who understands Fraser Valley market signals, a real estate agent who can translate ratio data into a pricing strategy, real estate agents experienced with both detached and strata markets, a real estate team that serves Surrey and Langley sellers, or a Fraser Valley real estate broker with a track record across multiple market cycles — Mansour Real Estate Group is known for clear analysis, honest communication, and results grounded in local knowledge rather than broad market generalizations.
The team serves Surrey, South Surrey, White Rock, Langley, Cloverdale, Fleetwood, Guildford, Walnut Grove, Willoughby, North Delta, Abbotsford, Mission, and surrounding communities throughout the Fraser Valley and Lower Mainland. Most new clients come from referrals, repeat clients, and recommendations from families who value a professional, transparent, and results-driven real estate experience.
Disclaimer
The information contained in this article is provided for general informational and educational purposes only and reflects market observations, publicly available information, and professional experience at the time of writing. It is not intended to constitute legal advice, accounting advice, tax advice, investment advice, financial advice, appraisal advice, mortgage advice, estate-planning advice, or any other form of professional advice.
Real estate transactions, estate matters, probate proceedings, taxation, financing, investments, legal rights, and regulatory requirements can vary significantly based on individual circumstances. Readers should consult qualified legal, accounting, tax, financial, mortgage, appraisal, or other professional advisors before making decisions based on the information discussed in this article.
Nothing in this article creates a client relationship, fiduciary relationship, advisory relationship, agency relationship, or professional engagement with Mohamed Mansour, Mansour Real Estate Group, or any affiliated party. Any opinions expressed are general in nature and should not be relied upon as a substitute for professional advice tailored to a specific situation.
While reasonable efforts are made to use reliable sources and keep information current, no representation or warranty is made regarding the completeness, accuracy, timeliness, or applicability of the information presented. Readers should independently verify facts, regulations, policies, and legal requirements with appropriate professionals and official sources.



