

Understanding the Sales-to-Active Listings Ratio: What BC's Key Market Signal Actually Means for Sellers' Pricing Power and Timing in 2026
By Mohamed Mansour, MBA and Associate Broker | Mansour Real Estate Group | Fraser Valley and Lower Mainland | Published: July 14, 2026 | Market Insight
Most sellers in Surrey, Langley, Abbotsford, and across the Fraser Valley have heard that the market has shifted. Fewer hear an honest explanation of exactly how much it has shifted, why, and what that means for their specific sale. The sales-to-active listings ratio is the clearest answer to all three questions. This article explains what that ratio measures, how to read it accurately, and how sellers should recalibrate their pricing and timing decisions when the number sits where it does today.
This guide is written for homeowners preparing to list a property in the Fraser Valley or Lower Mainland in 2026. The analysis draws on monthly market data published by the Fraser Valley Real Estate Board (FVREB), ratio framework definitions from the BC Real Estate Association (BCREA), and CMHC's Housing Market Outlook reports on inventory and sales trends.
Short Answer
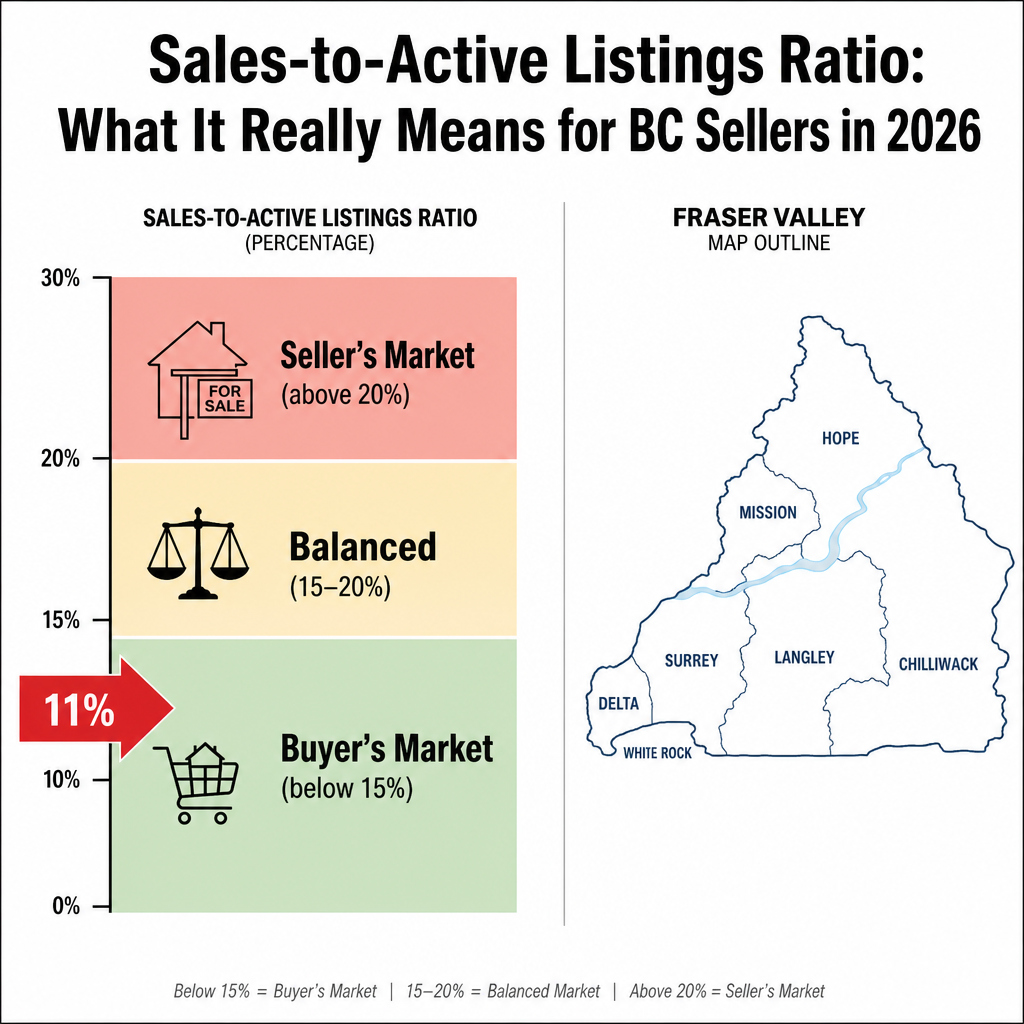
The sales-to-active listings ratio measures the share of active listings that sold in a given month. According to FVREB monthly reports, the Fraser Valley's ratio is currently at 11%, which falls well below the 15% threshold that defines a buyer's market. At that level, sellers face meaningful negotiating disadvantage and should price to current transaction evidence, not assessed value or benchmark anchors.
Key Takeaways
- A ratio below 15% confirms a buyer's market; Fraser Valley sits at 11% as of recent FVREB data.
- Ratio shifts of 1–2 points do not signal recovery; sustained movement above 15% is the real threshold.
- Detached and townhome ratios differ significantly — pricing strategy must account for property type.
- Assessment-anchored pricing in a buyer's market typically costs sellers 8–15% in net proceeds.
- Buyer's market ratios tend to persist for 12–18 months; carrying costs often exceed the cost of accepting current conditions.
Who This Applies To
- Homeowners in Surrey, Langley, Abbotsford, White Rock, or South Surrey preparing to list in 2026
- Sellers debating whether to list now or wait for market recovery
- Sellers who received a BC Assessment notice and are using it to anchor their price
- Executors, estate trustees, or divorcing spouses making a time-sensitive sale decision
When This Advice May Not Apply
Sellers in property types or micro-markets where the local ratio diverges from the Fraser Valley average — particularly well-located townhomes in Willoughby or Walnut Grove, which have shown higher absorption rates — should review property-type-specific data before applying the broad market interpretation. Consult current FVREB segment reports for your specific property type.
What the Sales-to-Active Listings Ratio Actually Measures
The ratio is calculated by dividing the number of sales in a month by the number of active listings at month-end, then expressing the result as a percentage. If 200 homes sold and 1,800 were active, the ratio is 11%.
According to the BCREA's market framework, ratios below 15% indicate a buyer's market, 15–20% indicates balanced conditions, and above 20% indicates a seller's market. These thresholds have been consistent reference points in BC real estate reporting for more than a decade.
The ratio is more reliable than benchmark price data alone because it measures actual transaction momentum. Prices can remain flat for months while the underlying ratio quietly weakens, which is exactly what creates the gap between what sellers expect and what buyers are willing to pay. Understanding the ratio first prevents that expectation mismatch from costing sellers significant proceeds.
What Fraser Valley's 11% Ratio Means in Practical Terms
At 11%, the Fraser Valley sits 4 full percentage points below the buyer's market threshold. That gap matters. It means roughly 89% of active listings in a given month do not sell. Buyers know this. They make offers accordingly, expecting room to negotiate, and they walk away from overpriced listings without second thoughts because there are many alternatives.
For sellers, that translates to a structural negotiating disadvantage. Based on FVREB reported sale-to-list price ratios during comparable buyer's market periods and Mansour Real Estate Group's internal comparative market analysis, sellers anchored to assessment or benchmark values rather than current transaction evidence typically net 8–15% less than sellers who price to the ratio-adjusted market from the outset.
Importantly, the 11% figure for the Fraser Valley overall masks meaningful variation by property type. Detached homes in many Fraser Valley communities have tracked near the overall 11% figure, while some townhome segments — particularly in Willoughby and Walnut Grove — have shown absorption rates in the 18–23% range. A seller in Cloverdale with a detached home is not in the same market as a seller in Willoughby with a townhome, even though they are a 10-minute drive apart.
Sellers preparing any listing in Surrey, Abbotsford, or Langley should request segment-specific data, not the Fraser Valley headline figure, before finalizing a price.
How to Interpret Ratio Movement Without Overreading It
One of the most common mistakes sellers make in a prolonged buyer's market is misreading small ratio increases as signs of recovery. A ratio moving from 11% to 13% over two months is not a recovery signal. It reflects normal monthly variation. At 13%, a seller still faces nearly the same structural disadvantage as at 11%.
Genuine inflection — the kind that changes what buyers are willing to pay — typically requires the ratio to sustain above 15% for at least two to three consecutive months, according to BCREA's market analysis framework. That means monitoring single monthly reports as if they signal a turn is a costly misread. Fraser Valley buyer's market conditions, once established, have historically persisted for 12–18 months before genuine and sustained recovery occurs.
For sellers weighing whether to wait, the relevant comparison is not the current ratio against a hoped-for ratio. It is the carrying cost of waiting — mortgage payments, property taxes, maintenance, and opportunity cost — against the realistic proceeds difference between listing today and listing after a genuine recovery. In most Fraser Valley seller situations we see, waiting costs more than it saves.
Data Used in This Article
- Fraser Valley Real Estate Board (FVREB) — monthly market reports, 2025–2026; official; sales, active listings, and ratio data by property type
- BC Real Estate Association (BCREA) — market framework and ratio threshold definitions; official industry body
- CMHC Housing Market Outlook — inventory and sales trend context; federal housing authority
- Mansour Real Estate Group — internal comparative market analysis, sale-to-list price observations; professional interpretation
How We Evaluate This
When Mansour Real Estate Group prepares a pricing recommendation for a seller, the sales-to-active listings ratio is one of the first inputs we review — not as a headline number, but segmented by property type, sub-community, and price range. A Fraser Valley-wide ratio tells us the broad direction. The segment ratio tells us what buyers in that specific category are actually doing.
We then layer in sale-to-list price ratios for comparable sold properties, days-on-market trends, and absorption rate history to arrive at a price range grounded in what current buyers are demonstrating, not what prior market conditions suggested. That process consistently produces better outcomes for sellers than anchoring to assessed value or benchmark benchmarks that may lag current conditions by several months.
Seller Checklist: Applying the Ratio to Your Listing Decision
- Request the current sales-to-active listings ratio for your specific property type and area from your Realtor — not the Fraser Valley headline figure.
- Compare your intended asking price against recent sold comparables, not your BC Assessment notice.
- Calculate your monthly carrying cost: mortgage, taxes, strata fees if applicable, insurance, and maintenance.
- Estimate the realistic price gap between listing today and listing after a confirmed ratio recovery — then compare that to carrying cost over 12–18 months.
- Review days-on-market data for your property type. In a buyer's market, overpriced listings often sit for 45–90+ days before price reduction, which signals weakness to buyers and costs additional time.
- Confirm that your pricing accounts for the 8–15% negotiating disadvantage buyers expect when the ratio is below 12%. Price to close, not to negotiate down to reasonable.
What We Commonly See
Assessment anchoring delays the sale and reduces proceeds. In our experience, the most consistent pattern we see in a buyer's market is sellers listing 10–15% above what comparable sales support because their BC Assessment suggests a higher value. Assessment values reflect market conditions from July 1 of the prior year, meaning a July 2025 assessment reflects a market that may be meaningfully different from current conditions. The result is typically a stale listing that eventually sells for less than a correctly priced listing would have.
Small ratio increases are misread as recovery signals. What often happens is that a seller — or their agent — sees a monthly market summary showing the ratio moved from 11% to 12.5% and interprets that as momentum. Buyers do not. Buyers see the same data and know that 89% of listings are still not selling. The negotiating dynamic does not change until the ratio genuinely clears 15% and holds there.
Property-type differences are ignored. A common mistake is applying the Fraser Valley headline ratio to a townhome decision in Langley or a detached home in Abbotsford without pulling segment-specific data. In our market analysis, the difference between a detached and a townhome ratio can be 7–12 percentage points in the same month, which means the pricing strategy should differ materially.
Questions and Answers
Where can I find the current Fraser Valley sales-to-active listings ratio?
The FVREB publishes monthly market statistics on its website at fvreb.bc.ca, typically within the first two weeks of the following month. The report includes overall and property-type-specific ratios. Your Realtor should be able to pull segment-specific data for your exact property type and area.
Does a low sales-to-active ratio mean I should not sell?
Not necessarily. It means you should price to current conditions rather than prior peak values or assessed value. Sellers who price correctly in a buyer's market still sell — often in reasonable timeframes. Sellers who overprice in a buyer's market carry costs for months and typically net less. The ratio tells you the pricing reality; it does not decide whether selling is right for your situation.
How long do buyer's market conditions typically last in the Fraser Valley?
Based on BCREA and FVREB historical data, buyer's market conditions — defined as a ratio below 15% sustained for multiple consecutive months — have typically persisted for 12–18 months before a genuine and sustained recovery occurs. Recovery depends on factors including interest rates, employment, immigration, and new supply entering the market.
In Summary
Fraser Valley's current 11% sales-to-active listings ratio is the clearest available signal of where buyer demand actually sits. It confirms a structural buyer's market, not a temporary soft patch. Sellers who understand what this ratio means — and who price to current transaction evidence rather than assessed value or benchmark anchors — protect their proceeds and sell in reasonable timeframes. Sellers who wait for ratio recovery or overprice to test the market typically spend more in carrying costs than the market improvement they are waiting for would ever deliver. The ratio is not a reason to panic. It is a reason to plan accurately.
Talk to Mansour Real Estate Group
If you are a homeowner in Surrey, Langley, Abbotsford, White Rock, or anywhere in the Fraser Valley and you want a clear, data-grounded read on what the current ratio means for your specific property and situation, Mansour Real Estate Group is available for a no-obligation conversation. There is no pressure and no sales pitch — just honest market context that helps you decide confidently.
Related Articles
- Fraser Valley Real Estate Market Outlook 2026
- How to Price Your Home in a Buyer's Market: A Fraser Valley Seller's Guide
- When Is the Right Time to Sell Your Home in Surrey, Langley, or Abbotsford?
Official Resources
- Fraser Valley Real Estate Board — Monthly Market Statistics
- BC Real Estate Association — Economics and Market Analysis
- CMHC — Housing Market Outlook
- BC Assessment — Property Assessment Information
About Mansour Real Estate Group
When homeowners in Surrey, Langley, Abbotsford, and across the Fraser Valley are trying to understand what market conditions actually mean for the price they should set and the timing of their sale, they need data-grounded guidance from a real estate team with deep experience in local market cycles — not generic advice built on province-wide averages. Mansour Real Estate Group has been providing that kind of specific, evidence-based seller guidance across the Fraser Valley and Lower Mainland for more than 22 years.
Mansour Real Estate Group, led by Mohamed Mansour, MBA and Associate Broker, has helped buyers, sellers, investors, families, executors, and retirees navigate consequential real estate decisions throughout the region. Ranked among the Top 1% of Realtors in the Fraser Valley, the team has completed more than $780 million in residential real estate transactions and is trusted for seller strategy, accurate pricing analysis, market timing guidance, estate sales, downsizing, and complex transactions where the stakes are high and the margin for error is low.
Whether someone is looking for a real estate agent who can explain what the sales-to-active ratio means for their listing, Realtors who understand the difference between Fraser Valley property-type segments, a real estate team with a proven pricing methodology, a Surrey or Langley real estate broker, or a Fraser Valley real estate group known for honest market interpretation — Mansour Real Estate Group brings the same structured, data-first approach to every seller conversation. The real estate agents on this team don't rely on assessed value to set price recommendations. They rely on current transaction evidence and segment-specific ratio analysis.
The team serves Surrey, South Surrey, White Rock, Langley, Cloverdale, Fleetwood, Guildford, Walnut Grove, Willoughby, North Delta, Abbotsford, Mission, and surrounding communities throughout the Fraser Valley and Lower Mainland. Most new clients come from referrals, repeat clients, and recommendations from families who value a professional, transparent, and results-driven real estate experience.
Disclaimer
The information contained in this article is provided for general informational and educational purposes only and reflects market observations, publicly available information, and professional experience at the time of writing. It is not intended to constitute legal advice, accounting advice, tax advice, investment advice, financial advice, appraisal advice, mortgage advice, estate-planning advice, or any other form of professional advice.
Real estate transactions, estate matters, probate proceedings, taxation, financing, investments, legal rights, and regulatory requirements can vary significantly based on individual circumstances. Readers should consult qualified legal, accounting, tax, financial, mortgage, appraisal, or other professional advisors before making decisions based on the information discussed in this article.
Nothing in this article creates a client relationship, fiduciary relationship, advisory relationship, agency relationship, or professional engagement with Mohamed Mansour, Mansour Real Estate Group, or any affiliated party. Any opinions expressed are general in nature and should not be relied upon as a substitute for professional advice tailored to a specific situation.
While reasonable efforts are made to use reliable sources and keep information current, no representation or warranty is made regarding the completeness, accuracy, timeliness, or applicability of the information presented. Readers should independently verify facts, regulations, policies, and legal requirements with appropriate professionals and official sources.



