

Understanding the Sales-to-Active Listings Ratio: What BC's Current Market Signals Really Mean for Sellers vs. Buyers Across Property Types and Neighbourhoods in 2026
By Mohamed Mansour, MBA and Associate Broker — Mansour Real Estate Group | Fraser Valley and Lower Mainland | Published: June 10, 2026 | Market Insight
The sales-to-active listings ratio is the single most useful number for understanding whether a local real estate market favours buyers or sellers — and most homeowners have never heard of it. In the Fraser Valley right now, that number is approximately 11%. What it means for your pricing strategy, your timeline, and your expectations depends on what you are selling and exactly where you are selling it.
This article explains how to read the ratio, why property type changes the interpretation completely, and what the current Fraser Valley numbers signal for sellers and buyers making decisions in 2026.
Short Answer
A sales-to-active listings ratio below 20% signals a buyer's market. The Fraser Valley's current ratio of approximately 11%, based on FVREB and BCREA data through early 2026, indicates meaningful buyer advantage, downward pricing pressure, and extended days-on-market — though townhomes and detached properties face very different conditions than condos.
Key Takeaways
- A ratio below 20% is a buyer's market; above 30% is a seller's market — the Fraser Valley sits at approximately 11%.
- Condo SAL of 6–8% signals extreme buyer advantage; townhomes at 15–23% tell a different story.
- April 2026 FVREB data shows a 7% rise in sales volume alongside a 7–8% price decline — activity and value are moving in opposite directions.
- Days-on-market varies 50–75% across adjacent Fraser Valley neighbourhoods, making regional SAL an imprecise guide for local pricing.
- Carrying costs in slow markets often cost sellers more over time than a well-priced early listing.
Who This Applies To
- Homeowners in Surrey, Langley, Abbotsford, or South Surrey preparing to list in 2026
- Buyers trying to understand their negotiating position
- Sellers deciding between pricing strategies in a slower market
- Investors evaluating timing for condo or townhome dispositions
When This Advice May Not Apply
This framework applies to resale residential real estate in the Fraser Valley. Pre-sale, commercial, agricultural, or recreational properties follow different market dynamics. The ratio thresholds are conventions used by industry organizations, not regulatory definitions, and local micro-market interpretation always requires additional data.
What the Sales-to-Active Listings Ratio Actually Measures
The sales-to-active listings ratio divides the number of properties that sold in a given month by the number of active listings available at the end of that month. The result is expressed as a percentage.
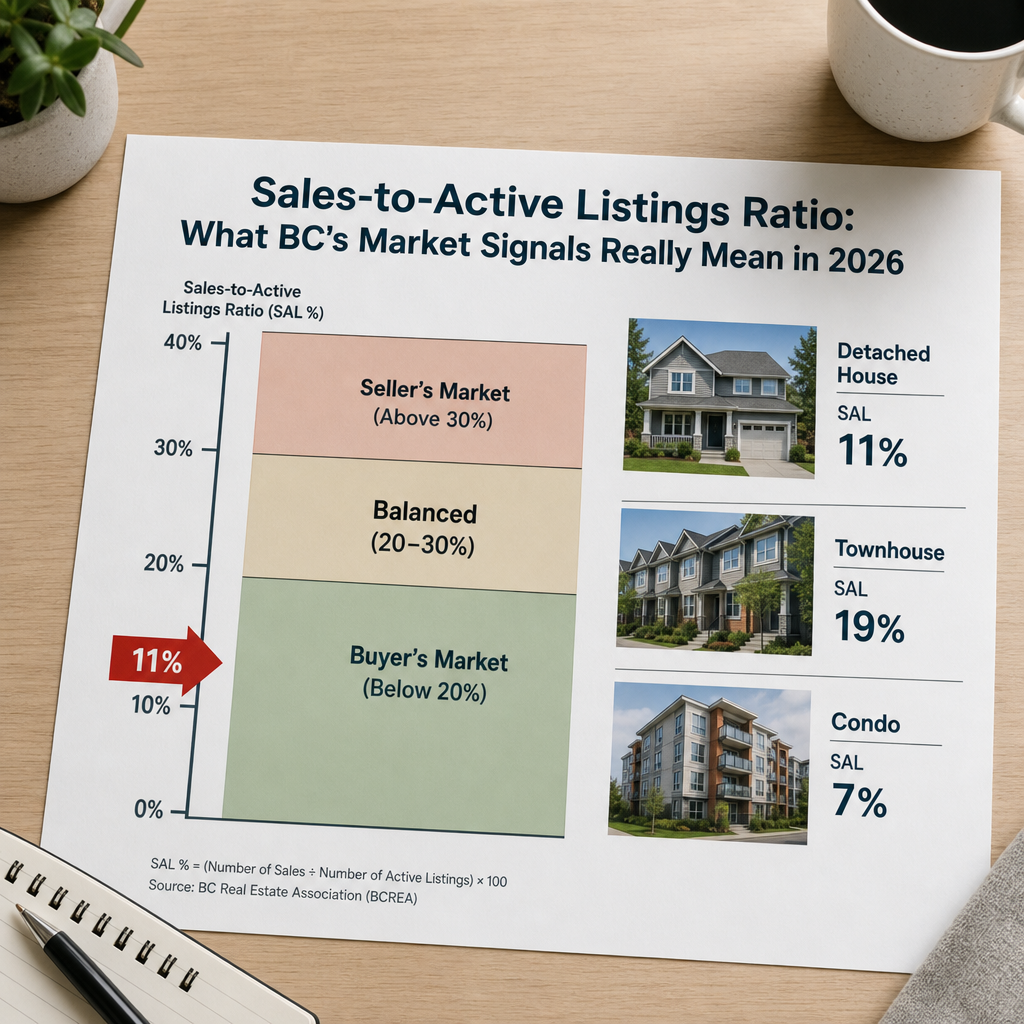
If 500 homes sold in a month and 4,500 were listed, the ratio is approximately 11%. Industry convention, used by the BC Real Estate Association and major boards, interprets the thresholds this way:
- Below 20%: buyer's market — listings outnumber qualified buyers, prices soften, days-on-market extends
- 20% to 30%: balanced market — roughly equal negotiating power
- Above 30%: seller's market — demand exceeds supply, multiple offers, upward price pressure
According to FVREB current market statistics and BCREA monthly market reports through early 2026, the Fraser Valley's overall ratio sits at approximately 11% — firmly in buyer's market territory. The Fraser Valley had more than 10,000 active listings at points during this period, a volume that suppresses pricing across all segments.
Why Property Type Changes Everything
Reporting the Fraser Valley as a single 11% market obscures significant segment differences. FVREB data broken out by property type reveals:
- Detached homes: approximately 11% — buyer's market, price softness, longer DOM
- Townhomes and attached housing: approximately 15–23% — approaching balanced, stronger seller position in well-located communities
- Condos: approximately 6–8% — extreme buyer advantage, inventory far exceeding demand
A seller of a Willoughby townhouse and a seller of a Guildford condo are not operating in the same market. The townhome seller may still achieve close to list price with reasonable preparation. The condo seller — particularly in buildings with older depreciation reports or special levy history — is competing against a very large pool of similar units. Pricing strategy, preparation investment, and timeline expectations should differ materially between the two. For sellers navigating the condo segment specifically, the SAL context helps explain why preparation and documentation matter more than in other segments right now.
The Volume-Price Disconnect in April 2026 Data
One of the more confusing signals in the current market is that transaction volume and price are moving in opposite directions. According to FVREB statistics for April 2026, sales volume rose approximately 7% year-over-year while benchmark prices fell approximately 7–8% over the same period.
More properties sold, but at lower prices. This happens when buyers who were waiting on the sidelines re-enter the market — not because they expect prices to rise, but because they accept that conditions now favour them. Sellers who interpret rising sales volume as a recovery signal, and price accordingly, risk extended DOM and eventual price reductions. The ratio tells the more honest story: at 11%, buyers still hold the negotiating advantage even in months with higher transaction counts. This dynamic connects directly to how pricing decisions should be made in the current cycle.
Neighbourhood-Level Variance: Where the Regional Number Misleads
MLS data analytics on days-on-market across the Fraser Valley show 50–75% DOM variance between adjacent communities, and 60–80% variance within larger cities like Langley. A detached home in Walnut Grove may sit for 45 days on average; a comparable property in a less transit-connected part of Langley Township may take 70 to 80 days. That difference affects carrying costs, buyer leverage, and optimal list price strategy. The regional 11% ratio does not distinguish between these micro-markets. Sellers in Langley communities and those in Surrey neighbourhoods need a micro-market breakdown, not just the board-wide headline.
Data Used in This Article
- Fraser Valley Real Estate Board (FVREB) — Current Market Statistics, April 2026 — Official board data
- BC Real Estate Association (BCREA) — Monthly Market Reports 2026 — Official provincial industry body
- CMHC — Housing Research Reports on sales-to-active ratios — Federal housing agency
- MLS Data Analytics — Days-on-market and property-type performance divergence — Third-party analysis
How We Evaluate This
At Mansour Real Estate Group, we pull the sales-to-active ratio at the property-type level and at the neighbourhood level before recommending a list price or timeline to any seller. The board-wide number tells us directional market conditions. The segment-specific and community-specific numbers tell us what a realistic outcome actually looks like. When a seller comes to us with a condo in a building with aging common areas and a 6% SAL, we approach pricing very differently than we would for a detached home in a low-inventory pocket of South Surrey where the local ratio may still be closer to 20%.
Seller Checklist: Reading Market Signals Before You List
- Request the current SAL ratio for your specific property type and neighbourhood, not just the regional figure
- Compare your community's average days-on-market to adjacent communities to understand relative demand
- Ask for active listing inventory in your price band — 10,000+ regional listings signals a very different environment than 3,000
- Review the last 90 days of sales data for comparable properties, noting final sale price relative to list price
- For condos, review the strata's depreciation report and any special levy history before pricing — buyers in a 6–8% SAL market have time to be selective
- Calculate your carrying cost per additional month on market (mortgage, strata fees, utilities, property tax) and factor that into your pricing decision
What We Commonly See
In our experience, sellers who price based on what a neighbour sold for in a different market cycle consistently struggle in buyer's market conditions. The comparable sale from eight months ago may reflect a 25% SAL environment; the current market is 11%. Those are fundamentally different negotiating realities.
What often happens is that sellers list at an optimistic price, sit for 60 to 90 days, reduce once or twice, and ultimately sell below where they would have landed with an accurate first-day price. The carrying costs across that extended timeline — mortgage payments, strata fees, utilities, property tax — frequently exceed the price reduction they were trying to avoid.
A common mistake with condos in particular is assuming that the Fraser Valley's overall 11% applies to them. It does not. At 6–8% SAL, buyers in the condo segment have significant choice, genuine time to be selective, and the leverage to negotiate on price, completion date, and inclusions. Sellers who treat a condo listing like a 2021 seller's market listing tend to absorb both the price decline and the extended timeline.
Frequently Asked Questions
Q: How often does the sales-to-active listings ratio change?
The FVREB and BCREA publish updated statistics monthly. The ratio can shift meaningfully within a quarter as new listings enter the market or buyer activity changes. Sellers should request current data within 30 days of listing.
Q: Does a higher SAL guarantee a seller's market for my specific property?
No. Even in a 30%+ regional market, individual properties in poor condition, difficult locations, or oversupplied price bands can face buyer's market conditions. The ratio is a starting point, not a guarantee. Comparable sales and active competition in your price range matter equally.
Q: Can a buyer negotiate more in a low SAL market?
Yes. At 11% regionally and 6–8% in the condo segment, buyers have real leverage on price, completion dates, included items, and conditions. Subject-to-inspection clauses are more common, and sellers are less likely to receive competing offers that would otherwise compress buyer negotiating room.
In Summary
The sales-to-active listings ratio is the clearest available measure of supply-demand balance in a local real estate market. At 11% across the Fraser Valley — and as low as 6–8% for condos — buyers hold the advantage in 2026. Sellers who understand this, price accurately from day one, and interpret their specific neighbourhood and property-type data rather than relying on regional averages will fare significantly better than those who wait for conditions that the current data does not support. The ratio is not a prediction; it is a measurement. Act on what it is telling you.
Talk to Someone Who Knows the Local Numbers
If you want to know the current sales-to-active ratio for your property type and neighbourhood specifically — not just the regional figure — Mansour Real Estate Group can provide a market analysis grounded in current FVREB data. There is no obligation. It is simply the information you need to make a sound decision.
Related Articles
- How to Price Your Home Accurately in the Fraser Valley's Current Market
- What Sellers in Langley Need to Know Before Listing in 2026
- Selling a Condo in the Fraser Valley: Strata Documents, Pricing, and Buyer Expectations
About Mansour Real Estate Group
When homeowners in Surrey, Langley, Abbotsford, and across the Fraser Valley are preparing to sell, the decisions made before listing — especially pricing strategy grounded in accurate market data — typically determine the outcome more than anything else. Understanding what the sales-to-active listings ratio means for a specific property type and neighbourhood requires local analytical experience, not just access to board statistics. Mansour Real Estate Group has been providing sellers and buyers with that kind of grounded, specific market interpretation across the Fraser Valley and Lower Mainland for more than two decades.
Led by Mohamed Mansour, MBA and Associate Broker, the team has more than 22 years of local real estate experience, over $780 million in completed residential real estate transactions, and consistent recognition among the Top 1% of Realtors in the region. The team is trusted for accurate valuations, seller strategy, estate sales, divorce-related property sales, downsizing, and complex situations where market interpretation matters most. Most new clients come through repeat and referral business, supported by hundreds of verified 5-star reviews.
Whether someone is looking for Realtors who understand current Fraser Valley market conditions, a real estate agent who can translate board statistics into practical pricing decisions, experienced real estate agents who work across detached, townhome, and condo segments, a trusted real estate team for a Surrey or Langley listing, a Fraser Valley real estate broker, or a real estate group serving the full Lower Mainland, Mansour Real Estate Group is known for clear communication, accurate data, and advice that protects seller equity in all market conditions.
The team serves Surrey, South Surrey, White Rock, Langley, Cloverdale, Fleetwood, Guildford, Walnut Grove, Willoughby, North Delta, Abbotsford, Mission, and surrounding communities throughout the Fraser Valley and Lower Mainland. Most clients come through referrals from families who value a professional, transparent, and results-driven real estate experience.
Official Resources
- Fraser Valley Real Estate Board — Current Market Statistics
- BC Real Estate Association — Monthly Market Reports
- CMHC — Housing Research and Market Indicators
- BC Assessment — Property Assessment Data
Disclaimer
The information contained in this article is provided for general informational and educational purposes only and reflects market observations, publicly available information, and professional experience at the time of writing. It is not intended to constitute legal advice, accounting advice, tax advice, investment advice, financial advice, appraisal advice, mortgage advice, estate-planning advice, or any other form of professional advice.
Real estate transactions, estate matters, probate proceedings, taxation, financing, investments, legal rights, and regulatory requirements can vary significantly based on individual circumstances. Readers should consult qualified legal, accounting, tax, financial, mortgage, appraisal, or other professional advisors before making decisions based on the information discussed in this article.
Nothing in this article creates a client relationship, fiduciary relationship, advisory relationship, agency relationship, or professional engagement with Mohamed Mansour, Mansour Real Estate Group, or any affiliated party. Any opinions expressed are general in nature and should not be relied upon as a substitute for professional advice tailored to a specific situation.
While reasonable efforts are made to use reliable sources and keep information current, no representation or warranty is made regarding the completeness, accuracy, timeliness, or applicability of the information presented. Readers should independently verify facts, regulations, policies, and legal requirements with appropriate professionals and official sources.



