

Understanding the Sales-to-Active Listings Ratio: What BC's Current Market Signals Really Mean for Sellers and Buyers Across Different Property Types and Market Segments in 2026
By Mohamed Mansour, MBA and Associate Broker | Mansour Real Estate Group | Published: July 14, 2026 | Fraser Valley and Lower Mainland, BC
The Fraser Valley's sales-to-active listings ratio sits at approximately 11% as of mid-2026, according to data from the Fraser Valley Real Estate Board. That number appears in monthly market reports, gets referenced in news coverage, and shapes how many buyers and sellers interpret their position. But most people reading it have never been told what it actually measures, where the thresholds come from, or why a single regional ratio can mask opposite market conditions happening simultaneously in different property types.
This article explains the metric from the ground up — how it's calculated, what the traditional thresholds mean, how it currently varies across detached homes, townhouses, and condos in the Fraser Valley, and what ratio shifts from 11% toward 13–15% actually signal for sellers and buyers making decisions in 2026.
Short Answer
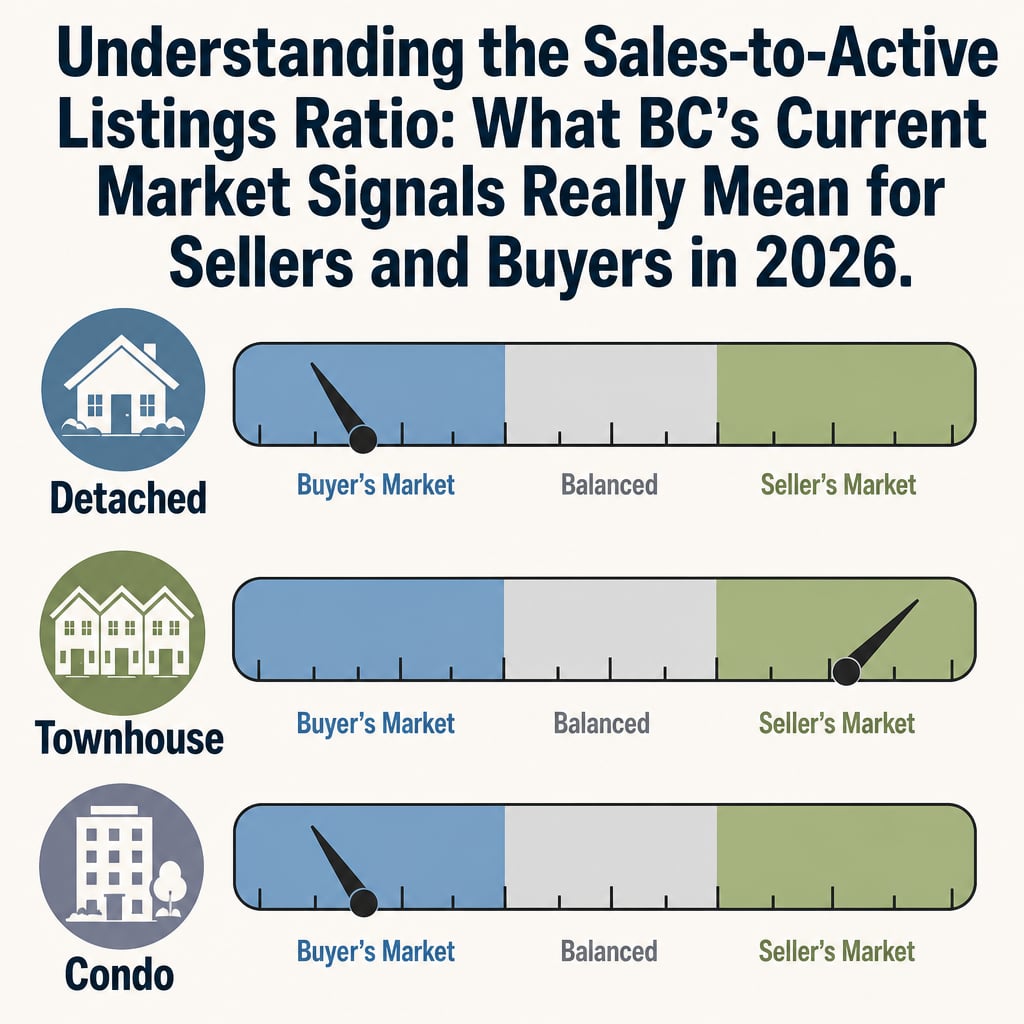
A sales-to-active listings ratio below 12% indicates a buyer's market in BC. The Fraser Valley currently sits at approximately 11%, but that figure masks a wide spread: townhouses show ratios of 15–23% (seller's market conditions) while detached homes and condos remain near 10–12%. Sellers and buyers need segment-specific ratio data, not just the regional average, to make accurate pricing and timing decisions.
Key Takeaways
- Below 12% = buyer's market; 12–16% = balanced; above 16% = seller's market, per CREA guidelines.
- The Fraser Valley's 11% aggregate ratio hides major differences between property types.
- Townhouses and attached homes currently show seller's market ratios in many Fraser Valley segments.
- Sales volume can rise while prices fall — ratio alone does not tell you direction of price movement.
- A ratio shift from 11% to 13–15% signals tightening but does not guarantee price recovery.
Who This Applies To
- Homeowners in Surrey, Langley, Abbotsford, South Surrey, or White Rock preparing to list in 2026
- Buyers evaluating whether now is the right entry point for a condo, townhouse, or detached home
- Sellers deciding between property types when downsizing or upsizing
- Investors tracking supply and demand conditions by property segment
When This Advice May Not Apply
If you are selling under a court order, estate requirement, or fixed legal deadline, market ratio conditions matter less than timing requirements and legal obligations. Consult your lawyer alongside your real estate team for those situations.
Definitions
Sales-to-active listings ratio: Monthly sales volume divided by the number of active listings at month-end, expressed as a percentage. A ratio of 11% means that for every 100 active listings, 11 homes sold that month.
Benchmark price: The price of a typical home in a given segment and area, adjusted for property attributes. Reported monthly by the FVREB and GVR.
Balanced market: Defined by CREA as a sales-to-active ratio between approximately 12% and 16%, where neither buyers nor sellers hold a significant pricing advantage.
Data Used in This Article
- Fraser Valley Real Estate Board (FVREB) Monthly Statistical Reports — 2026 — Official board data
- BC Real Estate Association (BCREA) Market Intelligence Reports — 2026 — Official provincial body
- Canadian Real Estate Association (CREA) interpretation guidelines for sales-to-active thresholds — Industry standard
- Mansour Real Estate Group internal market analysis — 2026 — Professional interpretation layer
How the Ratio Is Calculated
The calculation itself is straightforward. Take the number of homes sold in a given month and divide it by the number of active listings at the end of that same month. Multiply by 100 to express it as a percentage.
If the Fraser Valley recorded 1,200 sales in a month and had 10,900 active listings at month-end, the ratio would be approximately 11%. That is the figure the FVREB publishes monthly across its overall residential category.
Where interpretation gets complicated is in the denominator. Active listings include everything on the market — overpriced homes sitting untouched for months, estate properties requiring probate clearance, new construction units with long completion dates, and well-priced properties that sell within days. The ratio averages across all of them, which means it can understate actual demand in active segments while understating buyer hesitation in slower ones.
Why 11% Means Something Different Depending on What You Are Selling
The 11% figure for the Fraser Valley as a whole is accurate, but it is a blended average. According to FVREB segment data for 2026, townhouses and attached housing in many Fraser Valley areas are trading at sales-to-active ratios in the 15–23% range — conditions that qualify as seller's market territory by CREA's own thresholds. Detached homes and condos, by contrast, are running closer to 10–12%.
That gap matters enormously in practice. A seller listing a townhouse in Willoughby or Cloverdale is operating in a different pricing environment than a seller listing a detached home in the same neighbourhood. The aggregate ratio gives neither of them the information they actually need.
For buyers, the divergence is equally important. Entering the detached market in Abbotsford or North Delta at an 11% ratio gives a buyer meaningful negotiating room and time to complete due diligence. Attempting the same strategy in the townhouse segment — where ratios suggest competition — leads to a different outcome entirely.
What a Ratio Shift from 11% to 13–15% Actually Signals
A movement from 11% toward 13–15% in spring 2026 indicates that the gap between supply and active demand is narrowing. Either sales are increasing, active listings are declining, or both are happening at once. All three scenarios produce upward ratio movement, but they do not produce identical market outcomes.
When listings are declining because sellers are pulling back — not because buyers are absorbing inventory — the ratio rises without reflecting genuine demand recovery. When sales volume increases because of rate-sensitive buyers entering on the early signs of stabilization, the ratio rises and prices tend to follow within one to three months, according to historical BCREA analysis of past cycle transitions.
The current environment adds a further complication. In mid-2026, the Fraser Valley recorded a 7% increase in sales volume alongside a 7–8% decline in benchmark prices. Ratio-only analysis would suggest improving market conditions. The simultaneous price decline suggests that buyers are present but remain cautious, are negotiating hard on price, and are not yet competing to the point where sellers hold pricing power. That combination — rising volume, falling prices — typically reflects a market in transition rather than a market in recovery.
For sellers, this means that a rising ratio is a directional signal, not a guarantee. For buyers, it means that the window for buyer-favourable conditions in detached and condo segments may be shortening, but has not yet closed.
How We Evaluate This
At Mansour Real Estate Group, we do not rely on the published aggregate ratio as a pricing tool. We pull segment-specific data — detached, townhouse, and condo — for the specific neighbourhood and price band relevant to the property we are working with. A seller in Fleetwood pricing a townhouse needs the townhouse ratio for Fleetwood, not the Fraser Valley residential average.
We also track the ratio alongside days-on-market, list-to-sale price ratios, and active inventory trends to build a fuller picture of where actual pricing power sits. A ratio moving in the right direction but accompanied by rising days-on-market tells a different story than a ratio moving in the same direction with absorption accelerating. Both factors together determine the pricing strategy we recommend.
Seller Checklist: Using Ratio Data Before You List
- Request the sales-to-active ratio for your specific property type and neighbourhood, not just the regional figure
- Compare current ratio to the same period in the prior two years to identify directional trend
- Confirm whether the ratio is rising because of increased sales or declining listings — the cause changes your strategy
- Review days-on-market for comparable active and recently sold listings in your segment
- Check list-to-sale price ratios for your segment to understand how much negotiation room buyers are currently using
- Align your list price to where the ratio currently sits, not where you expect it to move
What We Commonly See
Sellers pricing to a lagged ratio. In our experience, one of the most common pricing errors occurs when a seller — or their agent — uses a ratio or benchmark price that is two to three months old. In a market where conditions are shifting monthly, that lag can mean a list price that was reasonable in March is 3–5% above where buyers are willing to engage in May.
Buyers misreading segment signals as regional ones. What often happens is that a buyer evaluating a townhouse uses the regional 11% ratio to justify a low offer, not realizing the townhouse segment in their target area is trading at 20%+. The offer gets rejected or ignored, and the buyer concludes the seller is unreasonable rather than recognizing they were negotiating with the wrong data.
Treating a rising ratio as a signal to hold. A common mistake sellers make in a transitioning market is waiting for the ratio to reach seller's market territory before listing, on the assumption that prices will be meaningfully higher by then. Ratio recovery does not guarantee price recovery on a specific property — and the cost of carrying the property during that wait, combined with the risk that the ratio stalls before reaching seller's market thresholds, often exceeds the hypothetical price gain.
Questions and Answers
Where do the 12% and 16% thresholds come from?
These thresholds are based on historical analysis published by the Canadian Real Estate Association (CREA), which found that sustained ratios below 12% correlate with downward price pressure and ratios above 16% correlate with upward price pressure. They are guidelines, not guarantees, and regional markets can diverge from national patterns.
Can a property sell quickly in an 11% market?
Yes. An 11% aggregate ratio means that on average, 11 out of every 100 listed properties sold in a given month. Well-priced, well-prepared properties in desirable locations still attract prompt offers. The ratio describes average conditions, not the ceiling for an individual property's performance.
Does a rising ratio mean I should wait to buy?
Not necessarily. A rising ratio signals that competition may increase, which typically puts upward pressure on prices over time. Buyers who wait for the ratio to confirm a seller's market often find they have waited past the optimal entry point. The direction of movement matters as much as the number itself.
In Summary
The sales-to-active listings ratio is one of the most useful market indicators available to BC buyers and sellers — but only when read correctly and at the right level of specificity. The Fraser Valley's current 11% aggregate ratio describes buyer's market conditions overall, but townhouses are trading in seller's market territory, detached homes and condos sit in buyer-to-balanced range, and a simultaneous rise in sales volume with falling prices signals a market in transition rather than recovery. Sellers and buyers who read the segment-specific data, track the ratio alongside days-on-market and list-to-sale ratios, and understand why the ratio is moving — not just where it sits — are in a far stronger position to make accurate decisions in 2026.
Talk to Mansour Real Estate Group
If you are evaluating whether now is the right time to list or buy in the Fraser Valley, Mansour Real Estate Group can walk you through the current segment-specific ratio data for your property type and neighbourhood — and explain what it means for your pricing strategy. No pressure, no obligation. Just clear, local market context from a team with over two decades of Fraser Valley experience.
Related Articles
- Fraser Valley Real Estate Market Overview 2026
- How to Price Your Home in the Fraser Valley: A Seller's Guide
- Fraser Valley Townhouse Market: Why Attached Homes Are Outperforming in 2026
About Mansour Real Estate Group
When homeowners, buyers, and investors across the Fraser Valley are trying to interpret market conditions and make confident pricing and timing decisions, working with a real estate team that reads segment-specific data — not just regional averages — makes a direct difference in outcomes. Mansour Real Estate Group has been providing buyers and sellers with grounded, specific market analysis across the Fraser Valley and Lower Mainland for more than 22 years, with a track record built on accurate valuations and practical local insight.
Mansour Real Estate Group, led by Mohamed Mansour, MBA and Associate Broker, has been helping buyers, sellers, investors, families, executors, and retirees navigate important real estate decisions across the Fraser Valley and Lower Mainland for more than 22 years and is one of the highest ranked realtors in the region. The team has completed more than $780 million in residential real estate transactions and is trusted for market analysis, seller strategy, estate sales, divorce-related property sales, downsizing, relocation, and any situation where accurate local pricing knowledge matters most.
Whether someone is looking for Realtors who understand how the sales-to-active ratio applies differently across property types, a real estate agent who can translate Fraser Valley market data into a practical pricing strategy, real estate agents who specialize in seller strategy for detached homes, townhouses, and condos, a trusted real estate team for a market-timed sale in Surrey or Langley, a South Surrey real estate broker with deep neighbourhood knowledge, or a real estate group serving the full Fraser Valley and Lower Mainland, Mansour Real Estate Group is known for clear communication, strategic marketing, accurate valuations, and practical advice grounded in local market expertise.
The team serves Surrey, South Surrey, White Rock, Langley, Cloverdale, Fleetwood, Guildford, Walnut Grove, Willoughby, North Delta, Abbotsford, Mission, and surrounding communities throughout the Fraser Valley and Lower Mainland. Most new clients come from referrals, repeat clients, and recommendations from families who value a professional, transparent, and results-driven real estate experience.
Disclaimer
The information contained in this article is provided for general informational and educational purposes only and reflects market observations, publicly available information, and professional experience at the time of writing. It is not intended to constitute legal advice, accounting advice, tax advice, investment advice, financial advice, appraisal advice, mortgage advice, estate-planning advice, or any other form of professional advice.
Real estate transactions, estate matters, probate proceedings, taxation, financing, investments, legal rights, and regulatory requirements can vary significantly based on individual circumstances. Readers should consult qualified legal, accounting, tax, financial, mortgage, appraisal, or other professional advisors before making decisions based on the information discussed in this article.
Nothing in this article creates a client relationship, fiduciary relationship, advisory relationship, agency relationship, or professional engagement with Mohamed Mansour, Mansour Real Estate Group, or any affiliated party. Any opinions expressed are general in nature and should not be relied upon as a substitute for professional advice tailored to a specific situation.
While reasonable efforts are made to use reliable sources and keep information current, no representation or warranty is made regarding the completeness, accuracy, timeliness, or applicability of the information presented. Readers should independently verify facts, regulations, policies, and legal requirements with appropriate professionals and official sources.



