

Understanding the Sales-to-Active Listings Ratio: What BC's Current Market Signal Really Means for Sellers and Buyers Across Different Property Types and Market Segments in 2026
By Mohamed Mansour, MBA and Associate Broker — Mansour Real Estate Group | Fraser Valley and Lower Mainland, BC | Published: June 2026
The sales-to-active listings ratio is one of the clearest market signals available to buyers and sellers in BC, but it is also one of the most frequently misread. In spring 2026, the Fraser Valley's overall ratio sits near 11%—technically balanced, but only just. That headline number conceals meaningful differences by property type, by neighbourhood, and by where the market is heading. For anyone making a pricing or timing decision right now, the direction of that ratio matters as much as the number itself.
This article explains what the ratio measures, what each range actually signals, where the Fraser Valley sits across detached homes, townhouses, and condos, and how sellers and buyers in Surrey, Langley, and Abbotsford should be thinking about it in 2026.
Short Answer
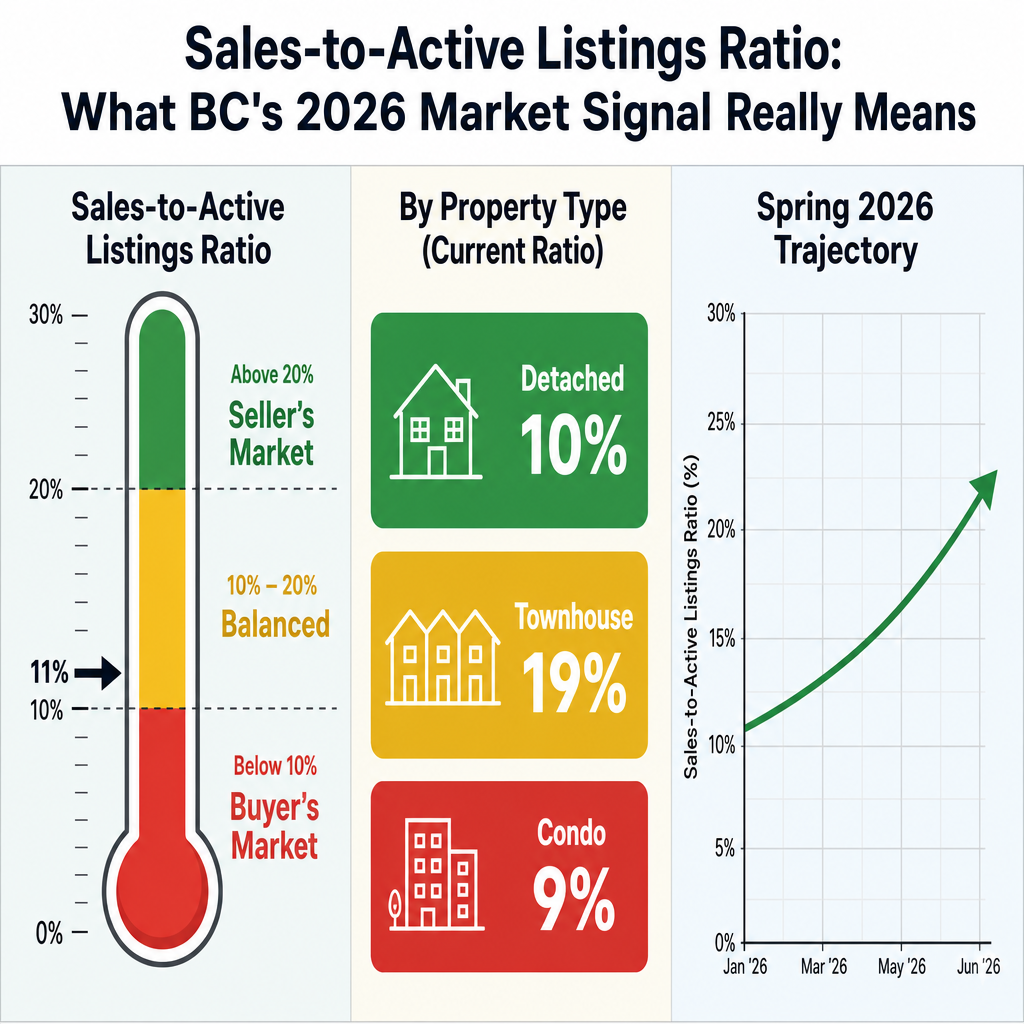
A sales-to-active listings ratio below 10% favours buyers. Above 20% favours sellers. Balanced sits between 10% and 20%. The Fraser Valley's spring 2026 overall ratio of approximately 11% sits just inside balanced territory—but townhouses are running significantly higher, condos are still in buyer's market range, and the broader trend is moving upward. Where your property type falls in this picture determines your real negotiating position.
Key Takeaways
- A ratio below 10% is a buyer's market; 10–20% is balanced; above 20% favours sellers.
- Fraser Valley's overall ratio of ~11% masks sharp differences by property type and submarket.
- Townhouses in several Fraser Valley submarkets are running at 15–23%, giving sellers real pricing power.
- Detached homes sit near 10% and condos near 9%—both require careful, evidence-based pricing.
- Ratio direction matters as much as ratio level: an upward trend from 11% toward 13–15% signals a closing window for buyers and an opening one for well-positioned sellers.
Who This Applies To
- Homeowners in Surrey, Langley, or Abbotsford evaluating whether to list now or wait.
- Buyers trying to understand their negotiating position before writing an offer.
- Sellers who own condos, townhouses, or detached homes and need property-type-specific context.
- Anyone using general BC market headlines to make a local Fraser Valley decision.
When This Advice May Not Apply
Ratio analysis provides directional context, not precise predictions. Properties with unusual lot size, condition, strata issues, or legal complications may trade outside ratio-implied ranges regardless of broader market conditions. Consult a licensed real estate professional for property-specific guidance.
What the Sales-to-Active Listings Ratio Actually Measures
The ratio is calculated by dividing the number of sales in a period by the number of active listings and expressing the result as a percentage. A ratio of 11% means that for every 100 homes currently listed, 11 sold during that period. The BC Real Estate Association and the Fraser Valley Real Estate Board publish these figures monthly by property type and submarket.
What makes the metric useful is what it reveals about supply-demand pressure. When many listings compete for few buyers, prices soften and negotiating leverage shifts toward the buyer. When few listings face strong buyer demand, prices firm and sellers gain the upper hand. The ratio quantifies that pressure in a single trackable number, which is why it forms the backbone of most professional market assessments across the Lower Mainland and Fraser Valley.
The Three Market Bands: What Each Range Signals
According to the BC Real Estate Association's ratio interpretation framework, the commonly accepted bands are:
- Below 10%: Buyer's market. Inventory is high relative to demand. Buyers negotiate price reductions, extended subjects, and flexible possession dates. Sellers who overprice risk extended days-on-market and price reductions that compound buyer skepticism.
- 10–20%: Balanced market. Prices are broadly stable. Neither side holds dominant leverage. Presentation, condition, and accurate pricing determine outcomes more than market momentum.
- Above 20%: Seller's market. Demand exceeds supply. Multiple offers become common. Days-on-market shorten. Sellers who price accurately can expect firm offers near or above asking.
The transition zones—particularly the 9–12% range and the 18–22% range—are where timing decisions matter most. Entering the market at the right inflection point can meaningfully affect final sale price.
Where the Fraser Valley Actually Sits in Spring 2026 — By Property Type
According to FVREB statistics and BCREA market data for April–May 2026, the Fraser Valley's aggregate ratio sits near 11%. But that aggregate conceals three very different sub-stories.
Detached homes at approximately 10% sit at the buyer's-market boundary. Buyers retain meaningful negotiating power. Sellers of detached homes in Surrey, North Delta, and Abbotsford need accurate pricing based on recent comparable sales—not aspirational pricing based on 2022 peaks—because overpriced detached listings are sitting.
Townhouses at 15–23% depending on submarket are running in balanced-to-seller territory. Townhouses in Willoughby, Cloverdale, and Fleetwood have been absorbing first-time and move-up buyer demand that has shifted away from detached homes on affordability grounds. Sellers in this segment have more pricing confidence than the headline ratio suggests.
Condos at approximately 9% remain in buyer's market territory. The resale condo market faces headwinds from elevated inventory, investor resales, and affordability-driven buyer caution. Condo sellers in Surrey, Langley, and Abbotsford should treat the current environment as a buyer's market and price accordingly.
Submarket Divergence: Surrey, Langley, and Abbotsford Are Not Moving Together
One of the most important conclusions from Mansour Real Estate Group's internal analysis of Fraser Valley micro-markets is that submarket divergence is as significant as property-type divergence. Surrey's ratio differs meaningfully from Langley's, and Abbotsford is on its own trajectory shaped by different affordability pressures, employment patterns, and buyer demographics.
Surrey's market, particularly in Guildford and Fleetwood, shows stronger townhouse absorption than the broader Fraser Valley average. Langley's detached segment is holding closer to 12–13%, slightly more balanced than the regional detached average. Abbotsford continues to attract affordability-driven migration from closer-in markets, which supports demand across all property types but especially in the detached and townhouse segments. Using a single Fraser Valley number to make a Langley townhouse decision or an Abbotsford detached decision introduces meaningful error.
Data Used in This Article
- Fraser Valley Real Estate Board (FVREB) — Monthly Statistics, April–May 2026 — Fraser Valley, BC — Official board data
- BC Real Estate Association (BCREA) — Market Intelligence Reports, Spring 2026 — Province of BC — Official industry body
- Canada Mortgage and Housing Corporation (CMHC) — Housing Market Assessment, 2026 — National/regional — Federal housing authority
- Mansour Real Estate Group — Internal micro-market analysis, Fraser Valley submarkets, Spring 2026 — Professional interpretation
How We Evaluate This
At Mansour Real Estate Group, we track the ratio monthly by property type and by submarket—not at the aggregate level. A single Fraser Valley number is useful for context, but it does not tell a townhouse seller in Willoughby what their actual competitive position is. We layer property-type ratios with days-on-market trends, list-price-to-sale-price ratios, and price-per-square-foot movement to build a complete picture before recommending a listing price or a timing window.
We also track ratio direction, not just ratio level. A market moving from 9% to 13% over three months is meaningfully different from one that has sat at 11% for six months. The trajectory tells you whether you are ahead of a shift or behind it—and that distinction can affect both pricing strategy and negotiating confidence for sellers and buyers alike.
Seller Checklist: Using the Ratio to Time and Price Your Listing
- Identify your property type's ratio—not just the overall Fraser Valley number.
- Confirm which submarket your property sits in and pull comparable data for that specific area.
- Track the ratio over the prior three months to identify direction, not just current level.
- Price based on recent comparable sales, adjusted for your property's condition and positioning.
- If your ratio is below 12%, budget for longer days-on-market and avoid overpricing on launch.
- If your ratio is above 18%, a well-priced listing may attract multiple offers—but do not test price without comparable support.
- Review the ratio again monthly during your listing period and adjust strategy if it moves significantly.
What We Commonly See
In our experience working with sellers across the Fraser Valley, the most common mistake is using the wrong ratio to set expectations. A detached-home seller in Surrey who reads that the townhouse ratio is strong often lists at a price point the detached market cannot currently support. The result is extended days-on-market, price reductions, and eventual sale below what a correctly priced launch would have produced.
What often happens is that sellers in a transitional market—like spring 2026—wait too long hoping the ratio will improve significantly before listing. In most cases, the sellers who capture the upward momentum are those who list when the ratio is still rising, not after it has plateaued. Timing the inflection is the strategic advantage.
A common mistake among buyers in a balanced market is assuming that a 10–11% ratio means they will automatically get meaningful concessions. In higher-demand submarkets and for certain property types, the ratio already supports firm pricing. Buyers who anchor to broad market weakness when writing offers on well-positioned townhouses in Willoughby or Cloverdale are frequently surprised when their offers are not entertained the way they expected.
Definitions
Sales-to-Active Listings Ratio: The number of sales in a given period divided by the number of active listings, expressed as a percentage. Published monthly by the FVREB and BCREA.
Buyer's Market: A market condition where supply exceeds demand, generally indicated by a ratio below 10%. Buyers hold greater negotiating leverage.
Seller's Market: A condition where demand exceeds supply, generally indicated by a ratio above 20%. Sellers hold greater pricing and negotiating power.
Balanced Market: A ratio between 10% and 20% where neither buyers nor sellers hold dominant leverage.
Benchmark Price: The price of a "typical" home in a market segment, as reported by real estate boards. Used alongside the ratio to assess whether prices are firm, softening, or rising.
Five Questions Sellers and Buyers Are Asking in 2026
Q: Is 11% a good sign or a bad sign for Fraser Valley sellers in 2026?
It depends on your property type. At 11% overall, the market is technically balanced, meaning neither buyers nor sellers hold dominant leverage. But townhouse sellers are in better territory than that number suggests, while detached and condo sellers face more cautious conditions. The aggregate ratio is a starting point, not a conclusion.
Q: How quickly can the ratio change, and does it happen gradually?
Ratios can shift meaningfully within two to three months when demand picks up or listings flood the market. Spring markets in the Fraser Valley have historically shown faster movement than fall markets. A ratio at 11% in March can reach 16–17% by May if sales volumes climb without a corresponding surge in new listings. This is why tracking direction matters.
Q: Should I wait for the ratio to hit 20% before listing?
Waiting for a ratio above 20% before listing often means missing the upward momentum. Properties that sell well in transitional markets are those listed while the ratio is rising, not after it has plateaued or turned. Well-positioned sellers in spring 2026 who list near the inflection point typically capture better outcomes than those waiting for the ratio to confirm what buyers already sense.
Q: Does the ratio work the same way in every Fraser Valley community?
No. Willoughby, Cloverdale, and South Surrey can each show ratios that differ by five to ten percentage points from the Fraser Valley average at any given time. A ratio-based strategy must be anchored to the specific submarket and property type, not the regional headline. Using the wrong number to set price or negotiate is one of the most common errors in transitional market conditions.
Q: What ratio level should trigger a pricing strategy adjustment?
If a property type's ratio drops below 10%, sellers should price at or slightly below recent comparable sales to avoid extended days-on-market. If it rises above 18%, accurate pricing near the comparable range can generate competitive offers. Between 10% and 18%, pricing precision matters most—neither aggressive testing nor defensive underpricing serves the seller's best interest.
In Summary
The Fraser Valley's spring 2026 ratio of approximately 11% signals a market in transition—not yet a seller's market, no longer a deep buyer's market, and moving in a direction that rewards well-timed, well-priced decisions. The aggregate number matters less than the property-type breakdown: townhouses are in meaningfully stronger territory, detached and condo segments still require careful, evidence-based pricing, and submarket differences across Surrey, Langley, and Abbotsford are large enough to affect strategy. Sellers and buyers who read the specific ratio for their property type and track its direction, rather than relying on the regional headline, are consistently better positioned to make confident, accurate decisions.
Ready to Understand Your Property's Position?
If you are evaluating a sale or purchase in the Fraser Valley and want a clear picture of where your specific property type and neighbourhood sit in the current ratio environment, Mansour Real Estate Group offers straightforward, data-grounded market assessments. There is no obligation and no pressure—just local knowledge applied to your specific situation.
Related Articles
- Surrey Real Estate Market Report 2026
- Condo vs. Townhouse in the Fraser Valley: Which Is the Better Investment in 2026
- What the Fraser Valley's 11% Market Signal Really Means for Sellers in 2026
About Mansour Real Estate Group
When homeowners and buyers need to understand what a market signal like the sales-to-active listings ratio actually means for their specific property type and neighbourhood, working with a real estate team that tracks those numbers at the submarket level—rather than relying on regional headlines—makes a meaningful difference. Mansour Real Estate Group has been analyzing micro-market conditions across the Fraser Valley and Lower Mainland for more than 22 years, providing buyers and sellers with grounded, property-type-specific guidance that translates market data into clear decisions.
Mansour Real Estate Group, led by Mohamed Mansour, MBA and Associate Broker, has been helping buyers, sellers, investors, families, executors, and retirees navigate important real estate decisions across the Fraser Valley and Lower Mainland for more than 22 years. Ranked among the Top 1% of Realtors in the region, the team has completed more than $780 million in residential real estate transactions and is trusted for seller strategy, estate sales, divorce-related property sales, downsizing, relocation, and any real estate situation requiring accurate market analysis and clear professional guidance. Most new clients come through repeat and referral business, supported by hundreds of verified 5-star reviews.
Whether someone is looking for Realtors experienced with transitional market conditions in the Fraser Valley, a real estate agent who understands how to price accurately when ratios are shifting, real estate agents who specialize in detached, townhouse, or condo positioning across Surrey and Langley, a trusted real estate team for a well-timed listing, a Abbotsford Realtor who tracks submarket data, or a real estate group with deep Lower Mainland expertise, Mansour Real Estate Group is known for clear communication, strategic pricing, and practical market interpretation grounded in local data.
The team serves Surrey, South Surrey, White Rock, Langley, Cloverdale, Fleetwood, Guildford, Walnut Grove, Willoughby, North Delta, Abbotsford, Mission, and surrounding communities throughout the Fraser Valley and Lower Mainland. Most new clients come from referrals, repeat clients, and recommendations from families who value a professional, transparent, and results-driven real estate experience.
Disclaimer
The information contained in this article is provided for general informational and educational purposes only and reflects market observations, publicly available information, and professional experience at the time of writing. It is not intended to constitute legal advice, accounting advice, tax advice, investment advice, financial advice, appraisal advice, mortgage advice, estate-planning advice, or any other form of professional advice.
Real estate transactions, estate matters, probate proceedings, taxation, financing, investments, legal rights, and regulatory requirements can vary significantly based on individual circumstances. Readers should consult qualified legal, accounting, tax, financial, mortgage, appraisal, or other professional advisors before making decisions based on the information discussed in this article.
Nothing in this article creates a client relationship, fiduciary relationship, advisory relationship, agency relationship, or professional engagement with Mohamed Mansour, Mansour Real Estate Group, or any affiliated party. Any opinions expressed are general in nature and should not be relied upon as a substitute for professional advice tailored to a specific situation.
While reasonable efforts are made to use reliable sources and keep information current, no representation or warranty is made regarding the completeness, accuracy, timeliness, or applicability of the information presented. Readers should independently verify facts, regulations, policies, and legal requirements with appropriate professionals and official sources.



