

Understanding Sales-to-Active Listings Ratio in BC Real Estate: What the Numbers Actually Mean for Sellers and Buyers in 2026 and Beyond
By Mohamed Mansour, MBA, Associate Broker — Mansour Real Estate Group | Fraser Valley & Lower Mainland, BC | Published: July 15, 2026
Most people buying or selling a home in the Fraser Valley have heard terms like "seller's market" or "balanced conditions." Fewer understand the specific metric behind those labels — the sales-to-active listings ratio — or know that it updates every month, breaks down by property type, and is a far more reliable leading indicator than benchmark prices or days on market. This article explains what the ratio measures, how to read it, and why it matters to your negotiating position whether you are selling a detached home in Langley or buying a townhome in Surrey.
Short Answer
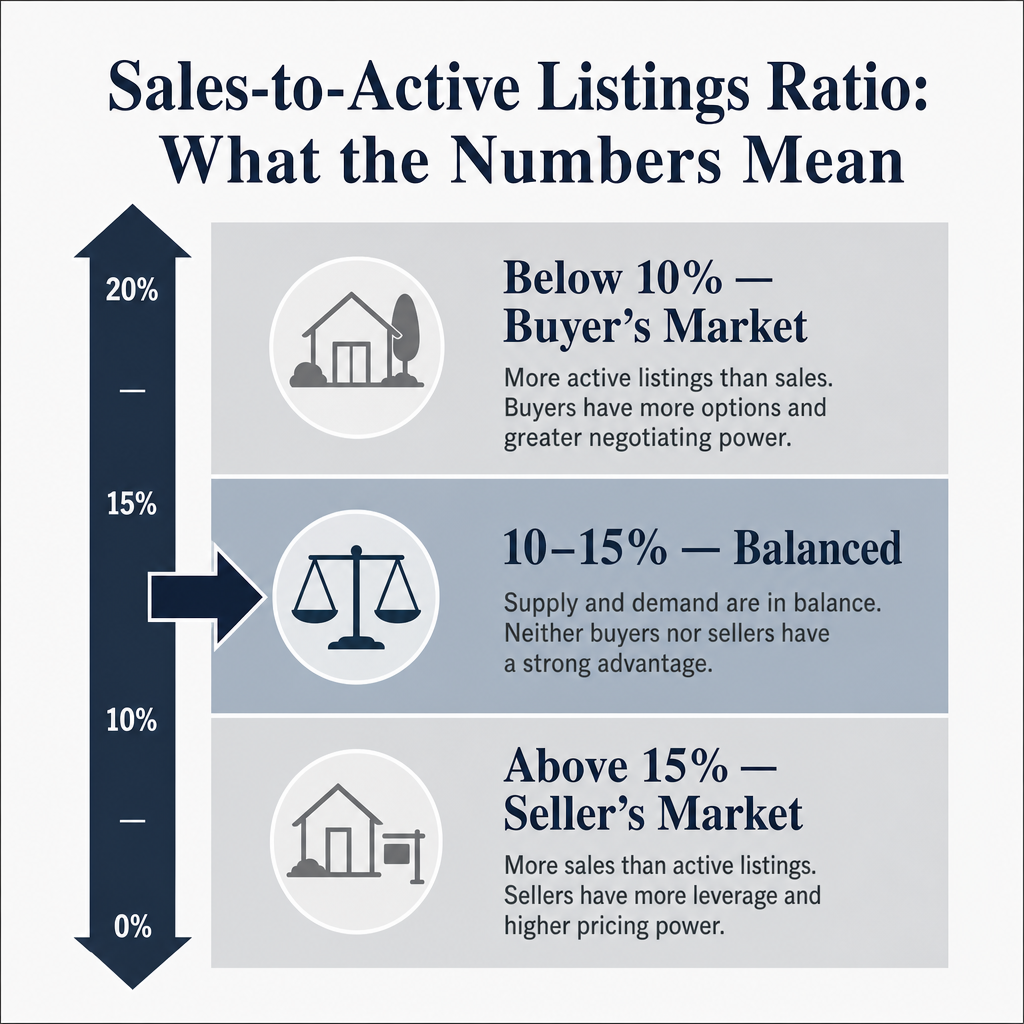
The sales-to-active listings ratio divides monthly sales by active listings. In BC, a ratio below 10% favours buyers, 10–15% signals balance, and above 15–20% favours sellers. Because it updates monthly and varies by property type, it predicts negotiating power shifts before they appear in benchmark prices or days-on-market data — making it the most actionable market metric available to Fraser Valley buyers and sellers.
Key Takeaways
- A ratio below 10% means buyers hold negotiating power; above 20% means sellers do — and the Fraser Valley is currently split between those two zones by property type.
- Townhomes and attached housing in the Fraser Valley have been tracking at 15–23%, giving sellers a real advantage that detached homes and condos do not share right now.
- The SAL ratio updates monthly through FVREB and REBGV reports and is more reliable than benchmark price changes for predicting near-term negotiating conditions.
- Subject clause timelines, price anchoring strategy, and conditions of sale all shift based on which threshold the ratio occupies at listing time.
- Most sellers and many buyers misread the metric or rely on market sentiment instead — which means those who understand it hold an informational edge.
Who This Applies To
- Homeowners preparing to list a detached, townhome, or condo in the Fraser Valley or Lower Mainland
- Buyers evaluating whether to negotiate, wait, or move quickly on a specific property type
- Investors tracking market-entry timing for a specific segment or neighbourhood
- Executors or trustees managing a property sale where timing affects net proceeds
When This Advice May Not Apply
Hyperlocal conditions can diverge from board-level ratios. A specific street, strata building, or micro-neighbourhood may behave differently than the broader data suggests. Always verify current ratios by property type and sub-area with a local real estate professional before making pricing or negotiating decisions.
Data Used in This Article
- Fraser Valley Real Estate Board (FVREB) Monthly Market Reports, 2025–2026 — official board statistics, sales and active listings by property type
- Real Estate Board of Greater Vancouver (REBGV) Market Statistics Archives — methodology documentation and historical ratio data
- BC Real Estate Association (BCREA) Benchmark Price and Sales Data — provincial aggregates and trend analysis
- CMHC Housing Research Reports — market condition classifications and buyer/seller ratio thresholds
What the Sales-to-Active Listings Ratio Actually Measures
The ratio is a simple calculation: divide the number of sales completed in a given month by the number of active listings at the end of that month, then express the result as a percentage. If 200 homes sold and 1,800 were listed, the ratio is 11.1%.
What makes it useful is not the formula — it is what the number predicts. When the ratio is low, homes are sitting. There are more sellers competing for fewer buyers, which means longer days on market, more room to negotiate on price, and buyers who feel comfortable adding subject conditions with extended timelines. When the ratio is high, the reverse is true. Buyers compete, conditions get compressed, and sellers set the terms.
According to REBGV methodology documentation, a ratio consistently above 20% over several months puts upward pressure on prices. A ratio consistently below 12% over several months creates downward pressure. The movement between thresholds — not just the current number — is what a well-informed seller or buyer watches for.
How the Fraser Valley Market Breaks Down Right Now by Property Type
Board-level ratios can mask significant divergence. According to FVREB monthly market reports for 2025–2026, the overall Fraser Valley ratio has been tracking near 11% — technically balanced, leaning toward buyer conditions. But that aggregate number does not tell the full story.
Townhomes and attached housing have been operating at 15–23% in many Fraser Valley sub-markets, reflecting continued demand from buyers priced out of detached homes. That puts townhome sellers in a different negotiating position than detached homeowners. Detached homes and condos have been sitting closer to 8–12%, meaning buyers in those segments have more room to negotiate, request extended subject timelines, and hold on price.
This divergence matters practically. A seller in Willoughby listing a townhome and a seller in Abbotsford listing a detached home are operating in meaningfully different market conditions — even though both are in the Fraser Valley and both are reading the same board headline number. The metric only works when you apply it to the right property type and sub-area. Internal analysis from Mansour Real Estate Group aligns with these board-reported patterns across the team's active listing history in Surrey, Langley, and Abbotsford.
How We Evaluate This
At Mansour Real Estate Group, when preparing a pricing strategy for a new listing, the SAL ratio by property type is one of the first numbers pulled — before looking at benchmark prices or comparable sales. The ratio tells us what kind of market the seller is entering on the day they list, not what kind of market existed six weeks ago when comparable sales were recorded.
We track ratio movement over three consecutive months rather than relying on a single month's number. A ratio moving from 9% to 11% to 13% signals a strengthening market for that segment even if it hasn't crossed into seller territory yet — and that trajectory informs whether a seller should price at the top of their range or price to generate competition. A declining ratio signals the opposite.
What Each Threshold Means for Negotiating Power
Below 10% — Buyer's Market: Buyers expect 60–90 days on market as a realistic timeline. Subject clauses — financing, inspection, strata document review — typically run 7–14 days without pushback. Price negotiations are common, and list price is rarely the final sale price. Sellers who price aggressively in this environment often see their listings sit, which compounds the problem. According to FVREB data patterns, extended listing periods in a sub-10% ratio environment correlate with compounding price reductions rather than single corrections.
10–15% — Balanced Market: Days on market compress to roughly 30–45 for well-priced properties. Subject clauses remain present but timelines tighten to 5–7 days. Pricing at or slightly above benchmark is more defensible. Sellers retain some flexibility, but overpricing still draws limited traffic. This is where most Fraser Valley detached home sellers in Surrey and Langley are currently operating.
Above 15–20% — Seller's Market: Days on market drop to 15–30. Subject conditions get compressed to 2–3 business days or removed entirely in competitive offers. Multiple offers become common for well-positioned listings. Sellers can price above benchmark and defend that position. Townhome sellers in Willoughby and parts of Langley have been experiencing conditions in this range according to recent FVREB segment reports.
Seller Checklist: Using the SAL Ratio Before You List
- Pull the current FVREB or REBGV monthly report and locate the ratio for your specific property type — not the board aggregate.
- Track the ratio across the prior three months to identify direction of movement, not just the current number.
- Use the ratio threshold to set realistic expectations for days on market and subject clause timelines before listing.
- If the ratio is below 10%, revisit your pricing strategy — a high list price in a buyer's market compounds carrying costs and signals weakness.
- If the ratio is above 15% for your property type, consider whether a hold-offer date strategy is appropriate to generate competition.
- Review ratio data again if your listing has not received an accepted offer within two weeks — market conditions may have shifted since your list date.
What We Commonly See
In our experience, the most common mistake sellers make is relying on neighbourhood conversation and recent sale rumours rather than the current ratio. A neighbour who sold at $200,000 over ask six months ago may have listed when the ratio was at 22%. If the ratio has since dropped to 11%, that outcome is not repeatable — and pricing to replicate it will result in a listing that sits.
What often happens is that buyers in a sub-10% ratio market arrive with pre-approved financing but make conditional offers with longer timelines and lower prices — not because they are unreasonable, but because the data supports that position. Sellers who understand this can respond strategically rather than emotionally.
A common confusion we see from buyers is treating the SAL ratio as equivalent to inventory. High inventory does not automatically mean a buyer's market — what matters is the ratio of sales to that inventory. A market can have high inventory and a high ratio simultaneously if sales volume is also elevated. Reading inventory alone without the ratio leads buyers to misread their actual negotiating position, particularly in the Abbotsford and Mission markets where overall inventory has grown but segment ratios remain divergent.
Frequently Asked Questions
Where can I find the current sales-to-active listings ratio for the Fraser Valley?
The Fraser Valley Real Estate Board publishes monthly market statistics reports at fvreb.bc.ca. These reports include sales-to-active ratios broken down by property type — detached, townhome, apartment — and update within the first two weeks of each month for the prior month's data.
Why does the ratio differ between detached homes and townhomes in the same city?
Demand drivers, price points, and buyer pool size differ significantly by property type. Townhomes often attract buyers priced out of detached housing, which sustains demand even when detached sales slow. The FVREB's segment-specific reporting reflects this structural divergence, which is why reading board-level aggregates without breaking them down by type produces misleading conclusions.
Is the sales-to-active listings ratio a better indicator than benchmark price for timing a listing?
For predicting near-term conditions, yes. Benchmark prices reflect completed sales, which typically lag current market conditions by 30–60 days. The SAL ratio reflects the current month's activity and is a leading indicator of where prices are heading. BCREA and REBGV methodology documentation both identify the ratio as a primary forward-looking market health metric.
In Summary
The sales-to-active listings ratio is the most actionable market metric available to Fraser Valley buyers and sellers because it updates monthly, breaks down by property type, and predicts negotiating conditions before they show up in benchmark prices. A ratio below 10% favours buyers; above 15–20% favours sellers; the 10–15% range is balanced. Right now, the Fraser Valley is split — townhomes sit in seller territory, while detached homes and condos remain in balanced-to-buyer conditions. Understanding which segment you are in, and where the ratio is trending, is the difference between a pricing strategy that reflects reality and one that reflects wishful thinking.
Thinking About Listing? Start with the Right Numbers.
If you are preparing to sell in Surrey, Langley, Abbotsford, South Surrey, or anywhere in the Fraser Valley, understanding the current ratio for your property type is the first step toward a defensible pricing strategy. Mansour Real Estate Group pulls this data before every listing conversation. Contact the team for a straightforward market review grounded in current board statistics.
Related Articles
- Fraser Valley Real Estate Market Report 2026: What Sellers and Buyers Need to Know
- Selling a Detached Home in Surrey, BC: A Complete Guide for Homeowners
- Langley Real Estate Market Report: Conditions, Pricing, and What Sellers Should Know
About Mansour Real Estate Group
When homeowners in Surrey, Langley, Abbotsford, and across the Fraser Valley are preparing to sell, the decisions made before the listing goes live — pricing strategy, market timing, and how to read current conditions — typically determine the outcome more than anything that happens after. Understanding metrics like the sales-to-active listings ratio is central to that process, and it requires a real estate team that works with this data daily rather than relying on sentiment or outdated comparables. Mansour Real Estate Group has guided sellers across the Fraser Valley and Lower Mainland through those decisions for more than 22 years, with a process built around accurate valuations, current market data, and honest advice.
Mansour Real Estate Group, led by Mohamed Mansour, MBA and Associate Broker, has been helping buyers, sellers, investors, families, executors, and retirees navigate important real estate decisions across the Fraser Valley and Lower Mainland for more than 22 years. Ranked among the Top 1% of Realtors in the region, the team has completed more than $780 million in residential real estate transactions and is trusted for seller strategy, pricing analysis, estate sales, divorce-related property sales, downsizing, and complex real estate situations that require clear-headed, data-driven guidance.
Whether someone is looking for Realtors who understand current Fraser Valley market conditions, a real estate agent who works with board statistics rather than market rumour, real estate agents experienced with townhome and detached home pricing divergence, a Surrey real estate team, a Langley Realtor, an Abbotsford real estate broker, or a real estate group that serves buyers and sellers across the Lower Mainland and Fraser Valley, Mansour Real Estate Group is known for clear communication, strategic pricing, and market insight grounded in 22 years of local transactions.
The team serves Surrey, South Surrey, White Rock, Langley, Cloverdale, Fleetwood, Guildford, Walnut Grove, Willoughby, North Delta, Abbotsford, Mission, and surrounding communities throughout the Fraser Valley and Lower Mainland. Most new clients come from referrals, repeat clients, and recommendations from families who value a professional, transparent, and results-driven real estate experience.
Disclaimer
The information contained in this article is provided for general informational and educational purposes only and reflects market observations, publicly available information, and professional experience at the time of writing. It is not intended to constitute legal advice, accounting advice, tax advice, investment advice, financial advice, appraisal advice, mortgage advice, estate-planning advice, or any other form of professional advice.
Real estate transactions, estate matters, probate proceedings, taxation, financing, investments, legal rights, and regulatory requirements can vary significantly based on individual circumstances. Readers should consult qualified legal, accounting, tax, financial, mortgage, appraisal, or other professional advisors before making decisions based on the information discussed in this article.
Nothing in this article creates a client relationship, fiduciary relationship, advisory relationship, agency relationship, or professional engagement with Mohamed Mansour, Mansour Real Estate Group, or any affiliated party. Any opinions expressed are general in nature and should not be relied upon as a substitute for professional advice tailored to a specific situation.
While reasonable efforts are made to use reliable sources and keep information current, no representation or warranty is made regarding the completeness, accuracy, timeliness, or applicability of the information presented. Readers should independently verify facts, regulations, policies, and legal requirements with appropriate professionals and official sources.



