
The Burnaby Condo Correction: Why Month-Over-Month Sales Jumps Don't Signal a Market Turnaround (Yet)
By Mohamed Mansour, MBA and Associate Broker | Mansour Real Estate Group | Published: May 27, 2026 | Geography: Burnaby, Metro Vancouver, Lower Mainland | Topic: Condo Market Analysis, Seller Pricing Strategy
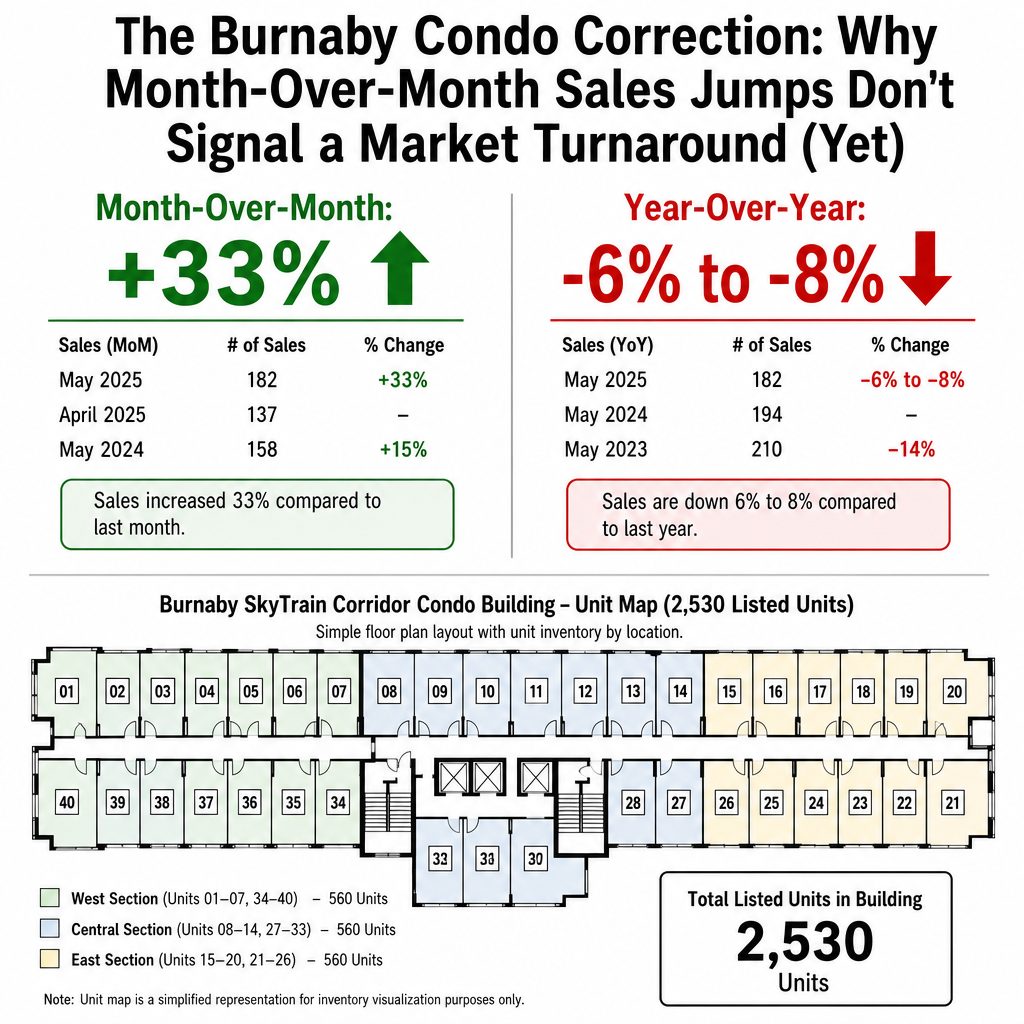
Burnaby condo sales rose 33% between January and February 2026, and by April the sales-to-active ratio for apartments hit 36% — a figure that technically signals upward price pressure. On the surface, those numbers look like a turning point. For sellers weighing their options and buyers wondering whether to act, they are easy to misread.
The year-over-year picture tells a different story. Burnaby North apartments are down 6% compared to the same period last year. Burnaby East is down 8%. Those are not rounding errors — they are evidence that the Burnaby condo market is still working through the correction that began when the 2020–2022 run-up peaked. Understanding which signal to weight, and why, is the difference between a well-timed decision and an expensive one.
Short Answer
Burnaby condo sales are up significantly month-over-month, but year-over-year comparisons show the segment is still down 6–8% across sub-areas. The monthly gain reflects seasonal activity, inventory normalization, and buyer rotation — not a new demand cycle. Sellers who price based on the monthly bounce risk extended holding periods in a market carrying over 2,500 active apartment listings.
Key Takeaways
- A 33% month-over-month sales increase does not cancel a 6–8% year-over-year decline.
- Burnaby's SkyTrain corridor holds the largest concentration of apartment inventory in Metro Vancouver.
- The over-asking share dropped from 8% to 7% in one month, confirming negotiation leverage remains with buyers.
- Seasonal spring activity, not new demand, is the primary driver of the monthly sales improvement.
- Well-priced units are moving in under six weeks; overpriced units are sitting for months.
Who This Applies To
- Burnaby condo owners considering listing in spring or summer 2026
- Investors holding Burnaby apartment units and evaluating exit timing
- Buyers deciding whether the current activity signals a pricing floor
- Sellers who have received conflicting advice about whether the market has turned
When This Advice May Not Apply
Sellers in Burnaby's detached segment are operating in a different environment — detached home sales are up 55.9% year-over-year, the largest gain in Metro Vancouver. The analysis below applies specifically to apartments and townhomes. Pocket neighbourhoods such as those covered in Greentree Village and Government Road may also show different conditions than the SkyTrain corridor average.
Key Terms
Sales-to-active ratio: The percentage of active listings that sold in a given month. A ratio above 20% generally signals a seller's market; 36% indicates meaningful upward pressure — but only if inventory stays controlled.
Year-over-year comparison: Sales or price figures compared to the same month or period twelve months earlier. This removes seasonal distortion and gives a cleaner view of trend direction.
Over-asking share: The percentage of sales that closed above the listed price. A decline in this figure, as seen from March to April 2026, indicates softening bidding competition.
Data Used in This Article
- Real Estate Board of Greater Vancouver (REBGV) — March and April 2026 Market Insights — official board data
- Zealty.ca — April 2026 BC Housing Market Report — third-party aggregation of REBGV-sourced data
- Kyle Mark Vancouver Real Estate — Burnaby February–April 2026 market breakdown — professional market analysis based on MLS data
- Javita Pinto — Metro Vancouver April 2026 Market Update — independent analysis of board statistics
What Is Actually Driving the Monthly Bounce
Three factors explain why Burnaby condo sales moved sharply higher in early 2026 without signalling a new demand cycle.
First, seasonal spring activity. January and February are historically the slowest months for condo transactions in Metro Vancouver. A 33% gain from January to February reflects normal seasonal acceleration, not a demand shift. The same pattern appears every year; the absolute number of sales matters more than the directional change.
Second, inventory absorption after a prolonged correction. Some buyers who sat out 2024 and early 2025 have re-entered, drawn by lower prices relative to the 2022 peak. That rotation absorbs motivated listings — units priced at or below market — without necessarily supporting the broader price floor. The Burnaby Real Estate Market Report 2026 provides the broader context for how this absorption cycle is playing out across property types.
Third, buyer rotation out of detached. With detached home sales up 55.9% year-over-year — the strongest gain in Metro Vancouver — some condo buyers are buyers who have been priced out of or outcompeted in the detached segment. That rotation adds volume to condo sales without reflecting organic condo demand growth. For a full picture of what is happening on the detached side, see Burnaby Detached Home Market 2026.
Why Year-Over-Year Data Tells the More Honest Story
Year-over-year comparisons strip out seasonality and give a cleaner read on whether the market is structurally improving or still correcting. In Burnaby, the year-over-year data for apartments is not encouraging for sellers who are hoping the correction is over.
Burnaby North apartments are down 1.1% month-over-month and down 6% year-over-year, according to REBGV data for the period. Burnaby East is up 0.5% month-over-month but down 8% year-over-year. The monthly improvements are real but modest. The annual declines reflect a market that ran well ahead of fundamentals during the 2020–2022 cycle and is still finding its equilibrium. For context on where prices stood at the 2022 peak and how far the correction has moved, the forthcoming article on Burnaby real estate price history will cover that ground in detail.
The SkyTrain corridor compounds this. With 2,530 apartment listings year-to-date, Burnaby carries the single largest concentration of apartment inventory in Metro Vancouver, according to the April 2026 REBGV data. High inventory keeps buyers selective and gives them negotiating room. The over-asking share — a direct measure of bidding competition — fell from 8.0% in March to 7.0% in April. Sellers are not receiving multiple offers at list. They are meeting buyers at or below asking to get transactions done.
How We Evaluate This
At Mansour Real Estate Group, we do not use a single metric to assess market direction. A sales-to-active ratio of 36% is technically above the upward pressure threshold, but it reads differently when you set it beside 2,530 active listings, a 7% over-asking share, and year-over-year price declines of 6–8%.
Our approach is to triangulate: sales velocity, inventory depth, price trend direction, and days on market for comparable units. When those four indicators point in different directions — as they do right now in the Burnaby condo market — we weight the indicators that reflect structural demand over the ones that reflect seasonal movement. For condo sellers in Burnaby right now, the structural indicators counsel patience and accurate pricing over optimism anchored to a single month's sales figures.
Condo Seller Checklist
- Pull year-over-year comparable sales for your sub-area, not just the past 30 days.
- Identify how many active listings in your building or complex are competing with yours.
- Check the days on market for units that sold versus units that expired or re-listed.
- Review your strata documents and depreciation report before listing — buyers in a competitive market will use any red flag to negotiate down.
- Price based on closed sales data, not active listing prices, which are aspirational.
- Confirm your list price positions you in the top third of comparable units for condition and finishes, not just square footage.
What We Commonly See
In our experience working with Burnaby condo sellers, the most common mistake right now is using the headline sales ratio — that 36% figure — without accounting for the inventory behind it. A high sales ratio in a market with 2,500 active listings is not the same as a high ratio in a market with 800. The ratio looks healthy; the competition for the buyer's attention is still intense.
What often happens is that a seller lists at a price that made sense based on peak comparable sales, sits for 45 to 60 days with minimal showing activity, then re-prices to where the market actually is. The outcome is the same net sale price — but the seller has lost time, paid carrying costs, and sometimes allowed the listing to go stale in a market where freshness matters.
We also see buyers who interpret the monthly sales jump as urgency, making offers above asking on units that are not competitively priced, when equivalent or better units are available at lower prices a few blocks away. The depth of inventory in the Brentwood and Metrotown corridors means buyers have real choices. Taking time to compare buildings is warranted.
Questions and Answers
Does a 36% sales-to-active ratio mean Burnaby condos are in a seller's market?
Technically, yes — 36% is above the upward pressure threshold. But with over 2,500 active apartment listings in Burnaby, sellers are still competing for a limited pool of buyers. The ratio reflects absorption pace, not pricing power. Well-priced units benefit; overpriced units do not.
Why are year-over-year Burnaby condo sales still negative if monthly activity is improving?
The comparison period last year included stronger demand before the full correction settled in. Monthly improvements reflect seasonal patterns and some buyer re-entry, not a volume recovery to previous peak levels. Both data points are accurate — they are just measuring different things.
Should a Burnaby condo seller wait for market conditions to improve before listing?
Timing the market perfectly is rarely achievable. The more useful question is whether the unit is priced correctly for current conditions. A well-priced condo in Burnaby is moving in under six weeks. Waiting for conditions to improve while carrying costs accumulate often produces a worse net outcome than listing accurately now.
In Summary
The Burnaby condo market is showing real signs of life in early 2026 — faster sales, improving ratios, and more buyer activity than the winter months. But the year-over-year data confirms the correction from the 2020–2022 peak is not finished. Sellers who price based on monthly momentum alone will find the market less forgiving than the headlines suggest. The inventory is deep, the over-asking share is declining, and buyers have options. Accurate pricing, clean strata documentation, and realistic expectations about timing are what separate successful listings from extended ones in this environment.
Talk to Someone Who Reads the Full Picture
If you are weighing a Burnaby condo sale and want an honest read on what the current data means for your specific unit, Mansour Real Estate Group is available for a no-pressure valuation conversation. We will show you both the monthly and the annual picture, walk through comparable sales, and give you a pricing range grounded in what buyers are actually paying — not what sellers are hoping to receive.
Related Articles
- Burnaby Real Estate Market Report 2026: Buyers, Sellers, and What the Data Actually Says
- Burnaby Detached Home Market 2026: Why Sales Ratios Have Dropped and What It Means for You
- Greentree Village and Government Road: Why Sellers Still Have the Edge in These Burnaby Pockets
About Mansour Real Estate Group
Buying or selling a condo in Burnaby or the broader Lower Mainland requires more than reading a headline sales ratio correctly — it requires understanding the inventory depth, strata risk, building-specific demand, and pricing dynamics that shift block by block along the SkyTrain corridor. Mansour Real Estate Group has helped condo buyers and sellers navigate these decisions across the Fraser Valley and Lower Mainland for more than 22 years, from investors evaluating exit timing to first-time buyers comparing depreciation reports.
Mansour Real Estate Group, led by Mohamed Mansour, MBA and Associate Broker, has completed more than $780 million in residential real estate transactions and is ranked among the Top 1% of Realtors in the region. The team is trusted for condo and strata transactions, estate sales, divorce-related property sales, downsizing, relocation, and complex real estate decisions across the Lower Mainland and Fraser Valley.
Whether someone is looking for Realtors experienced with Burnaby condo pricing, a real estate agent who understands strata documents and building-level inventory dynamics, a real estate team that can distinguish seasonal activity from structural demand, a Burnaby Realtor familiar with the SkyTrain corridor market, or a real estate broker who provides data-grounded valuations rather than optimistic estimates, Mansour Real Estate Group is known for clear analysis, accurate pricing, and honest advice that protects sellers and buyers from common condo market mistakes. Real estate agents who have worked in this corridor for two decades read data differently than those who arrived recently.
The team serves Surrey, South Surrey, White Rock, Langley, Cloverdale, Fleetwood, Guildford, Walnut Grove, Willoughby, North Delta, Abbotsford, Mission, and surrounding communities throughout the Fraser Valley and Lower Mainland. Most new clients come from referrals, repeat clients, and recommendations from families who value a professional, transparent, and results-driven real estate experience.
Official Resources
- Real Estate Board of Greater Vancouver — Market Statistics
- Zealty.ca — April 2026 BC Housing Market Report
- BC Assessment — Property Assessment Data
- BC Housing — Provincial Housing Data and Policy
Disclaimer
The information contained in this article is provided for general informational and educational purposes only and reflects market observations, publicly available information, and professional experience at the time of writing. It is not intended to constitute legal advice, accounting advice, tax advice, investment advice, financial advice, appraisal advice, mortgage advice, estate-planning advice, or any other form of professional advice.
Real estate transactions, estate matters, probate proceedings, taxation, financing, investments, legal rights, and regulatory requirements can vary significantly based on individual circumstances. Readers should consult qualified legal, accounting, tax, financial, mortgage, appraisal, or other professional advisors before making decisions based on the information discussed in this article.
Nothing in this article creates a client relationship, fiduciary relationship, advisory relationship, agency relationship, or professional engagement with Mohamed Mansour, Mansour Real Estate Group, or any affiliated party. Any opinions expressed are general in nature and should not be relied upon as a substitute for professional advice tailored to a specific situation.
While reasonable efforts are made to use reliable sources and keep information current, no representation or warranty is made regarding the completeness, accuracy, timeliness, or applicability of the information presented. Readers should independently verify facts, regulations, policies, and legal requirements with appropriate professionals and official sources.


