

Surrey Neighbourhood Price Breakdown by Micro-Market 2026: What Your Budget Actually Gets Across Elgin Chantrell, Bridgeview, Clayton, Grandview, Morgan Creek, and Panorama Ridge
By Mohamed Mansour, MBA and Associate Broker | Mansour Real Estate Group | Published: August 12, 2026 | Surrey, BC | Fraser Valley and Lower Mainland
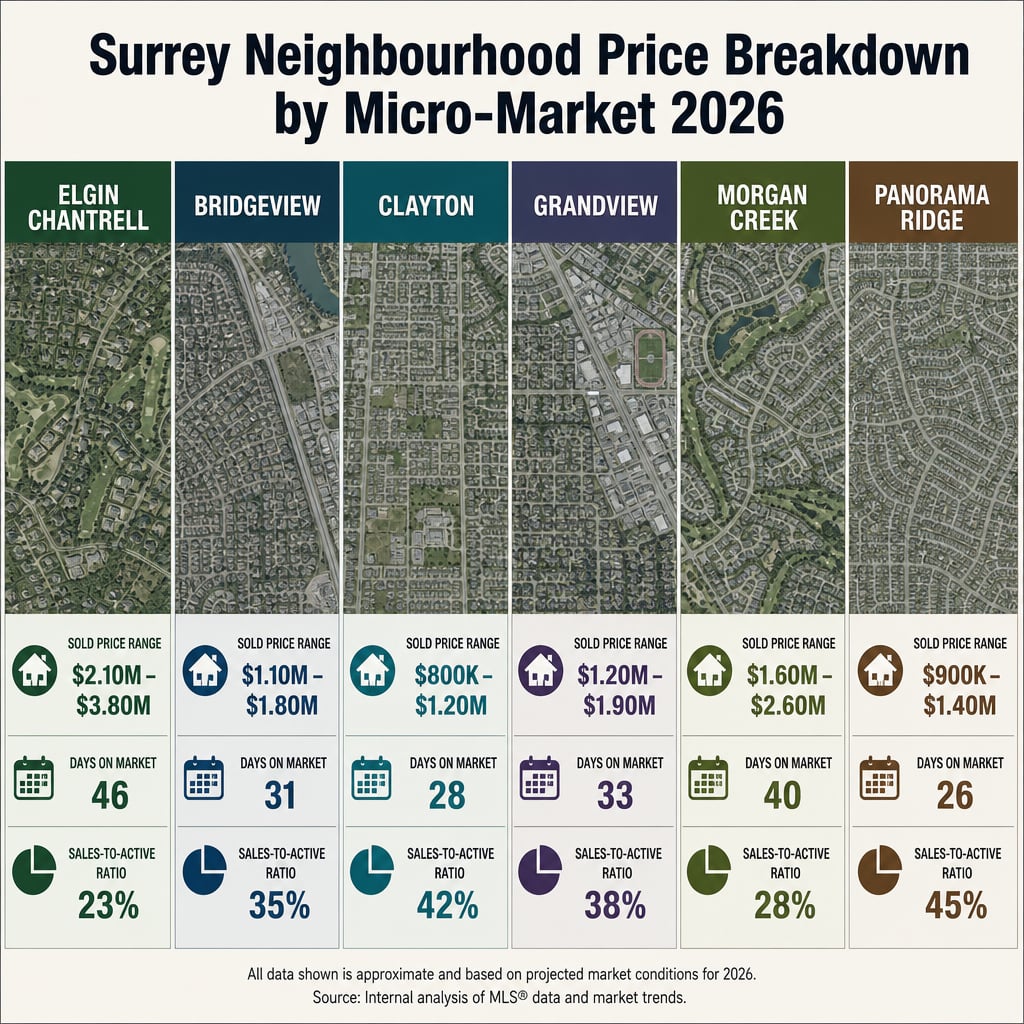
Surrey's city-wide average price tells you almost nothing useful about what you can actually buy — or sell — in a specific neighbourhood. A detached home in Elgin Chantrell and a detached home in Bridgeview both appear in Surrey market reports, yet they operate in entirely separate buyer ecosystems with price differences exceeding 150%. This article breaks down what sold data, days-on-market, and sales-to-active ratios actually show across six distinct Surrey micro-markets in 2026.
This is the third article in the Surrey market cluster. If you haven't read the Surrey 2026 market overview or the property-type performance comparison, those provide the macro foundation this article builds on.
Short Answer
In Surrey's 2026 market, neighbourhood matters more than city-wide conditions. Sold prices range from roughly $903,000 in Bridgeview to $2.27M in Elgin Chantrell. Days-on-market vary from 35–45 days in Morgan Creek and Panorama Ridge to 82–87 days in Elgin Chantrell. Sales-to-active ratios range from 6–8% in softer segments to 20–25% in high-demand family neighbourhoods — variances that city averages completely obscure.
Key Takeaways
- Elgin Chantrell averages $2.27M sold with 82–87 days on market; Bridgeview sits near $903K–$1.1M with faster absorption.
- Morgan Creek and Panorama Ridge show 35–45 day DOM and stronger buyer absorption than the Surrey city-wide average.
- Sales-to-active ratios range from 6–8% in softer attached segments to 20–25% in family-oriented detached neighbourhoods.
- Price-per-square-foot premiums of 12–18% appear in Panorama Ridge and Morgan Creek, driven by school catchments and newer construction.
- The Surrey city-wide 11% sales-to-active average conceals neighbourhood-level variance of approximately 65%.
Who This Applies To
- Buyers comparing Surrey neighbourhoods at specific budget thresholds ($1.2M, $1.5M, $1.8M, $2M+)
- Sellers trying to understand where their property sits in a fragmented local market
- Investors evaluating neighbourhood-level absorption and price-per-square-foot trends
- Families with school-catchment requirements making neighbourhood trade-off decisions
When This Advice May Not Apply
Price ranges reflect general sold data patterns and should not be treated as appraisals. Specific property conditions, lot size, age, and renovation status all affect individual outcomes. Buyers and sellers should request a current comparative market analysis for their specific address before making pricing decisions.
Data Used in This Article
- BC MLS sold data by postal code cluster, spring–summer 2026 (official transaction data)
- FVREB monthly benchmark and sales-to-active statistics by neighbourhood and property type, June–August 2026 (official board data)
- Zolo Elgin Chantrell neighbourhood report: 87-day average DOM, $2.27M sold average (third-party aggregation)
- Mansour Real Estate Group internal neighbourhood sales tracking and DOM benchmarking (professional interpretation)
How We Evaluate This
Our team tracks Surrey micro-markets by comparing sold prices within postal code clusters rather than relying on city-wide benchmarks. When a neighbourhood shows diverging DOM patterns relative to its price tier, that signals either an inventory imbalance or a shift in buyer profile — both of which affect how a property should be priced and positioned. We treat the sales-to-active ratio as the primary temperature gauge for each neighbourhood, updated monthly.
We also cross-reference price-per-square-foot trends within neighbourhood clusters because it reveals whether apparent price drops reflect genuine softness or simply a change in the mix of homes selling. A neighbourhood that shifts from selling 2,800 sq ft homes to 2,000 sq ft homes will show a price decline that isn't real depreciation.
Elgin Chantrell: The Luxury Outlier
Elgin Chantrell operates in a category that rarely intersects with the rest of Surrey's market. According to Zolo's neighbourhood data and BC MLS sold records for spring–summer 2026, average sold prices sit near $2.27M for detached properties, with a typical range of $2M–$3M+. Days-on-market average 82–87 days — the longest of any Surrey micro-market — which reflects both the limited buyer pool for luxury properties and sellers who typically have less urgency than those in lower price tiers.
The buyer profile here skews toward wealth accumulation, empty nesters, and move-up buyers from within South Surrey rather than first-time or family buyers. Sale-to-list ratios near 94.9% mean negotiation room exists but is not dramatic. If you are selling in Elgin Chantrell, pricing at the upper end of comparable solds without a clear differentiator will extend your DOM significantly beyond the neighbourhood average.
For context on how the detached segment performs across the broader Surrey market, the Surrey property-type performance article explains what distinguishes detached recovery patterns from condo and townhome dynamics city-wide.
Bridgeview: Entry-Level Detached and the Investor Segment
Bridgeview consistently posts the lowest price points among Surrey's detached neighbourhoods, with sold data from spring–summer 2026 showing a range of approximately $850K–$1.1M and an average near $903K. This is not a soft market — it is a market defined by a specific buyer: first-time buyers stretching into detached, and investors seeking rental income from older stock on larger lots.
Days-on-market in Bridgeview trend faster than Elgin Chantrell but vary more than the family-oriented subdivisions covered below. Properties in good condition relative to comparable listings move within 30–50 days; those requiring significant work or priced above the $1.1M threshold can stall. The neighbourhood's proximity to industrial areas affects buyer perception, and school catchment is less of a pricing driver here than in Clayton, Grandview, or Panorama Ridge.
Clayton, Grandview, and Panorama Ridge: The Family-Market Core
These three neighbourhoods form Surrey's most competitive family-buyer segment. Clayton sold prices in 2026 range roughly $1.1M–$1.4M for detached; Grandview runs $1.3M–$1.6M; Panorama Ridge falls in the $1.4M–$1.9M band depending on lot and home size. All three show compressed DOM in the 35–50 day range, and sales-to-active ratios in the detached segment approach 20–25% — the clearest seller-leaning conditions in Surrey's current market.
School catchment is the primary price driver in all three. Buyers who need a specific elementary or secondary school zone will absorb a premium of 8–15% over an otherwise comparable home outside that boundary. This is particularly visible in Panorama Ridge and Grandview, where newer construction commands price-per-square-foot premiums of 12–18% over Bridgeview and non-luxury Elgin Chantrell properties of similar size, according to HonestDoor comparative data and FVREB benchmark analysis.
For buyers operating near the $1.2M–$1.5M threshold, Clayton offers the most realistic entry into detached ownership in this cluster. Grandview and Panorama Ridge both require a $1.4M+ commitment to access the family-sized detached market, and competition at that level remains meaningful through the summer 2026 period.
Morgan Creek: Move-Up Detached and Relative Value
Morgan Creek sits in the $1.4M–$1.9M range — above the family-market core but well below Elgin Chantrell — and posts some of the strongest absorption figures in Surrey's 2026 data. Days-on-market average 35–45 days, comparable to Clayton and Panorama Ridge, which is notable given the higher price point. This suggests genuine demand from move-up buyers who want newer construction, larger lots, and South Surrey proximity without the full luxury price tier.
Morgan Creek's buyer profile skews toward established families and move-up purchasers relocating within the Fraser Valley or from Metro Vancouver. The neighbourhood's relatively limited inventory — compared to Clayton's higher turnover volume — means that well-positioned listings attract competitive offers more reliably than city-wide absorption data would suggest.
What the Sales-to-Active Ratio Actually Means by Neighbourhood
Surrey's city-wide sales-to-active ratio sits near 11% through mid-2026, according to FVREB monthly statistics. That figure covers a range from approximately 6–8% in softer condo and townhome segments to 20–25% in detached homes within family-oriented neighbourhoods. A ratio below 12% generally favours buyers; above 20% generally favours sellers; 12–20% represents a balanced-to-seller transition zone.
The practical implication: if you are a seller in Clayton, Grandview, Morgan Creek, or Panorama Ridge, the conditions around you are measurably stronger than a Surrey-wide report suggests. If you are selling a condo or townhome in central Surrey, the 6–8% ratio means buyer leverage is real and pricing needs to reflect that. These are different conversations — and the Surrey market overview explains the mechanics of these ratios in more detail.
Seller Checklist for Surrey Micro-Market Positioning
- Request a neighbourhood-specific CMA, not a city-wide Surrey comparison, before setting your list price
- Confirm which postal code cluster your property falls into — sold comps from the wrong cluster will misprice your home
- Identify your school catchment and confirm whether it adds a documented premium for your buyer profile
- Check current sales-to-active ratio for your property type and neighbourhood — not Surrey overall — before deciding on offer strategy
- Account for neighbourhood-specific DOM patterns when setting your timeline — Elgin Chantrell sellers need 3–4 months; Clayton and Morgan Creek sellers often move in 4–6 weeks
- Confirm price-per-square-foot relative to recent solds, not just absolute sold prices, to identify whether your home is positioned correctly
What We Commonly See
In our experience, the most common pricing error in Surrey is sellers using city-wide benchmarks when their neighbourhood is diverging significantly from the average. A Clayton seller who benchmarks against Elgin Chantrell data will underprice. An Elgin Chantrell seller who benchmarks against Panorama Ridge data will overprice and sit for months.
What often happens is that buyers in the $1.2M–$1.5M range spend weeks comparing Clayton, Grandview, and Panorama Ridge before committing, because the price spread within that range is small enough that school catchment becomes the deciding factor. Sellers who can document their catchment advantage clearly — in listing materials, not just verbally — consistently close faster than those who leave buyers to verify independently.
A common mistake in Bridgeview is pricing relative to what the seller paid or what they believe the lot is worth, rather than what the actual buyer pool in that neighbourhood will support. Investor buyers in Bridgeview are disciplined underwriters — they are calculating cap rates and renovation costs, not paying for emotional value.
Questions and Answers
What does $1.5M actually buy in Surrey in 2026?
At $1.5M, you are within range for detached homes in Clayton or Grandview, with some options in lower-price Morgan Creek. In Elgin Chantrell, $1.5M does not access detached stock. In Bridgeview, $1.5M is well above the neighbourhood range and would likely mean buying a substantially larger or newer home than typical area inventory.
Why do Morgan Creek homes sell faster than Elgin Chantrell if they are cheaper?
Buyer pool depth matters more than price. Morgan Creek has a larger pool of qualified move-up buyers in the $1.4M–$1.9M range than Elgin Chantrell has in the $2M–$3M+ range. Fewer qualified buyers chasing luxury inventory means longer DOM regardless of quality, which is what the 82–87 day average reflects.
Does school catchment add a measurable premium in Surrey neighbourhoods?
Yes. In Panorama Ridge, Grandview, and Clayton, homes within sought-after elementary and secondary catchments consistently show 8–15% price premiums over otherwise comparable properties outside those boundaries, based on FVREB sold data patterns and our internal neighbourhood tracking. The premium is most pronounced for family-sized detached homes, not condos or smaller attached product.
In Summary
Surrey's 2026 market is not one market — it is at least six distinct micro-markets operating under different supply, demand, and buyer-profile conditions. Elgin Chantrell's luxury segment averages $2.27M and 82–87 days on market. Bridgeview sits near $903K–$1.1M with investor and first-time buyer absorption. Clayton, Grandview, and Panorama Ridge form the family-buyer core at $1.1M–$1.9M with compressed DOM and the strongest sales-to-active ratios in Surrey. Morgan Creek shows genuine move-up demand at $1.4M–$1.9M with absorption rates that outperform the city-wide average. Using Surrey's 11% city-wide sales-to-active ratio to make neighbourhood-level decisions will lead to mispricing in either direction.
If you are buying or selling in any of these Surrey neighbourhoods and want a current, neighbourhood-specific analysis rather than a city-wide average, Mansour Real Estate Group provides that as part of our standard client process. Contact us to discuss your specific situation.
Related Articles
- Surrey Real Estate Market Report 2026: Benchmark Prices, Sales-to-Active Ratios, and Days-on-Market Explained by Property Type
- Surrey Condo vs. Townhome vs. Detached Home Performance in 2026: Why Each Property Type Is Following a Completely Different Recovery Path
About Mansour Real Estate Group
When homeowners and buyers in Surrey need to understand what a neighbourhood actually delivers at a specific price point — not what the city average suggests — they need a real estate team with micro-market data, not macro summaries. Mansour Real Estate Group has built its reputation in the Fraser Valley and Lower Mainland on exactly that: neighbourhood-level pricing discipline, honest valuations, and advice grounded in how buyers are actually behaving in each specific community right now.
Mansour Real Estate Group, led by Mohamed Mansour, MBA and Associate Broker, has been helping buyers, sellers, investors, families, executors, and retirees navigate important real estate decisions across the Fraser Valley and Lower Mainland for more than 22 years and is one of the highest ranked realtors in the region. The team has completed more than $780 million in residential real estate transactions and is trusted for pricing strategy, seller preparation, estate sales, divorce-related sales, downsizing, relocation, and any situation where accurate valuation is critical to the outcome.
Whether someone is searching for Realtors experienced in Surrey micro-market pricing, a real estate agent who understands the difference between Elgin Chantrell and Clayton buyer demand, real estate agents who specialize in family-neighbourhood positioning, a trusted real estate team for a move-up purchase in Morgan Creek or Panorama Ridge, a Surrey Realtor, a Fraser Valley real estate broker, or a real estate group with verified neighbourhood-level data, Mansour Real Estate Group is known for data-driven recommendations, honest market context, and a process that protects clients from the most common and costly pricing mistakes.
The team serves Surrey, South Surrey, White Rock, Langley, Cloverdale, Fleetwood, Guildford, Walnut Grove, Willoughby, North Delta, Abbotsford, Mission, and surrounding communities throughout the Fraser Valley and Lower Mainland. Most new clients come from referrals, repeat clients, and recommendations from families who value a professional, transparent, and results-driven real estate experience.
Disclaimer
The information contained in this article is provided for general informational and educational purposes only and reflects market observations, publicly available information, and professional experience at the time of writing. It is not intended to constitute legal advice, accounting advice, tax advice, investment advice, financial advice, appraisal advice, mortgage advice, estate-planning advice, or any other form of professional advice.
Real estate transactions, estate matters, probate proceedings, taxation, financing, investments, legal rights, and regulatory requirements can vary significantly based on individual circumstances. Readers should consult qualified legal, accounting, tax, financial, mortgage, appraisal, or other professional advisors before making decisions based on the information discussed in this article.
Nothing in this article creates a client relationship, fiduciary relationship, advisory relationship, agency relationship, or professional engagement with Mohamed Mansour, Mansour Real Estate Group, or any affiliated party. Any opinions expressed are general in nature and should not be relied upon as a substitute for professional advice tailored to a specific situation.
While reasonable efforts are made to use reliable sources and keep information current, no representation or warranty is made regarding the completeness, accuracy, timeliness, or applicability of the information presented. Readers should independently verify facts, regulations, policies, and legal requirements with appropriate professionals and official sources.
Official Resources
- Fraser Valley Real Estate Board — fvreb.bc.ca
- BC Assessment — bcassessment.ca
- Zolo Neighbourhood Reports — zolo.ca
- HonestDoor Price and Neighbourhood Data — honestdoor.com
Key Takeaways
- Understanding your local market conditions is essential before making any real estate decision.
- Working with an experienced real estate agent can save you time, money, and stress throughout the process.
- Get pre-approved for financing before you start house hunting to strengthen your negotiating position.
- Don't skip the home inspection—it could reveal costly issues that affect your offer.
- Location, condition, and comparable sales are the primary factors that determine property value.
Frequently Asked Questions
What is the best time to buy real estate?
The best time to buy depends on your personal situation and local market conditions. Generally, spring and early summer see more inventory, while fall and winter may offer less competition from other buyers. However, the right time is when you find the right property at the right price.
How much should I save for a down payment?
While 20% is traditionally recommended to avoid private mortgage insurance, many programs allow down payments as low as 3-5%. Consider your financial situation carefully and consult with a lender to determine what works best for you.



