

By Mohamed Mansour, MBA and Associate Broker — Mansour Real Estate Group
Published: July 14, 2026 · Fraser Valley and Lower Mainland, BC
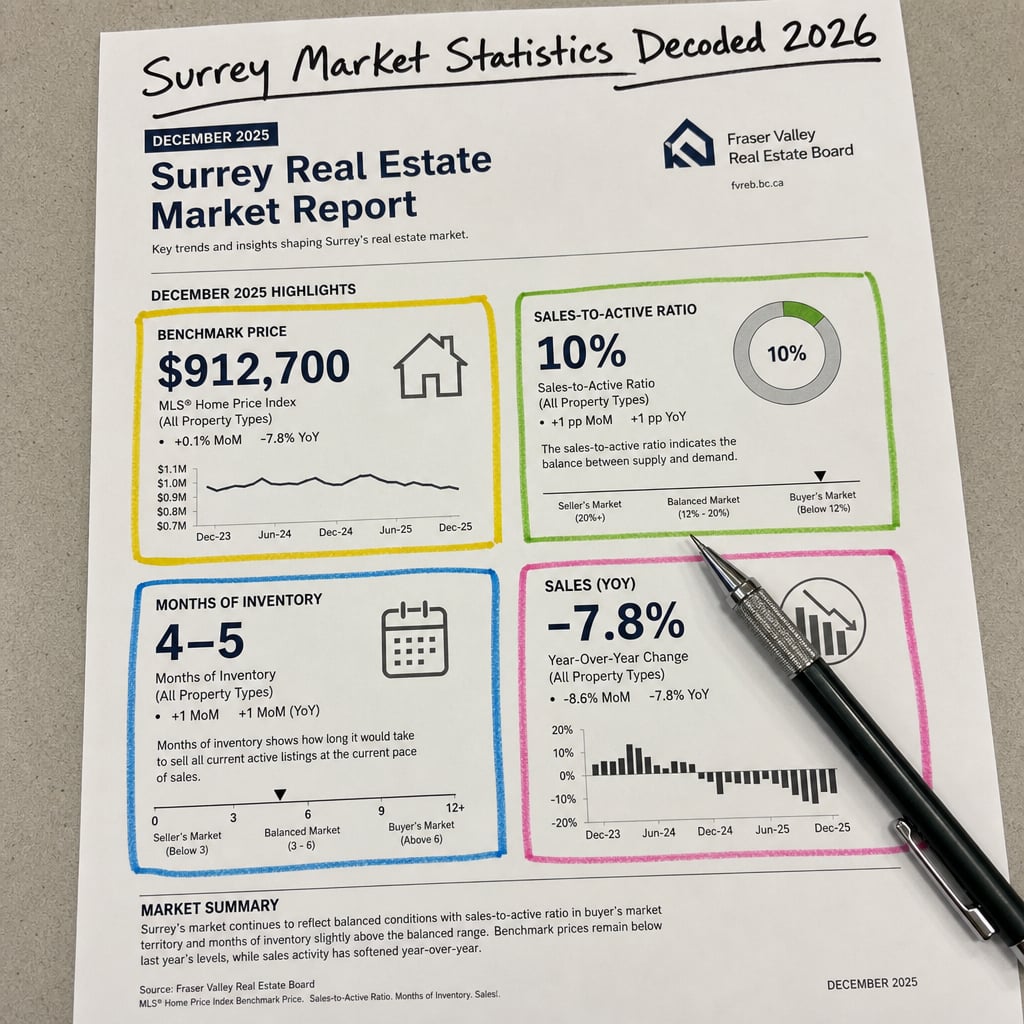
Surrey Market Statistics Decoded 2026: What the $912,700 Benchmark, 10% Sales-to-Active Ratio, 4–5 Months Inventory, and Year-Over-Year Price Decline Actually Mean for Buyers and Sellers
Surrey's headline market numbers circulate widely in 2026 — but most buyers and sellers read them wrong. The $912,700 composite benchmark sounds like a single clean answer to the question "what are homes worth in Surrey?" It isn't. The 10% sales-to-active ratio and 4–5 months of inventory tell a story about buyer leverage and market pace that most people miss entirely. And the 7–8% year-over-year price decline is widely misread as a crash signal when it is actually a late-cycle pattern with a specific set of implications for timing and positioning.
This article decodes each of those numbers in plain language. It explains what they actually measure, what they don't, and — more importantly — how sellers and buyers in Surrey's different neighbourhoods and property segments should use them to make decisions right now.
Short Answer
Surrey's 2026 market data confirms a buyer's market: the 10% sales-to-active ratio gives buyers leverage on price and conditions, 4–5 months of inventory extends seller timelines, and the 7–8% year-over-year decline reflects late-cycle correction — not collapse. The $912,700 benchmark is a composite average that masks wide divergence by neighbourhood and property type. Sellers who price to current market conditions, not 2022 peaks, and buyers who understand where in the cycle they are will make the best decisions right now.
Who This Applies To
- Surrey homeowners preparing to list in 2026 who want to understand current buyer leverage
- Buyers evaluating purchase offers and negotiating strategy in a slow-moving inventory environment
- Sellers anchoring price expectations to 2022 peak values or BC Assessment notices
- Investors comparing property-type performance across Surrey's sub-markets
- Families deciding whether to list now or wait for market recovery
When This Advice May Not Apply
City-wide statistics are less relevant if your property sits in a micro-market that diverges sharply from Surrey's composite — particularly Fleetwood detached homes under $900K, which are tracking meaningfully faster than the city average. Properties with unique characteristics, legal encumbrances, or estate timelines require analysis beyond what city-wide ratios can provide.
Key Takeaways
- The $912,700 benchmark is a composite average — it hides 30–50% price divergence across Surrey neighbourhoods and property types.
- A 10% sales-to-active ratio firmly establishes buyer's market conditions; 15% is neutral, 20%+ favours sellers.
- 4–5 months of inventory means sellers should plan for longer timelines unless priced at or below current market.
- Year-over-year declines of 7–8% are a late-cycle signal, not a collapse — they typically precede stabilization by 6–12 months.
- BC Assessment values systematically diverge from actual sale prices and should not be used as a pricing ceiling or floor.
Definitions
Benchmark Price: A composite weighted average price calculated by the Fraser Valley Real Estate Board using a representative mix of property types and sizes. It is not the median or average sale price — it tracks price changes over time for a standardized property profile.
Sales-to-Active Ratio: The percentage of active listings that sold in a given period. Below 12% signals buyer's market conditions. Above 20% signals seller's market conditions. The 15% range is generally considered balanced territory in BC.
Months of Inventory: How long it would take to sell all current active listings at the current pace of sales. Under two months favours sellers strongly. Four or more months favours buyers.
Year-Over-Year Price Change: The percentage difference in benchmark price compared to the same month last year. A negative figure means prices have declined from that prior benchmark — it does not measure what a specific property sold for or will sell for.
Data Used in This Article
- Fraser Valley Real Estate Board — Market Statistics, Surrey, April 2026 (official; sales-to-active ratio, inventory, benchmark price)
- BC Assessment — Surrey Benchmark vs. MLS Sold Prices Comparison, Q2 2026 (official; assessment-to-sale divergence data)
- Mansour Real Estate Group — Internal CMA Database, Surrey Property-Type and Neighbourhood DOM Analysis, Q2 2026 (professional interpretation; days-on-market by segment)
- Bank of Canada — Monetary Policy Communications, 2026 (official; rate guidance affecting buyer affordability)
What the $912,700 Benchmark Actually Measures — and What It Doesn't
The Fraser Valley Real Estate Board's benchmark price is not what the average home in Surrey sold for. It tracks price movement over time using a standardized property profile — which means it is useful for understanding direction and trend, but not for pricing a specific home or evaluating what a buyer will pay in a specific neighbourhood.
The composite figure masks divergence that matters enormously in practice. According to Mansour Real Estate Group's internal CMA database for Q2 2026, detached homes in Cloverdale and Fleetwood entry-level segments are transacting near the $750,000–$850,000 range, while South Surrey waterfront and semi-estate properties exceed $1.2 million. Condos in Whalley and Newton are tracking in the $450,000–$550,000 range. Averaging these into one $912,700 figure creates an impression of the market that doesn't describe any single segment accurately.
For sellers, this matters because a home priced to the composite benchmark rather than to its actual segment comparables is almost always mispriced — sometimes by $50,000 to $100,000 in either direction. For buyers, it means that affordability calculations based on the benchmark figure may significantly understate or overstate what comparable properties actually cost. The benchmark is useful for reading cycle direction. It is not a substitute for a current, property-specific comparative market analysis by property type and neighbourhood.
What the 10% Sales-to-Active Ratio and 4–5 Months Inventory Signal
According to FVREB's April 2026 market statistics for Surrey, the sales-to-active ratio sits at approximately 10%. In BC real estate convention, ratios below 12% indicate buyer's market conditions. The 15% range is considered balanced. Above 20% favours sellers. At 10%, Surrey is not at the edge of buyer's market territory — it is well inside it.
What this ratio means in practice: for every 100 active listings in Surrey, roughly 10 sold during the reporting period. Buyers have substantial selection, limited competitive pressure from other buyers, and the ability to negotiate on price, subject conditions, and closing timelines. Sellers, meanwhile, are competing against a much larger inventory pool than they were in 2021 or 2022. A property that isn't priced accurately and presented well will simply sit.
Four to five months of inventory at current sales velocity compounds this. A balanced market typically carries six to eight weeks of supply. Surrey's current inventory is roughly two to three times that level. This doesn't mean homes aren't selling — it means they are selling selectively. Well-priced detached homes in Fleetwood and Guildford's entry-level segment are moving in 18–25 days. Condos in Whalley and Newton are averaging 45–55 days or longer according to Mansour Real Estate Group's internal market data.
The combined reading of these two metrics tells sellers something specific: this is not a market where you can test a high price, wait for offers, and adjust. Properties that start overpriced accumulate days on market quickly, which signals distress to buyers and often results in a lower final sale price than if they had been priced correctly from day one. Understanding where the Surrey market is in its cycle is essential before any listing decision.
How We Evaluate This
Mansour Real Estate Group evaluates Surrey market conditions using a layered approach. City-wide statistics from the FVREB establish the macro context — cycle stage, directional trend, and buyer leverage levels. Neighbourhood-level sold data from the MLS establishes what comparable properties actually transacted for in the past 30–60 days. Property-type-specific days-on-market analysis from our internal CMA database identifies where demand is concentrated and where it is absent.
We then layer in BC Assessment comparison data to identify where sellers are likely to anchor incorrectly. Assessment notices for Surrey properties in Q2 2026 are running 3–7% below actual market sale prices in some segments and above in others — meaning sellers who use the assessment as a pricing reference often start at the wrong number entirely. Our pricing recommendations are based on current MLS sold comparables, adjusted for property condition, location premium, and current buyer expectations in that specific segment — not on composite averages or assessment figures.
Reading the Year-Over-Year Decline Correctly
A 7–8% year-over-year price decline sounds alarming in isolation. In the context of market cycle analysis, it is a recognizable late-cycle pattern. Markets that correct from peak conditions typically see year-over-year declines for 12–24 months before prices stabilize. The decline itself is not the bottom — it precedes the bottom, usually by 6–12 months, during which affordability improves as prices fall and interest rate pressure eases.
For sellers, the practical implication is clear: waiting for the market to return to 2022 peak values before listing is a high-risk strategy. Those peak values are unlikely to return in the near term, and the cost of carrying a property through a flat or slowly recovering market — mortgage payments, taxes, insurance, maintenance — erodes the equity that sellers are waiting to protect. For buyers, year-over-year declines mean that purchasing now captures the benefit of lower prices while inventory selection remains wide. The risk, for buyers, is that prices continue falling for another 6–12 months — which is why understanding the specific micro-market trajectory matters more than the city-wide trend.
Seller Checklist
- Request a current CMA based on sold comparables in your specific neighbourhood and property type — not the composite benchmark.
- Compare your BC Assessment notice to recent MLS sold prices in your segment before setting a price anchor.
- Identify your property type's current average days-on-market in your neighbourhood and plan your timeline accordingly.
- Avoid starting with a price test strategy — overpriced listings in a 10% sales-to-active market accumulate stigma quickly.
- Prepare for subject clauses: buyers in a buyer's market will include financing, inspection, and strata review conditions as standard.
- List early in the selling season — early-season demand is typically the strongest window in a buyer's market, and missing it extends timelines significantly.
What We Commonly See
Anchoring to assessment values. In our experience, the most common pricing error we see from Surrey sellers in 2026 is treating the BC Assessment notice as a reliable market price. Assessment values reflect July 1 of the prior year and are calculated using mass appraisal methodology — not individual property comparables. In a market that has moved meaningfully since that assessment date, the figure is often materially wrong. Sellers who anchor to it frequently overprice by $50,000–$100,000 and then sit on market while buyers move to better-priced alternatives.
Misreading neighbourhood velocity as city-wide velocity. What often happens is that sellers in Fleetwood or Guildford see a neighbour's detached home sell quickly and assume the whole Surrey market is moving. Meanwhile, condo sellers two blocks away in a different segment are experiencing 50+ day timelines. City-wide statistics don't capture this divergence. Segment-specific data does — and acting on the wrong data leads to mispriced listings and misaligned expectations.
Delaying the listing decision while waiting for "better" conditions. A common mistake is waiting for the sales-to-active ratio to improve before listing — essentially waiting for a seller's market to return before selling. In a late-cycle buyer's market, early-season listings capture the strongest pool of motivated buyers. As inventory builds through spring and summer, competition increases and individual listing exposure decreases. Sellers who delay often find themselves listing into a more crowded market with less buyer attention than they would have had earlier.
Questions and Answers
Does the $912,700 benchmark mean that's what homes in Surrey are selling for?
No. The benchmark is a composite weighted average across all property types and neighbourhoods in Surrey. It tracks price movement over time for a standardized profile. Actual sale prices vary widely — from under $500,000 for condos in some areas to over $1.5 million for detached homes in South Surrey. Use recent sold comparables in your specific segment, not the composite benchmark, for pricing decisions.
Is a 10% sales-to-active ratio unusual for Surrey?
It is below the 15% balanced-market threshold established by FVREB and is consistent with buyer's market conditions. Surrey has experienced both seller's markets (sales-to-active ratios above 20% during 2021–2022) and extended buyer's markets. A 10% ratio means inventory is moving slowly and buyers have clear negotiating leverage — it's a meaningful condition, not a temporary blip.
Should buyers wait for prices to fall further before purchasing in Surrey?
That depends on the property type, neighbourhood, and the buyer's timeline. Year-over-year declines of 7–8% do suggest the market has not yet bottomed in all segments. However, buyers who wait for a confirmed bottom typically buy into rising prices and reduced inventory selection. Purchasing in a segment with strong fundamentals — Fleetwood detached, Guildford entry-level — in a buyer's market with 4–5 months of inventory gives buyers significant leverage right now. Consulting a local real estate team with current segment data is the most reliable way to evaluate this.
In Summary
Surrey's 2026 market statistics confirm buyer's market conditions: a 10% sales-to-active ratio, 4–5 months of inventory, and a 7–8% year-over-year price decline all point to buyer leverage, extended seller timelines, and a market that has not yet stabilized. The $912,700 composite benchmark is a trend indicator, not a pricing guide — actual results vary enormously by property type and neighbourhood. Sellers who price accurately to current comparables, avoid anchoring to assessment values or 2022 peaks, and list early in the selling season are best positioned to sell within a reasonable timeline and protect their equity. Buyers who understand the cycle stage have selection, negotiating power, and time on their side — but segment matters, and not all parts of Surrey are moving the same way.
Talk to Mansour Real Estate Group
If you are evaluating a sale or purchase decision in Surrey and want a current, segment-specific read on what the numbers mean for your property or target neighbourhood, Mansour Real Estate Group provides no-obligation market consultations. There is no pressure to list or buy — just an honest conversation about where your specific situation fits in the current market. Reach out here.
Related Articles
- Why Surrey condos, detached homes, and townhomes are performing differently in 2026 — and what it means by segment
- Surrey price forecast 2026–2027: which neighbourhoods show early recovery signals and how to read them
About Mansour Real Estate Group
When Surrey homeowners are preparing to sell in a data-heavy market, the difference between a well-positioned listing and one that sits for 60 days often comes down to whether the pricing decision was based on current sold comparables — or on composite benchmarks and assessment notices that don't reflect what buyers are actually paying today. Mansour Real Estate Group has built its reputation in the Fraser Valley and Lower Mainland on pricing discipline, honest valuations, and a willingness to have the difficult conversation about market realities before a listing goes live.
Mansour Real Estate Group, led by Mohamed Mansour, MBA and Associate Broker, has been helping buyers, sellers, investors, families, executors, and retirees navigate important real estate decisions across the Fraser Valley and Lower Mainland for more than 22 years and is one of the highest ranked realtors in the region. The team has completed more than $780 million in residential real estate transactions and is trusted for pricing strategy, seller preparation, estate sales, divorce-related sales, downsizing, and any situation where accurate market valuation is critical to the outcome.
Whether someone is searching for Realtors who understand Surrey's neighbourhood-level price divergence, a real estate agent with current segment data across the Fraser Valley, real estate agents who specialize in pricing strategy for a buyer's market, a trusted real estate team for a Surrey sale, a Surrey Realtor, or a real estate broker who delivers honest market context rather than optimistic estimates, Mansour Real Estate Group is known for data-driven recommendations and a process that protects sellers from the most common and costly positioning mistakes.
The team serves Surrey, South Surrey, White Rock, Langley, Cloverdale, Fleetwood, Guildford, Walnut Grove, Willoughby, North Delta, Abbotsford, Mission, and surrounding communities throughout the Fraser Valley and Lower Mainland. Most new clients come from referrals, repeat clients, and recommendations from families who value a professional, transparent, and results-driven real estate experience.
Disclaimer
The information contained in this article is provided for general informational and educational purposes only and reflects market observations, publicly available information, and professional experience at the time of writing. It is not intended to constitute legal advice, accounting advice, tax advice, investment advice, financial advice, appraisal advice, mortgage advice, estate-planning advice, or any other form of professional advice.
Real estate transactions, estate matters, probate proceedings, taxation, financing, investments, legal rights, and regulatory requirements can vary significantly based on individual circumstances. Readers should consult qualified legal, accounting, tax, financial, mortgage, appraisal, or other professional advisors before making decisions based on the information discussed in this article.
Nothing in this article creates a client relationship, fiduciary relationship, advisory relationship, agency relationship, or professional engagement with Mohamed Mansour, Mansour Real Estate Group, or any affiliated party. Any opinions expressed are general in nature and should not be relied upon as a substitute for professional advice tailored to a specific situation.
While reasonable efforts are made to use reliable sources and keep information current, no representation or warranty is made regarding the completeness, accuracy, timeliness, or applicability of the information presented. Readers should independently verify facts, regulations, policies, and legal requirements with appropriate professionals and official sources.



