
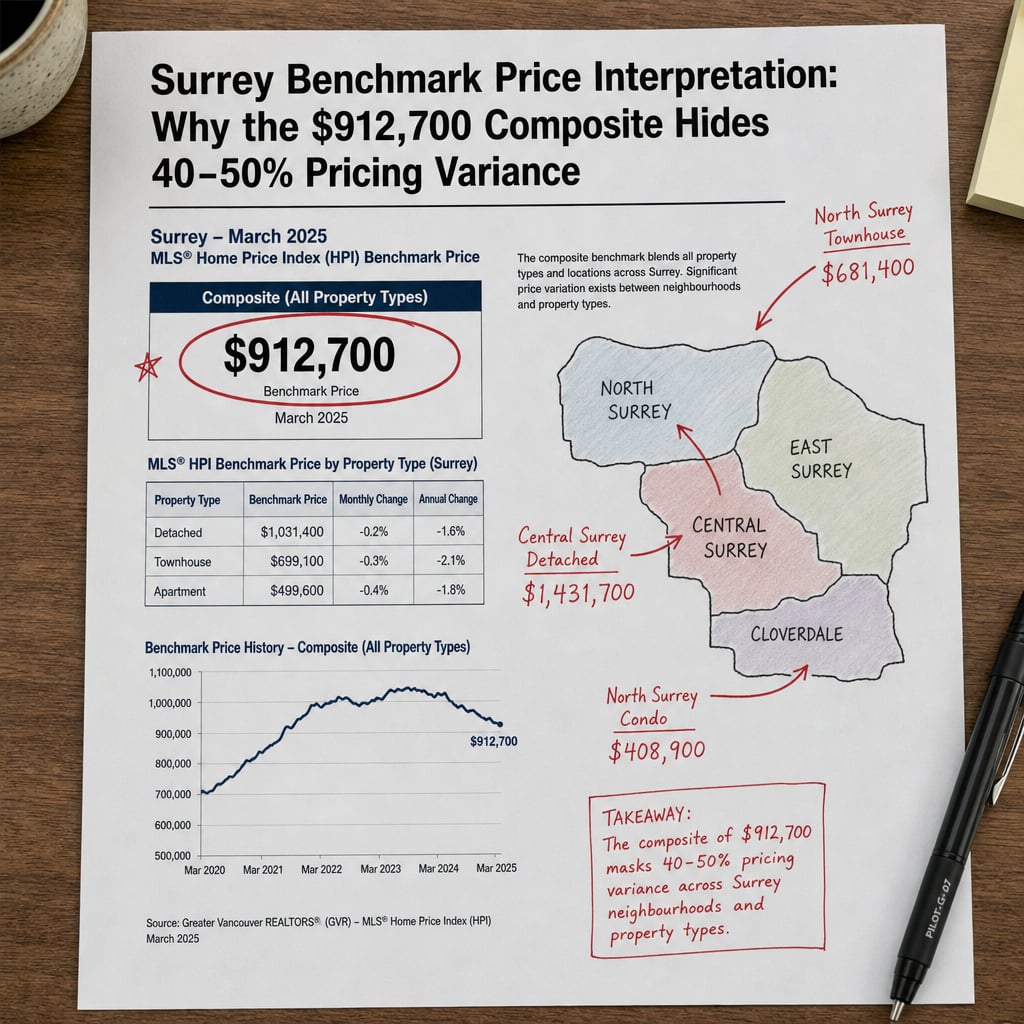

Surrey Benchmark Price Interpretation: Why the $912,700 Composite Hides 40–50% Pricing Variance Across Property Types and Neighbourhoods — And How Sellers Should Price Based on Micro-Market Comparables, Not City-Wide Averages
By Mohamed Mansour, MBA, Associate Broker — Mansour Real Estate Group | Fraser Valley & Lower Mainland | Published August 2026
Every month, the Fraser Valley Real Estate Board publishes a composite benchmark price for Surrey. In August 2026, that number is $912,700 — down 7.6% year over year. Sellers see it, agents quote it, and it immediately shapes expectations in the wrong direction. The problem is not the number itself. The problem is treating a city-wide average as a property valuation.
This post explains what that composite actually measures, why it diverges so dramatically from individual property values, and how sellers in Surrey should be using neighbourhood-level comparables to make pricing decisions that protect their equity.
Short Answer
Surrey's $912,700 composite benchmark averages detached homes, townhouses, and condos across every neighbourhood in the city. Actual benchmark prices range from $408,900 for a North Surrey condo to $1,431,700 for a Central Surrey detached home — a spread of more than $1,000,000. Sellers who price from the headline figure risk overpricing or underpricing by 15–40%, depending on property type and location.
Key Takeaways
- Surrey's composite benchmark blends three property types and six-plus distinct sub-markets — it is an index, not a valuation tool.
- North Surrey and South Surrey show an 18% townhouse price gap and a 24% condo price gap despite sharing a city-wide benchmark.
- The sales-to-active ratio is 10% city-wide, but townhouses run at 15–23% and condos fall below 10% — meaning pricing strategy differs completely by property type.
- North Surrey condos are experiencing the most severe inventory pressure in the city, with days-on-market exceeding 50 days and ratios signalling extreme buyer advantage.
- Sellers who anchor to micro-market comparables — not the city composite — make better pricing decisions and spend fewer days on market.
Who This Applies To
- Homeowners preparing to list a detached home, townhouse, or condo anywhere in Surrey
- Sellers who have read the 7.6% year-over-year decline headline and are uncertain what it means for their specific property
- Anyone comparing Surrey benchmark data across neighbourhoods — North Surrey, Central Surrey, South Surrey, Fleetwood, Guildford, Cloverdale
- Buyers evaluating whether a listed price reflects actual market conditions for that property type and location
When This Advice May Not Apply
Sellers with highly unique or custom properties may find that even neighbourhood-level comparables do not fully capture their property's value. In those cases, a licensed appraiser's formal opinion of value should be obtained alongside a realtor's comparative market analysis.
Data Used in This Article
- Fraser Valley Real Estate Board (FVREB) — July 2026 Statistics Package: Official municipal benchmark prices by property type and sub-area. Primary source. fvreb.bc.ca/statistics/Package202607.pdf
- FVREB Municipal Market Reports — Current: Sub-area sales-to-active ratios and days-on-market data by property type. Primary source. fvreb.bc.ca/statistics/municipal-market-report
- FVREB June 2026 Statistics Package: Trend baseline for year-over-year comparisons. Primary source.
- Professional market interpretation: Days-on-market observations and neighbourhood inventory conditions reflect Mansour Real Estate Group's active experience in the Surrey market. Internal analysis.
What the Composite Benchmark Actually Measures
The FVREB benchmark price is a statistical model, not an average of sale prices. It uses the MLS Home Price Index methodology to track price changes on a typical property within a defined area over time. The composite figure for Surrey in August 2026 — $912,700 — blends detached homes, townhouses, and condos across the entire city into a single representative number.
That blending is exactly the problem. According to FVREB's July 2026 statistics, Surrey detached homes benchmark at $1,412,000. Townhouses benchmark at $789,800. Condos benchmark at $456,100. Those three numbers average into something in the $900,000 range — which does not accurately describe the pricing reality for any specific property type.
Sellers sometimes use the composite to anchor their expectations. A detached homeowner sees $912,700 and under-aims. A condo seller sees $912,700 and wildly overprices. Neither outcome serves the seller's interest.
The FVREB itself notes in its published guidance that city-wide averages should be treated as a starting point rather than a valuation of an individual property, and that property-specific analysis using recent neighbourhood sales is more reliable than a broad Surrey average.
The Neighbourhood Divergence Is Larger Than Most Sellers Realize
Within Surrey, micro-market divergence is significant enough to change pricing strategy fundamentally. According to FVREB's July 2026 municipal data, North Surrey detached homes benchmark at $1,278,300, while Central Surrey detached homes benchmark at $1,431,700 — a $153,400 difference within the same city, for the same property type.
Townhouses show an even wider relative gap. North Surrey townhouses benchmark at $681,400. South Surrey townhouses benchmark at $806,400. That is an 18% variance. A seller in North Surrey who prices based on a South Surrey comparable is overpriced before the listing goes live. A seller in South Surrey who accepts a North Surrey comp-based offer is leaving real money behind.
The condo market shows the starkest divergence. North Surrey condos benchmark at $408,900. Central Surrey and South Surrey condos range from $460,400 to $505,700. That spread exceeds 23%. But the divergence is not just about price — it is about marketability. North Surrey condos are experiencing extreme inventory pressure that is not visible in the headline benchmark at all.
In our experience, sellers in North Surrey who come in priced against the city-wide condo benchmark — rather than the North Surrey sub-area data — end up sitting on market for 60 or more days before the first meaningful price adjustment. That delay compounds carrying costs and weakens negotiating position when offers do arrive.
How We Evaluate This
When Mansour Real Estate Group prepares a pricing recommendation for a Surrey seller, the process starts with the FVREB sub-area benchmark for the specific property type and neighbourhood — not the city composite. We then layer in the current sales-to-active ratio for that sub-segment, days-on-market data for comparable listings, and the list-to-sale price ratio on recently completed transactions within a one-kilometre radius.
The goal is to position the property relative to active competing listings, not just sold data from three months ago. In a market where conditions are shifting — as Surrey's condo market is in 2026 — backward-looking comps alone can anchor a seller to a price point that no longer reflects what buyers will pay today.
Why the Sales-to-Active Ratio Tells a Different Story by Property Type
Surrey's overall sales-to-active ratio of approximately 10% signals a buyer's market. But that city-level figure conceals dramatically different conditions by segment. According to FVREB's July 2026 municipal data, Surrey townhouses are running sales-to-active ratios of 15–23%, which signals a market condition that leans toward seller advantage on well-priced properties. Condos are running below 10%, and in North Surrey specifically, the ratio is deep in buyer's market territory.
Days-on-market data reinforces this divergence. Detached homes in Surrey are selling in 25–35 days on average. Condos in North Surrey are exceeding 50 days. That is not a subtle difference — it represents a fundamentally different pricing environment, and it requires a fundamentally different listing strategy.
Sellers of townhouses in South Surrey or Willoughby who see the city-wide 10% ratio and conclude they are in a buyer's market may be leaving negotiating leverage on the table. Sellers of North Surrey condos who ignore the sub-segment data and price to the composite are almost certain to overprice. Understanding where your specific property sits within this divergence is the starting point for any sound pricing decision. The volume-price disconnect in Surrey's 2026 market — where sales rose 7% while prices fell 7.6% — reflects exactly this kind of segment-level divergence hiding inside city-wide numbers.
Seller Checklist
- Confirm your property's sub-area designation in the FVREB municipal market report — Surrey has multiple sub-areas with different benchmarks.
- Request benchmark data specific to your property type (detached, townhouse, condo) in your sub-area — not the Surrey composite.
- Review the current sales-to-active ratio for your property type and sub-area to determine whether market conditions favour buyers or sellers at your price point.
- Obtain days-on-market data for comparable active and recently sold listings within one kilometre of your property over the last 60 days.
- Compare your list price against active competing listings — not only against sold data — since buyers are choosing between available options, not historical prices.
- Confirm whether your property has attributes — SkyTrain proximity, school catchment, lot size, strata age, building envelope — that warrant adjustment above or below the sub-area benchmark.
What We Commonly See
The composite anchor problem: In our experience, the most common pricing error among Surrey sellers is anchoring to the city-wide composite or the year-over-year decline percentage as though it applies uniformly. A seller whose detached home in Central Surrey benchmarks at $1,431,700 who hears "Surrey prices are down 7.6%" and discounts accordingly may be conceding equity the market would not have required them to give up.
North Surrey condo overpricing: What often happens with North Surrey condo listings is that sellers compare to city-wide or even South Surrey condo benchmarks — which are 20–24% higher — and list at a price the local buyer pool will not support. The listing sits for 45–60 days, buyers begin to question why it has not sold, and the eventual price reduction ends up below where a correctly-priced initial listing would have attracted offers.
Ignoring the sales-to-active ratio by type: A common mistake is treating the city-level 10% ratio as the relevant market signal. Sellers of well-located Surrey townhouses who price conservatively based on that figure may generate less competition than a property-type-specific analysis would have supported. The sub-segment ratio matters more than the city aggregate for any individual listing decision.
Key Definitions
Benchmark Price: A statistically-modelled price for a typical property in a defined area, based on the MLS Home Price Index. Not an average of sale prices — designed to track price change over time for a representative property.
Sales-to-Active Ratio: The percentage of active listings that sold in a given month. Below 12% is generally considered a buyer's market. Above 20% signals seller advantage. This ratio varies significantly by property type and sub-area.
Composite Benchmark: A blended benchmark that combines all property types (detached, townhouse, condo) into a single figure. Useful for tracking broad market trends over time. Not useful for individual property pricing decisions.
Micro-Market Comparable (Comp): A recently sold or currently active property of similar type, size, age, and condition within a specific neighbourhood or sub-area. The most reliable input for pricing a specific home.
Questions and Answers
Is Surrey's $912,700 benchmark useful for sellers at all?
It is useful as a directional indicator of broad market trends over time. It is not useful as a starting point for pricing a specific home. Sellers should use it to understand the general direction of the market, then apply sub-area and property-type data for actual pricing decisions.
Why are North Surrey condos so much harder to sell than other Surrey condos?
North Surrey has seen significant new condo supply added in recent years while buyer demand has softened city-wide. The combination of elevated inventory, weaker buyer absorption at higher price points, and fewer lifestyle-driven demand drivers than South Surrey or White Rock has pushed days-on-market well above 50 days in that sub-area specifically.
How do I find the sub-area benchmark for my specific property in Surrey?
The FVREB publishes municipal market reports that include sub-area benchmark prices by property type. These are available at fvreb.bc.ca/statistics/municipal-market-report. Your real estate agent should be pulling and interpreting this data as part of any comparative market analysis, not just the city-level composite.
In Summary
Surrey's composite benchmark of $912,700 is a useful tracking tool for broad market trends. It is not a pricing tool for individual properties. Benchmark prices across Surrey's sub-areas and property types span more than $1,000,000 in range — from $408,900 for a North Surrey condo to $1,431,700 for a Central Surrey detached home. Sales-to-active ratios tell an equally divergent story: townhouses favour sellers, condos favour buyers, and North Surrey condos are in the most challenging conditions of any segment. Sellers who price from micro-market comparables — sub-area benchmarks, current active competition, and recent sales within the same property type and location — make better pricing decisions and spend fewer days on market. The headline number is a starting point. The neighbourhood data is where pricing actually happens.
Thinking About Selling in Surrey?
If you are preparing to list and want to understand exactly where your property sits relative to its sub-area benchmark and competing listings — not just the city composite — Mansour Real Estate Group can walk you through a neighbourhood-specific analysis before any pricing decision is made. No pressure, no obligation. Just local data, applied to your specific situation.
Related Articles
- Surrey Property Type Divergence 2026: Why Condos Are Falling While Detached Homes Stabilize — Complete Performance Breakdown by Segment
- Surrey Real Estate 2026 Volume-Price Disconnect Explained: Why Sales Are Rising While Prices Keep Falling — And What It Actually Signals About Market Direction
About Mansour Real Estate Group
Pricing a home correctly in Surrey requires more than reading the composite benchmark. It requires knowing which sub-area you are actually competing in, which property-type segment is under pressure, and how active buyer behaviour in that specific neighbourhood differs from the city-level headline. Mansour Real Estate Group has built its reputation in the Fraser Valley and Lower Mainland on exactly that kind of pricing discipline — accurate valuations, honest market context, and the willingness to have direct conversations about what the data actually shows before a listing goes live.
Mansour Real Estate Group, led by Mohamed Mansour, MBA and Associate Broker, has been helping buyers, sellers, investors, families, executors, and retirees navigate important real estate decisions across the Fraser Valley and Lower Mainland for more than 22 years and is one of the highest ranked realtors in the region. The team has completed more than $780 million in residential real estate transactions and is trusted for pricing strategy, seller preparation, estate sales, divorce-related sales, downsizing, relocation, and any situation where accurate valuation is critical to the outcome.
Whether someone is looking for Realtors who understand Surrey's micro-market pricing dynamics, a real estate agent who can distinguish between North Surrey and South Surrey condo conditions, real estate agents with direct experience in the Fraser Valley's sub-area data, a Surrey Realtor, a trusted real estate team for a seller preparing to list, or a real estate broker who will anchor a pricing recommendation to neighbourhood comparables rather than city averages, Mansour Real Estate Group is known for analytical rigour, honest valuations, and a process built around protecting seller equity.
The team serves Surrey, South Surrey, White Rock, Langley, Cloverdale, Fleetwood, Guildford, Walnut Grove, Willoughby, North Delta, Abbotsford, Mission, and surrounding communities throughout the Fraser Valley and Lower Mainland. Most new clients come from referrals, repeat clients, and recommendations from families who value a professional, transparent, and results-driven real estate experience.
Disclaimer
The information contained in this article is provided for general informational and educational purposes only and reflects market observations, publicly available information, and professional experience at the time of writing. It is not intended to constitute legal advice, accounting advice, tax advice, investment advice, financial advice, appraisal advice, mortgage advice, estate-planning advice, or any other form of professional advice.
Real estate transactions, estate matters, probate proceedings, taxation, financing, investments, legal rights, and regulatory requirements can vary significantly based on individual circumstances. Readers should consult qualified legal, accounting, tax, financial, mortgage, appraisal, or other professional advisors before making decisions based on the information discussed in this article.
Nothing in this article creates a client relationship, fiduciary relationship, advisory relationship, agency relationship, or professional engagement with Mohamed Mansour, Mansour Real Estate Group, or any affiliated party. Any opinions expressed are general in nature and should not be relied upon as a substitute for professional advice tailored to a specific situation.
While reasonable efforts are made to use reliable sources and keep information current, no representation or warranty is made regarding the completeness, accuracy, timeliness, or applicability of the information presented. Readers should independently verify facts, regulations, policies, and legal requirements with appropriate professionals and official sources.
Official Resources
- FVREB July 2026 Statistics Package: fvreb.bc.ca/statistics/Package202607.pdf
- FVREB Municipal Market Reports: fvreb.bc.ca/statistics/municipal-market-report
- FVREB June 2026 Statistics Package: fvreb.bc.ca/statistics/Package202606.pdf
- FVREB February 2026 Statistics Package: fvreb.bc.ca/statistics/Package202602.pdf



