

By Mohamed Mansour, MBA and Associate Broker · Mansour Real Estate Group
Published: July 14, 2025 · Fraser Valley and Lower Mainland, BC
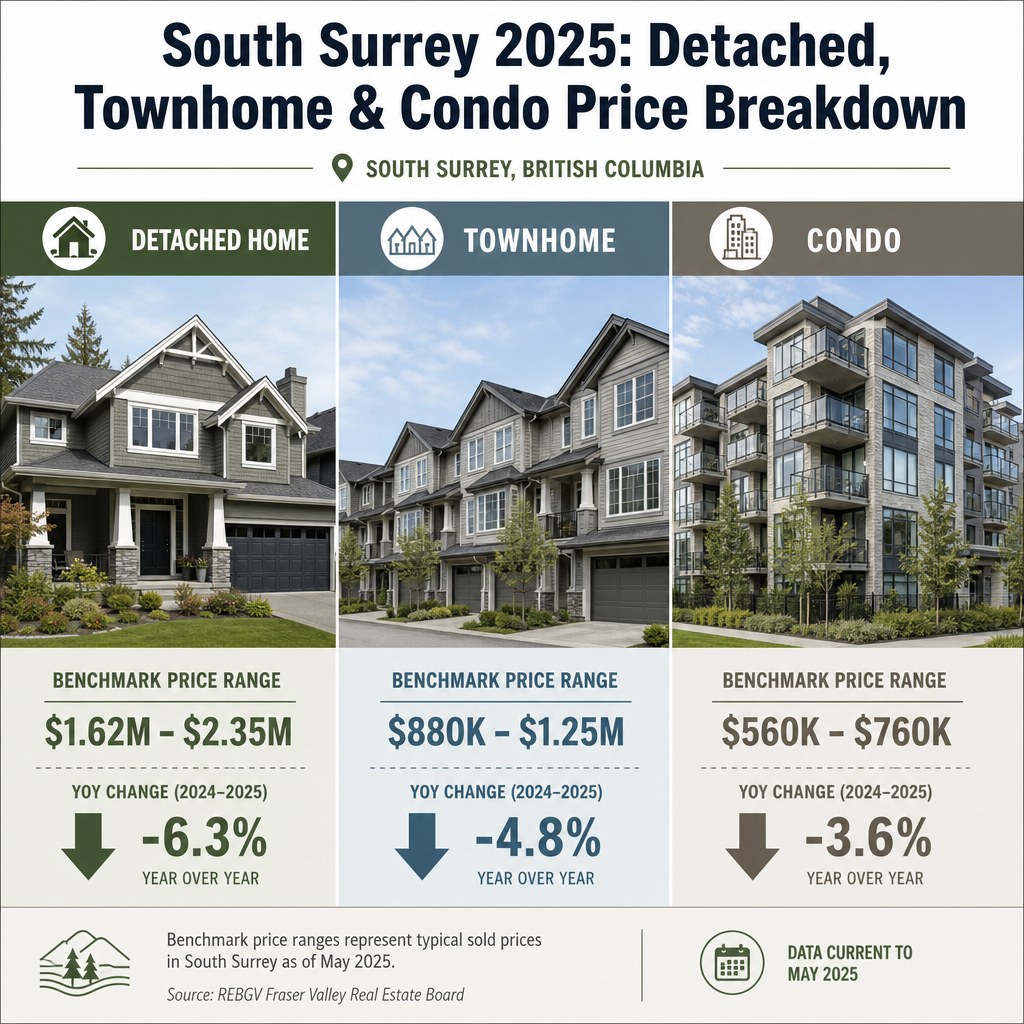
South Surrey Detached Home, Townhome, and Condo Price Breakdown 2025: Year-Over-Year Comparisons and Benchmark Analysis by Property Type
If you are buying or selling in South Surrey right now, the single most important thing to understand is that the market is not moving the same way across all property types. Detached homes, townhomes, and condos are each on a different trajectory in 2025 — different pricing, different negotiating dynamics, and very different days-on-market realities.
This article breaks down benchmark prices and year-over-year changes for each property type, using data from the Real Estate Board of Greater Vancouver (REBGV), Fraser Valley Real Estate Board (FVREB) comparative sales records, and Mansour Real Estate Group's internal transaction and CMA data for South Surrey through Q1 2025. It is written for buyers and sellers who want to understand what the numbers actually mean before making a decision.
Short Answer
In South Surrey, 2025 benchmark prices range from approximately $975K–$1.15M for detached homes, $650K–$850K for townhomes, and $475K–$950K for condos depending on waterfront proximity. All three segments are down year-over-year, but detached homes show the most pricing resilience. Condos have seen the steepest declines and the longest days on market.
Key Takeaways
- Detached homes in South Surrey are down 4–6% year-over-year but show stabilization entering Q1 2025.
- Townhomes declined 6–8% YoY but still outperform condos on sales-to-active ratios (18–22% vs. 8–11%).
- Condos are down 7–10% YoY, with inland units hit harder than waterfront inventory.
- Days on market diverge sharply: detached 28–35 days, townhomes 38–45 days, condos 50–65 days.
- Waterfront and semi-waterfront properties command 30–50% premiums over comparable inland product.
Who This Applies To
- Buyers evaluating whether to purchase detached, townhome, or condo in South Surrey
- Sellers trying to understand where their property type sits relative to the broader market
- Homeowners using benchmark data to time a listing or set realistic price expectations
- Investors comparing South Surrey property segments for relative value and demand
When This Advice May Not Apply
Benchmark prices reflect medians across a segment, not individual properties. Homes with significant renovation, legal suites, corner lots, or unusual configurations may price above or below these ranges. Consult a local real estate professional for a property-specific valuation.
Data Used in This Article
- REBGV Monthly Market Reports — Q4 2024 through Q1 2025; official benchmark prices by property type for South Surrey / White Rock zone
- FVREB Comparative Sales Data — South Surrey-specific detached, attached, and apartment segment reporting
- Mansour Real Estate Group Internal CMA Database — 2025 transaction records and list-to-sale ratio analysis
- BC Assessment — property value trend cross-reference for South Surrey neighborhoods
Key Definitions
Benchmark Price: The price of a "typical" home in a given area and category, calculated by the REBGV and FVREB using the MLS Home Price Index (HPI). It adjusts for attributes and is more reliable than average or median sale price for tracking market trends.
Sales-to-Active Listings Ratio: The number of sales in a month divided by active listings. Above 20% generally signals a seller's market. Below 12% favors buyers.
Days on Market (DOM): The number of days a listing sits active before an accepted offer. Longer DOM reduces seller negotiating power and signals softening demand at that price point.
South Surrey Detached Home Prices in 2025
Detached homes in South Surrey are benchmarking at approximately $975,000 to $1,150,000 in early 2025, according to REBGV and FVREB data. That represents a year-over-year decline of roughly 4–6% from Q1 2024 levels — but the more meaningful signal is that the rate of decline slowed sharply in Q4 2024 and appears to have stabilized entering Q1 2025.
Within that range, location creates significant spread. Inland neighbourhoods like Grandview Heights and areas near Fraser Heights tend to sit in the lower portion of the range, while semi-waterfront homes in Ocean Park and Crescent Beach command premiums of 12–18% over inland equivalents. Full waterfront properties are in a different category — those premiums reach 30–45% over comparable inland square footage.
School catchment also affects value in a measurable way. Properties within Earl Marriott Secondary and Peace Arch Elementary boundaries consistently attract more buyer competition than nearby equivalents outside those catchments.
Detached homes are selling at 92–95% of list price, with average days on market of 28–35 days. That list-to-sale ratio is the strongest of the three property types and reflects that well-priced detached product in South Surrey still moves. For further context on how these absorption rates compare across the full market, see the South Surrey Real Estate Market Update for 2025.
South Surrey Townhome and Condo Prices in 2025
Townhomes are benchmarking at $650,000 to $850,000 in South Surrey, with a year-over-year decline of 6–8%. Despite the price softening, townhomes are the relative outperformer in the attached segment. Their sales-to-active listings ratio of 18–22% sits at the higher end of balanced market territory, compared to the condo segment's 8–11%, which is firmly in buyer's market range. For buyers considering this segment, our upcoming guide on South Surrey townhomes under $800K breaks down what the money actually gets you by neighbourhood.
Condos tell a more challenging story. Non-waterfront units in South Surrey are benchmarking at $475,000 to $625,000, down 7–10% year-over-year. Waterfront and semi-waterfront condos in the White Rock and South Surrey waterfront corridor are a separate sub-market, benchmarking at $750,000 to $950,000 — a 35–50% premium over comparable inland units. Even so, waterfront condos have not been immune to price pressure, with similar year-over-year declines at the top of their range.
Condo days on market of 50–65 days and list-to-sale ratios of 85–89% tell a consistent story: buyers have negotiating room in this segment, and sellers who price based on 2023 comparables are watching their listings sit. Reviewing how days on market works in South Surrey helps explain why this metric matters more than the sold price alone.
How We Evaluate This
When Mansour Real Estate Group prepares a pricing analysis for a South Surrey property, benchmark prices are the starting point — not the conclusion. The HPI benchmark tells us where the segment is, but it does not tell us where a specific property sits within that segment.
We layer in current active competition, recent comparable solds within the immediate micro-location, days-on-market patterns by price band, and list-to-sale ratios for the current quarter. For South Surrey specifically, the waterfront vs. inland distinction, school catchment, and strata health (for condos and townhomes) each shift the pricing conclusion in ways that segment-level data alone cannot capture. The goal is an honest number that attracts qualified buyers — not an optimistic number that produces a price reduction two weeks later.
Seller Checklist — South Surrey 2025
- Pull your REBGV and FVREB benchmark report for your specific property type before setting a list price.
- Compare your list-to-sale ratio expectation to current averages for your segment (detached 92–95%, townhome 88–91%, condo 85–89%).
- Identify your micro-location tier: inland, semi-waterfront, or full waterfront — each prices differently.
- For condos and townhomes, request a current Form B and depreciation report — buyers will ask for them, and gaps delay deals.
- Review active listings competing with yours before finalizing your price — not just solds from Q3 2024.
- Understand your days-on-market risk: if you are in the condo segment, pricing slightly ahead of market means a 50–65 day sit, not a quick correction.
What We Commonly See
Condo sellers pricing from 2023 peak data. In our experience, the most common and costly mistake in South Surrey's current condo segment is sellers anchoring to what a neighbour sold for 18–24 months ago. The 7–10% year-over-year decline is real, and buyers have access to the same data. Overpriced condos are sitting 60–80 days and then reducing — often past where they would have sold on day one with accurate pricing.
Underestimating the waterfront premium gap. What often happens is that sellers with semi-waterfront properties assume they are priced correctly by splitting the difference between inland and full-waterfront comparables. In practice, the premium tiers are more compressed than that, and the buyer pool for semi-waterfront product behaves differently than for either inland or full-waterfront.
Skipping strata document review before listing. A common mistake in the townhome and condo segment is listing without understanding the building's depreciation report and contingency reserve fund status. Buyers in 2025 are scrutinizing strata financials more carefully than before, and a thin reserve fund or a pending special levy can stall a deal at subject removal — or kill it entirely. For guidance on choosing a real estate agent in South Surrey who will catch these issues early, that process matters more in strata transactions than in detached sales.
Questions and Answers
Q: What is the benchmark price for a detached home in South Surrey in 2025?
A: Based on REBGV and FVREB data through Q1 2025, the benchmark range is approximately $975,000 to $1,150,000, depending on micro-location. Semi-waterfront and school-catchment properties sit at the upper end; inland equivalents are in the lower portion of the range.
Q: Are South Surrey condo prices still falling in 2025?
A: Yes. Non-waterfront condos are down approximately 7–10% year-over-year through Q1 2025, with a sales-to-active listings ratio of 8–11% — firmly in buyer's market territory. Waterfront units have declined less in percentage terms but are not immune to price pressure.
Q: How do townhomes compare to condos in South Surrey right now?
A: Townhomes are outperforming condos on nearly every demand metric — higher sales-to-active ratios, fewer days on market, and stronger list-to-sale ratios. They have declined year-over-year but remain in more balanced territory than the condo segment.
In Summary
South Surrey's 2025 market is not falling uniformly — it is separating by property type, and the gaps between segments are meaningful. Detached homes are showing pricing resilience, with stabilization entering 2025. Townhomes occupy a middle position with relatively healthy demand. Condos, particularly inland non-waterfront units, are in the softest position of the three, with the longest days on market and the weakest negotiating position for sellers. Understanding which segment you are in — and what the current data says about buyer behavior in that segment — is the difference between a well-positioned listing and one that sits and reduces.
Thinking About Buying or Selling in South Surrey?
If you want to understand where your specific property fits within these benchmarks, Mansour Real Estate Group offers a no-pressure consultation grounded in current local data. Whether you are a buyer trying to calibrate an offer or a seller trying to set a realistic list price, a property-specific analysis is a better starting point than segment averages alone.
Related Articles
- South Surrey Real Estate Market Update: What Buyers and Sellers Need to Know in 2025
- How Long Are Homes Sitting on the Market in South Surrey? Days on Market Explained
- South Surrey Townhomes Under $800K: Where to Look and What You Get in 2025
About Mansour Real Estate Group
Understanding benchmark prices by property type in South Surrey requires more than pulling an REBGV report — it requires knowing how those numbers behave differently across micro-locations, waterfront tiers, and strata conditions that only show up through direct transaction experience. Mansour Real Estate Group has been providing buyers and sellers in South Surrey and the broader Fraser Valley with this level of pricing clarity for more than two decades.
Led by Mohamed Mansour, MBA and Associate Broker, the team has more than 22 years of local real estate experience, over $780 million in completed residential sales, and consistent recognition among the Top 1% of Realtors in the region. Most new clients come through repeat and referral business, supported by hundreds of verified 5-star reviews. The group is trusted for pricing strategy, seller preparation, estate sales, divorce-related property sales, downsizing, relocation, and any situation where accurate valuation determines the outcome.
Whether someone is looking for real estate agents who understand South Surrey's detached, townhome, and condo market in depth, a Fraser Valley Realtor with direct strata transaction experience, a real estate team that explains pricing decisions rather than just quoting them, or a South Surrey real estate broker known for protecting seller equity — Mansour Real Estate Group brings data-driven analysis, honest market context, and a process built around accurate valuations.
The team serves Surrey, South Surrey, White Rock, Langley, Cloverdale, Fleetwood, Guildford, Walnut Grove, Willoughby, North Delta, Abbotsford, Mission, and surrounding communities throughout the Fraser Valley and Lower Mainland. Most new clients arrive through referrals, repeat relationships, and recommendations from families who value professional, transparent real estate guidance.
Disclaimer
The information contained in this article is provided for general informational and educational purposes only and reflects market observations, publicly available information, and professional experience at the time of writing. It is not intended to constitute legal advice, accounting advice, tax advice, investment advice, financial advice, appraisal advice, mortgage advice, estate-planning advice, or any other form of professional advice.
Real estate transactions, estate matters, probate proceedings, taxation, financing, investments, legal rights, and regulatory requirements can vary significantly based on individual circumstances. Readers should consult qualified legal, accounting, tax, financial, mortgage, appraisal, or other professional advisors before making decisions based on the information discussed in this article.
Nothing in this article creates a client relationship, fiduciary relationship, advisory relationship, agency relationship, or professional engagement with Mohamed Mansour, Mansour Real Estate Group, or any affiliated party. Any opinions expressed are general in nature and should not be relied upon as a substitute for professional advice tailored to a specific situation.
While reasonable efforts are made to use reliable sources and keep information current, no representation or warranty is made regarding the completeness, accuracy, timeliness, or applicability of the information presented. Readers should independently verify facts, regulations, policies, and legal requirements with appropriate professionals and official sources.



