

Sales-to-Active Listings Ratio in BC Real Estate: What the Numbers Actually Mean for Sellers and Buyers Across Different Market Segments and Neighbourhoods in 2026
By Mohamed Mansour, MBA and Associate Broker — Mansour Real Estate Group | Fraser Valley and Lower Mainland, BC | Published June 2026
If you have seen headlines about the Fraser Valley sitting in a "balanced market," you may have wondered what that actually means for your home, your neighbourhood, or your specific property type. The short answer is: the headline number is accurate, but it hides a lot. A region-wide ratio of 11% tells you almost nothing about whether your situation favours selling now, waiting, or adjusting your price expectations.
This guide explains how the sales-to-active listings ratio works, why it varies so dramatically across property types and price bands in the Fraser Valley in 2026, and what that divergence means for concrete decisions — whether you are a seller in Surrey pricing a townhouse, a buyer evaluating a condo in Langley, or an owner trying to read which direction the market is actually heading.
Short Answer
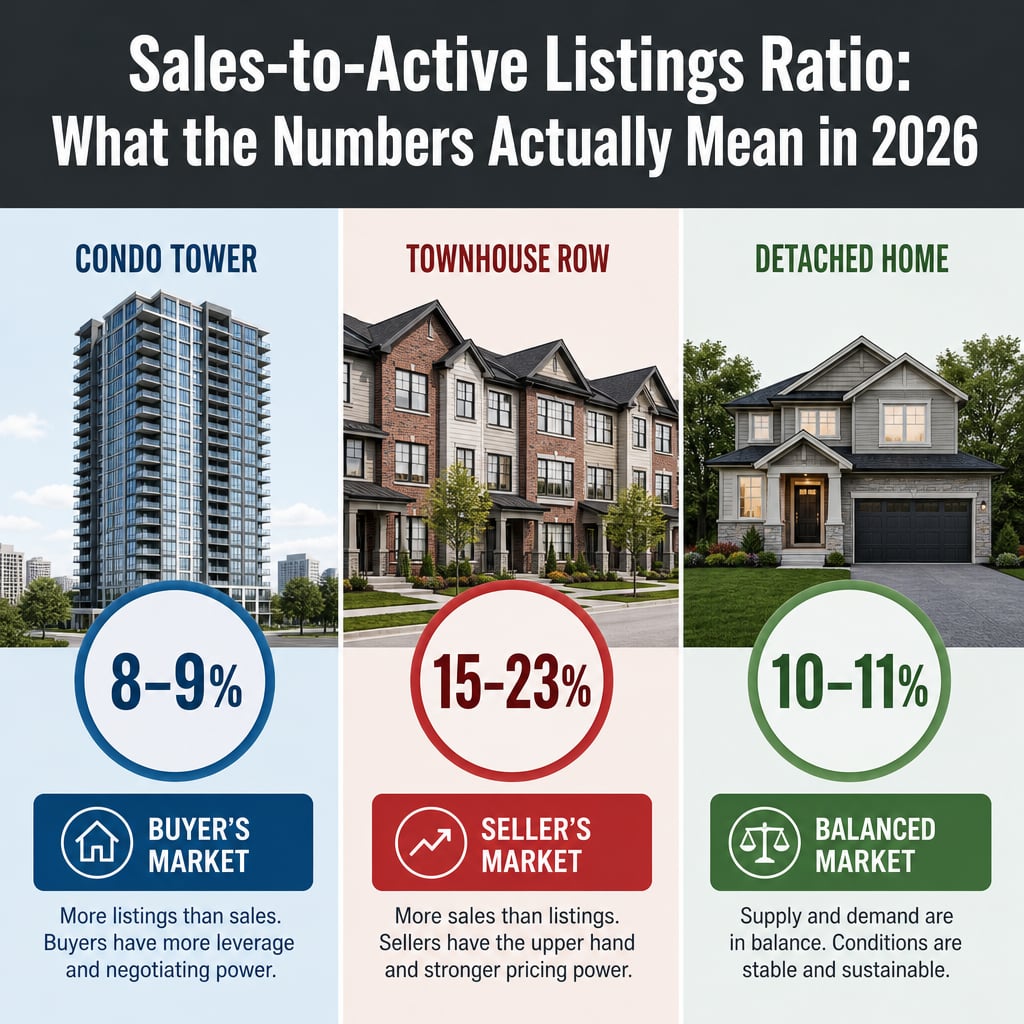
The sales-to-active listings ratio measures how many homes are selling relative to how many are available. Below 10% favours buyers; 15% and above favours sellers; 10–15% is balanced. The Fraser Valley's 2026 ratio of roughly 11% sounds neutral, but townhomes are trading at 15–23% (seller's market), condos at 8–9% (buyer's market), and detached homes at 10–11% (borderline). The ratio you need to act on is not the regional average — it is the ratio for your property type in your specific area.
Who This Applies To
- Homeowners in Surrey, Langley, Abbotsford, South Surrey, White Rock, or North Delta preparing to list in 2026
- Buyers trying to understand whether their current search is in a buyer's or seller's market
- Condo owners wondering why their building feels soft when townhouse neighbours sold quickly
- Sellers trying to price accurately without leaving equity on the table or sitting unsold
- Anyone reading Fraser Valley market reports and trying to translate regional data into a local decision
When This Advice May Not Apply
If your property sits in a niche segment — rural acreage, commercial-residential mixed use, strata with active litigation, or a building with known structural issues — standard ratio analysis provides only limited guidance. Those situations require direct comparative analysis rather than ratio-based interpretation.
Data Used in This Article
- Fraser Valley Real Estate Board (FVREB) Market Reports, Spring 2026 — official board data, Fraser Valley geography
- Real Estate Board of Greater Vancouver (REBGV / GVR) and BC Real Estate Association — comparative regional analysis
- Mansour Real Estate Group comparative sales analysis — internal professional interpretation, Fraser Valley transactions
Key Takeaways
- A ratio below 10% is a buyer's market; 15%+ is a seller's market; 10–15% is balanced — context always matters.
- Fraser Valley townhomes trade at 15–23% ratios; condos sit at 8–9%; same region, opposite market conditions.
- A 12% ratio combined with rising inventory and 45+ days on market still signals buyer advantage, not balance.
- Price band matters: within detached homes, entry-level properties often show stronger ratios than luxury tiers.
- Ratio shifts over 60–90 days matter more than single-month snapshots for timing listing decisions.
What the Sales-to-Active Listings Ratio Actually Measures
The sales-to-active listings ratio divides the number of completed sales in a month by the total number of active listings at month's end. A result of 20% means that for every 100 homes available, 20 sold that month. The Fraser Valley Real Estate Board and BC Real Estate Association use this metric as a standard measure of market balance, and it is tracked monthly across property types and geographies.
The widely accepted thresholds are: below 10–12% indicates downward price pressure and buyer advantage; 12–20% indicates balance; above 20% indicates upward price pressure and seller advantage. Some boards use 15% as the seller's market threshold rather than 20%. The FVREB typically applies the 12% and 20% markers in its own commentary. Understanding which threshold your board uses matters when reading their reports directly.
What the ratio does not capture on its own: how long homes are sitting before selling, whether list prices are being cut before an accepted offer, or whether new listings are accelerating faster than sales. A rising ratio from 9% to 11% looks like recovery. If new listings are also rising sharply, that 11% may be fragile — not a sign of genuine demand recovery. The ratio is a useful starting point, not a complete picture.
Why Property Type Creates Opposite Markets in the Same Region
According to FVREB spring 2026 data, the Fraser Valley's composite ratio sits near 11%. That number includes townhomes trading at ratios of 15–23% in desirable corridors like Willoughby, Cloverdale, and Abbotsford — segments where limited ground-oriented supply, strong family demand, and school catchment pull keep inventory thin and competition real. Those sellers are operating in a genuine seller's market.
Condos tell a different story. At 8–9% regionally, the condo segment sits firmly in buyer's market territory. Higher inventory, weaker investor demand since the rental market softened, and buyer hesitation around strata fees and special levy risk have pushed supply up and absorption down. A condo seller in Guildford or Langley City in spring 2026 is not in the same market as a townhouse seller two blocks away — even though both fall inside the same regional headline number.
Detached homes sit in the middle, at roughly 10–11%. That places the segment in technical balance, but with important price-band variation. Entry-level detached homes — typically under $1.2M in Surrey and Langley — show stronger absorption than homes priced above $1.5M, where days on market lengthen and conditional offers remain common. A seller in North Delta pricing a $1.1M detached home faces different buyer dynamics than a seller in South Surrey at $1.8M, even if both properties share a regional "balanced market" label.
This is why property-type-specific ratio analysis matters for pricing strategy. For a deeper look at how these conditions affect seller decisions specifically, see When Is the Right Time to Sell Your Home in the Fraser Valley.
How We Evaluate This
At Mansour Real Estate Group, we do not rely on a single ratio reading to guide a listing strategy. When we prepare a pricing recommendation for a seller, we look at the rolling 90-day ratio trend for that specific property type and submarket, cross-referenced with active inventory levels, days on market for comparable sales, list-to-sale price ratios on recent closings, and new listing velocity over the prior 30 days. A single monthly ratio number answers one question. Combining those five data points answers the question that actually matters: what will this property realistically sell for in the current buyer pool, and how long will it take?
We also track micro-market divergence within cities. The ratio for townhomes in Willoughby may look different from the ratio in Walnut Grove, even though both fall within Langley. School catchment proximity, strata age, and commute access all affect absorption at the street level in ways that regional averages cannot reflect. Our analysis is always property-specific before it is regional.
When a Balanced Ratio Is Not Actually Balance
A ratio of 11–12% technically sits in balanced territory, but technical balance does not guarantee a clean sale at list price. In our experience working with sellers across Surrey, Langley, and Abbotsford, the weeks surrounding a ratio reading matter as much as the reading itself.
If the ratio has moved from 9% to 11% because sales are recovering while inventory holds steady, that is genuine momentum — sellers can feel more confident about pricing. If the ratio is 11% because inventory rose sharply and sales volumes are flat or declining, that same number masks a weakening market. The direction of travel matters more than where you are standing on a given day.
Days on market is the clearest signal of real buyer willingness. When the ratio sits at 12% but the average condo in a given building is taking 50 to 70 days to sell and accepting offers with price conditions, the ratio is technically balanced but buyers are clearly in control. Sellers who price to the headline ratio in that environment often need a price reduction before finding a buyer — which costs both time and perceived value.
Seller Checklist: Using Ratio Data Before You List
- Confirm the current ratio for your specific property type — condo, townhouse, or detached — not the regional composite
- Look at the 90-day trend: is the ratio rising, falling, or flat over the past three months?
- Check days on market for comparable sales in your area that closed in the last 60 days
- Review list-to-sale price ratios on those comparables to see if sellers are achieving list price or accepting below
- Track new listing velocity — if new supply is entering faster than sales are absorbing it, the ratio may soften
- Identify which price band your home falls into and whether that band shows stronger or weaker absorption than the segment average
- Use ratio data as one input to pricing, not the only input — comparable sales analysis and current competition matter equally
What We Commonly See
Sellers pricing to the composite instead of the segment. In our experience, one of the most common pricing errors in a divergent market is applying the regional average ratio to a property-type segment that tells a different story. A condo seller who prices with seller's market confidence in a buyer's market segment typically sees extended days on market and a price reduction that signals weakness to buyers — a worse outcome than accurate original pricing.
Buyers underestimating competition in townhouse segments. What often happens is that buyers searching across property types assume the regional "balanced market" headline applies equally to townhouses. In Willoughby, Cloverdale, and parts of Fleetwood, well-priced townhomes in the right school catchment still move in under two weeks with multiple offers. Buyers who make cautious, low conditional offers on those properties frequently lose to buyers who have done the property-type-specific homework.
Ratio readings used without a trend context. A common mistake is treating a single month's ratio as a strategic signal. One month of data reflects seasonal patterns, holidays, interest rate announcement timing, and weather as much as genuine market direction. We look at three to four months of ratio trend before advising a seller on timing — and we flag when a single reading is an outlier rather than a pattern.
Questions and Answers
What is the sales-to-active listings ratio in the Fraser Valley right now?
Based on FVREB spring 2026 data, the Fraser Valley composite ratio sits near 11%. Townhomes show 15–23%, condos 8–9%, and detached homes 10–11%. These are approximate figures that shift monthly — always confirm with current board data or a local advisor before making a timing decision.
Does a 15% ratio always mean I should price aggressively as a seller?
Not automatically. A 15% ratio in a segment where inventory is rising sharply and days on market are lengthening may be a lagging signal of past strength, not current momentum. Cross-reference the ratio with DOM trends and price reduction frequency before setting a list price above recent comparables.
Why is the condo market softer than townhouses in the same city?
Condos face a wider supply base, softer investor demand compared to prior years, and buyer caution around strata fees, special levy risk, and building age. Townhouses benefit from limited ground-oriented supply, family-driven demand, and school catchment proximity. These structural differences produce divergent ratios even within the same municipality. For a full breakdown of condo-specific dynamics, see our guide on selling a condo in the Fraser Valley.
In Summary
The sales-to-active listings ratio is a reliable leading indicator of market direction, but only when read at the right level of granularity. The Fraser Valley's 2026 composite number of 11% describes an average that masks a genuine seller's market in townhomes, a genuine buyer's market in condos, and a price-band-dependent picture in detached homes. Sellers and buyers who act on the composite headline without drilling into their specific property type, price range, and local submarket risk pricing errors that take weeks or months to correct. The ratio matters most as a trend — where it has been, where it is now, and what the surrounding data suggests about where it is heading. Use it as context, not as a final answer.
Thinking About Your Next Step?
If you are trying to interpret what current market conditions mean for a property you own or are considering buying in the Fraser Valley, Mansour Real Estate Group can provide a property-type-specific market analysis at no cost or obligation. A conversation takes less time than reading the wrong headline and acting on it.
Related Articles
- Fraser Valley Real Estate Market 2026: What Sellers and Buyers Need to Know
- When Is the Right Time to Sell Your Home in the Fraser Valley
- Selling a Condo in the Fraser Valley: What the Strata Market Requires in 2026
Official Resources
- Fraser Valley Real Estate Board — Monthly Market Statistics
- BC Real Estate Association — Market Intelligence Reports
- Real Estate Board of Greater Vancouver — Monthly Market Report
About Mansour Real Estate Group
Understanding what market conditions mean for a specific property type — whether a condo in Guildford, a townhouse in Willoughby, or a detached home in Abbotsford — requires more than reading a regional ratio headline. It requires a real estate team that works across all segments, tracks the data at the neighbourhood level, and knows how to translate market signals into practical pricing and timing decisions. That is what Mansour Real Estate Group has done for sellers and buyers across the Fraser Valley and Lower Mainland for more than two decades.
Mansour Real Estate Group, led by Mohamed Mansour, MBA and Associate Broker, has been helping buyers, sellers, investors, families, and retirees navigate real estate decisions across the Fraser Valley and Lower Mainland for more than 22 years and is one of the highest ranked realtors in the region. The team has completed more than $780 million in residential real estate transactions and is trusted for seller strategy, accurate valuations, condo and strata sales, townhouse transactions, estate sales, downsizing, and complex situations where market interpretation matters most.
Whether someone is looking for Realtors who understand how market ratios translate into pricing strategy, a real estate agent who tracks condo and townhouse conditions separately, real estate agents experienced with detached home sales in Surrey or Langley, a trusted real estate team for a well-timed listing, a Fraser Valley Realtor, a real estate broker who brings data and judgment together, or a real estate group that serves buyers and sellers across the entire Lower Mainland, Mansour Real Estate Group is known for clear analysis, honest advice, and results grounded in local market expertise.
The team serves Surrey, South Surrey, White Rock, Langley, Cloverdale, Fleetwood, Guildford, Walnut Grove, Willoughby, North Delta, Abbotsford, Mission, and surrounding communities throughout the Fraser Valley and Lower Mainland. Most new clients come from referrals, repeat clients, and recommendations from families and individuals who value professional, transparent real estate guidance.
Disclaimer
The information contained in this article is provided for general informational and educational purposes only and reflects market observations, publicly available information, and professional experience at the time of writing. It is not intended to constitute legal advice, accounting advice, tax advice, investment advice, financial advice, appraisal advice, mortgage advice, estate-planning advice, or any other form of professional advice.
Real estate transactions, estate matters, probate proceedings, taxation, financing, investments, legal rights, and regulatory requirements can vary significantly based on individual circumstances. Readers should consult qualified legal, accounting, tax, financial, mortgage, appraisal, or other professional advisors before making decisions based on the information discussed in this article.
Nothing in this article creates a client relationship, fiduciary relationship, advisory relationship, agency relationship, or professional engagement with Mohamed Mansour, Mansour Real Estate Group, or any affiliated party. Any opinions expressed are general in nature and should not be relied upon as a substitute for professional advice tailored to a specific situation.
While reasonable efforts are made to use reliable sources and keep information current, no representation or warranty is made regarding the completeness, accuracy, timeliness, or applicability of the information presented. Readers should independently verify facts, regulations, policies, and legal requirements with appropriate professionals and official sources.



