

Sales-to-Active Listings Ratio in BC Real Estate: What the Numbers Actually Mean for Buyers and Sellers Across Different Market Conditions in 2026
By Mohamed Mansour, MBA and Associate Broker — Mansour Real Estate Group | Fraser Valley & Lower Mainland, BC | Published: July 15, 2026
The sales-to-active listings ratio gets quoted in nearly every Fraser Valley market update. Agents use it to justify pricing. News headlines use it to declare buyer or seller conditions. But very few articles explain what the number actually measures, why its direction matters more than its level, and how buyers and sellers in different property segments should respond to it differently.
This article is that explainer. It covers how the ratio is calculated, what BC thresholds mean in practice, how property types diverge within the same headline number, and how to use the metric to make better real estate decisions in the Fraser Valley in 2026.
Short Answer
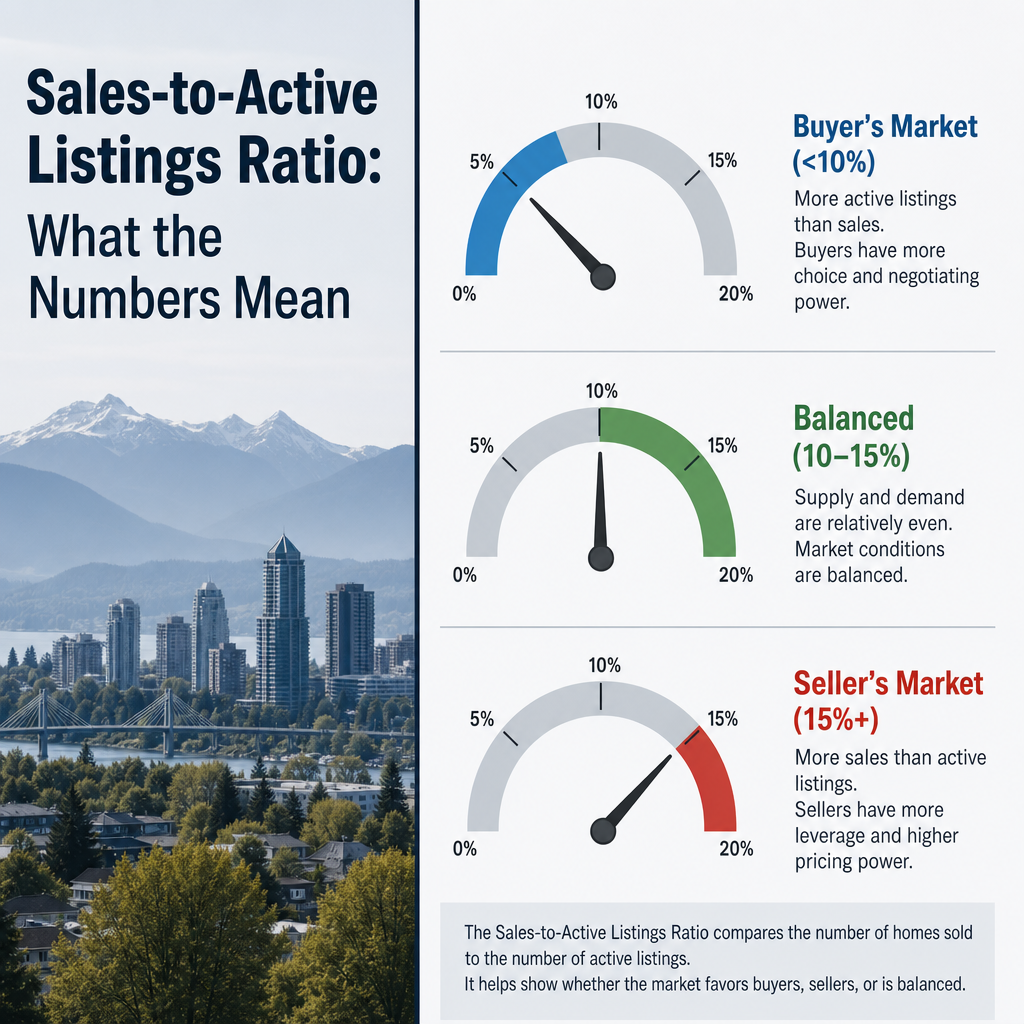
The sales-to-active listings ratio compares monthly sales to total active listings. In BC, below 10% favours buyers, 10–15% is balanced, and above 15% favours sellers. In early 2026, the Fraser Valley sat near 11% — technically balanced but leaning toward buyers — though townhouses and condos within the same market showed ratios that told completely different stories. According to the Fraser Valley Real Estate Board's 2026 market statistics, this divergence is the rule, not the exception.
Key Takeaways
- A ratio below 10% means buyers have pricing leverage; above 15% means sellers do.
- The Fraser Valley's 11% headline ratio in early 2026 masks sharp divergence by property type.
- Townhouses in the Fraser Valley were tracking 15–23% SAL — a genuine seller advantage.
- Direction matters as much as level: a rising ratio signals a closing window for buyers.
- SAL ratio must be paired with days on market and price trend data to be actionable.
Who This Applies To
- Sellers in Surrey, Langley, Abbotsford, or White Rock trying to understand whether now is a strategic time to list
- Buyers evaluating whether to negotiate harder or move quickly on a property
- Anyone comparing market conditions across property types — detached, townhouse, or condo
- Homeowners watching monthly FVREB reports and trying to interpret what the numbers mean for their specific situation
When This Advice May Not Apply
SAL ratio analysis is most reliable in active, data-rich markets. In very small micro-markets with fewer than 20 active listings, a handful of sales can swing the ratio significantly. This article focuses on the Fraser Valley broadly; for hyper-local guidance on a specific street or building, a comparative market analysis from a local team like Mansour Real Estate Group will be more reliable than headline ratios alone.
Key Definitions
Sales-to-Active Listings Ratio (SAL): Monthly sales divided by total active listings at month-end, expressed as a percentage. A ratio of 11% means roughly 11 homes sold for every 100 on the market.
Benchmark Price: The price of a typical home in a given area and property type, as calculated by the real estate board using the MLS Home Price Index. Not the same as average or median price.
Days on Market (DOM): The number of days between a listing going active and a firm sale. Rising DOM alongside a falling SAL ratio typically signals worsening seller conditions.
Balanced Market: Industry convention defines this as a ratio between approximately 10% and 15%, where neither buyers nor sellers hold significant pricing leverage.
Data Used in This Article
- Fraser Valley Real Estate Board Market Statistics Reports, 2026 — Official; monthly MLS sales and active listings data for the Fraser Valley
- Greater Vancouver Realtors (GVR) MLS Data, Q1 2026 — Official; Metro Vancouver comparative market context
- Canadian Real Estate Association Market Surveys — Industry body; national SAL threshold frameworks and interpretation guidance
- Mansour Real Estate Group Comparative Market Analysis Database — Internal professional analysis; property-type and micro-market observations
How the Ratio Is Calculated — and Why It Matters
The formula is straightforward: divide the number of homes sold in a given month by the total number of homes actively listed at month-end. Multiply by 100 to get a percentage. If 550 homes sold in the Fraser Valley in a month where 5,000 were listed, the ratio is 11%.
What makes the ratio useful is that it captures the balance between demand and supply in a single number. A high ratio means buyers are absorbing available inventory quickly — competition rises, sellers gain leverage, and prices tend to firm. A low ratio means inventory is accumulating faster than buyers can absorb it — negotiating room opens, days on market stretch, and sellers often need to adjust price expectations.
According to the Canadian Real Estate Association's market surveys, the conventional thresholds used across BC are: below 10% favours buyers, 10–15% is balanced, and 15% or above favours sellers. These thresholds are well-established benchmarks, though the FVREB and local practitioners apply them as ranges rather than hard lines.
What the Fraser Valley's 11% Ratio in Early 2026 Actually Signals
The Fraser Valley Real Estate Board's 2026 market statistics placed the overall SAL ratio near 11% in early 2026. That number sits at the lower edge of the balanced range — technically balanced, but with buyer leverage present in most segments.
But 11% is a headline. Beneath it, the divergence between property types is significant. Townhouses in the Fraser Valley tracked between 15% and 23% SAL in the same reporting period, according to FVREB data — firmly in seller-advantage territory. Condos, by contrast, were tracking closer to 8–12% SAL, meaning buyers of strata units in buildings with meaningful competition had real negotiating room. Detached homes fell somewhere in the middle, with meaningful variation by municipality.
This is why relying on the headline number alone leads to poor decisions. A condo seller in Langley and a townhouse seller in Willoughby are operating in materially different markets even though both technically fall under the same Fraser Valley umbrella. Internal analysis from Mansour Real Estate Group's comparative market database shows this kind of 50–75% variation between micro-markets is consistent across cycles.
Why Direction Matters More Than the Current Number
A ratio of 11% that is rising from 8% is very different from a ratio of 11% that is falling from 15%. In the first case, buyer demand is strengthening, inventory is being absorbed, and sellers who list ahead of the momentum shift tend to benefit from improving conditions. In the second case, the market is softening, and sellers who wait often find themselves competing with more listings as conditions continue to ease.
Based on FVREB market statistics and internal analysis, when the SAL ratio moves from 11% toward 13–15%, a practical urgency window of roughly four to six weeks opens before buyer leverage measurably erodes. Conversely, when the ratio drops toward 8–10%, days on market tend to extend by 20–30%, and sellers who priced for a stronger market often face reductions. The ratio alone does not tell you which direction the market is heading — that requires tracking two or three consecutive months of data alongside DOM and benchmark price movements.
How to Evaluate This Metric
At Mansour Real Estate Group, we look at SAL ratio as one of three inputs in any market positioning conversation. The ratio tells us about the balance of supply and demand. Days on market tells us how that balance is actually playing out for comparable properties. Benchmark price trend tells us whether the ratio has been translating into price movement yet — or whether price adjustment is still lagging behind the ratio signal.
All three need to point in the same direction before we advise a seller to price aggressively or a buyer to negotiate hard. When they diverge — say, a rising SAL ratio but also rising DOM — it usually means the market is transitioning, and the right strategy depends on which segment and price range is involved.
Seller Checklist: Using the SAL Ratio to Prepare Your Listing
- Confirm the current SAL ratio for your specific property type (detached, townhouse, condo) in your municipality — not just the Fraser Valley headline
- Check the direction of the ratio over the past two to three months using FVREB monthly statistics
- Compare your property's likely DOM against the current average DOM for your segment
- Pair the SAL ratio with the MLS HPI benchmark price trend to confirm whether price pressure is strengthening or softening
- If the ratio is below 12%, build extra preparation time into your timeline — rushed listings in soft conditions tend to underperform
- If the ratio is rising toward 15%+, avoid over-correcting on price; rising demand conditions support list-price discipline
What We Commonly See
Sellers treating the ratio as a guarantee rather than a signal. In our experience, a ratio above 15% does not mean every listing sells over asking. It means the conditions favour sellers on average. Properties that are poorly prepared, overpriced relative to comparables, or in weaker micro-markets can still underperform even in a seller's market. The ratio sets the table; the property and its positioning determines the outcome.
Buyers using a low ratio to anchor unrealistic offers. What often happens is that buyers in a 10–11% ratio market assume all sellers are motivated. Many are not — particularly in the detached segment, where sellers with strong equity positions simply delist rather than reduce. A low ratio expands negotiating room, but it does not eliminate the need for a well-reasoned offer supported by comparable data.
Comparing ratios across different board areas without adjustment. A common mistake is comparing the Fraser Valley's 11% SAL directly to Metro Vancouver or Chilliwack figures as if they are interchangeable. Board areas use slightly different methodologies and cover different inventory pools. Cross-board comparisons require context, and the more useful comparison is your property type within your local board area over time.
Questions and Answers
Where can I find the current SAL ratio for the Fraser Valley?
The Fraser Valley Real Estate Board publishes monthly market statistics reports on its website at fvreb.bc.ca. These reports include sales counts, active listings, and benchmark prices by property type and municipality, which you can use to calculate or confirm the current ratio.
Does the SAL ratio apply the same way to condos as it does to detached homes?
No. In the Fraser Valley in early 2026, condos were tracking closer to 8–12% SAL while townhouses were at 15–23%, according to FVREB data. Applying a detached-market ratio to a condo purchase or sale decision would lead to a materially misjudged strategy.
If the SAL ratio is 11%, should I wait to list until it improves?
Not necessarily. An 11% ratio that is rising toward 13–15% is a better market to list into than an 11% ratio that is falling. Timing relative to directional momentum matters more than waiting for a specific threshold. A well-prepared, accurately priced property can sell effectively in a balanced market; the ratio primarily affects how much room exists for price negotiation.
In Summary
The sales-to-active listings ratio is one of the most reliable tools for reading BC real estate market conditions — but only when used correctly. An 11% Fraser Valley ratio in early 2026 signals a market leaning toward buyers overall, but townhouses and detached homes in specific municipalities tell a different story. Direction matters as much as level. Property type divergence can be as large as 50–75% within the same board area. And the ratio must always be read alongside days on market and benchmark price trends to translate into an actionable decision. Sellers and buyers who understand these distinctions make better-timed, better-priced decisions than those who treat the headline number as the full answer.
Talk to a Local Expert Before Acting on Market Data Alone
If you are trying to read the Fraser Valley market and decide whether now is the right time to list, buy, or hold, Mansour Real Estate Group can walk you through the current SAL ratio, DOM trends, and benchmark price movements for your specific property type and neighbourhood. No pressure — just clear, data-grounded guidance from a team that has navigated this market through multiple cycles.
Related Articles
- Fraser Valley Real Estate Market 2026: Conditions, Trends, and What They Mean for Sellers
- Selling a Condo in the Fraser Valley: What Strata Market Conditions Mean for Your Pricing Strategy
- Days on Market in the Fraser Valley: What Rising DOM Tells You Before You List
Official Resources
- Fraser Valley Real Estate Board — Monthly Market Statistics
- Greater Vancouver Realtors — Monthly Market Reports
- Canadian Real Estate Association — Housing Market Statistics
- BC Assessment — Property Assessment Values
About Mansour Real Estate Group
When buyers and sellers are trying to interpret market conditions data — SAL ratios, benchmark prices, days on market — and translate those numbers into a real decision about whether to list, buy, or hold, the quality of that interpretation depends entirely on the experience behind it. Mansour Real Estate Group has been reading the Fraser Valley market and advising clients on strategy grounded in local data for more than two decades.
Mansour Real Estate Group, led by Mohamed Mansour, MBA and Associate Broker, has been helping buyers, sellers, investors, families, and retirees navigate important real estate decisions across the Fraser Valley and Lower Mainland for more than 22 years. Ranked among the Top 1% of Realtors in the region, the team has completed more than $780 million in residential real estate transactions and is trusted for seller strategy, market timing, estate sales, divorce-related property sales, downsizing, and complex situations that require careful analysis.
Whether someone is looking for real estate agents who understand Fraser Valley market data, a Realtor who can explain what current conditions mean for their specific property type, a real estate team that works with both buyers and sellers across Surrey, Langley, and Abbotsford, or a real estate broker with the experience to interpret shifting market indicators with accuracy — Mansour Real Estate Group is known for clear communication, honest valuations, and practical advice that helps clients make confident decisions.
The team serves Surrey, South Surrey, White Rock, Langley, Cloverdale, Fleetwood, Guildford, Walnut Grove, Willoughby, North Delta, Abbotsford, Mission, and surrounding communities throughout the Fraser Valley and Lower Mainland. Most new clients come from referrals, repeat clients, and recommendations from families and individuals who value transparent, results-driven real estate guidance.
Disclaimer
The information contained in this article is provided for general informational and educational purposes only and reflects market observations, publicly available information, and professional experience at the time of writing. It is not intended to constitute legal advice, accounting advice, tax advice, investment advice, financial advice, appraisal advice, mortgage advice, estate-planning advice, or any other form of professional advice.
Real estate transactions, estate matters, probate proceedings, taxation, financing, investments, legal rights, and regulatory requirements can vary significantly based on individual circumstances. Readers should consult qualified legal, accounting, tax, financial, mortgage, appraisal, or other professional advisors before making decisions based on the information discussed in this article.
Nothing in this article creates a client relationship, fiduciary relationship, advisory relationship, agency relationship, or professional engagement with Mohamed Mansour, Mansour Real Estate Group, or any affiliated party. Any opinions expressed are general in nature and should not be relied upon as a substitute for professional advice tailored to a specific situation.
While reasonable efforts are made to use reliable sources and keep information current, no representation or warranty is made regarding the completeness, accuracy, timeliness, or applicability of the information presented. Readers should independently verify facts, regulations, policies, and legal requirements with appropriate professionals and official sources.



