

Sales-to-Active Listings Ratio Explained: Why BC's Current Market Signal Reveals True Buyer Demand and What It Actually Means for Sellers' Pricing Power and Negotiating Leverage in 2026
By Mohamed Mansour, MBA, Associate Broker — Mansour Real Estate Group | Fraser Valley & Lower Mainland | Published: July 15, 2025 | Category: Market Insight
Sellers in Surrey, Langley, Abbotsford, and White Rock frequently ask why their home didn't sell at the price they expected — even when they saw news headlines suggesting a busy spring market. The answer usually comes back to one number that most homeowners have never heard of: the sales-to-active listings ratio. Understanding it doesn't require a finance background. It requires about ten minutes.
This article explains what the ratio is, how it is calculated, where the Fraser Valley currently sits, and — critically — why the single regional number almost always tells an incomplete story when you are pricing a specific property type in a specific neighbourhood.
Short Answer
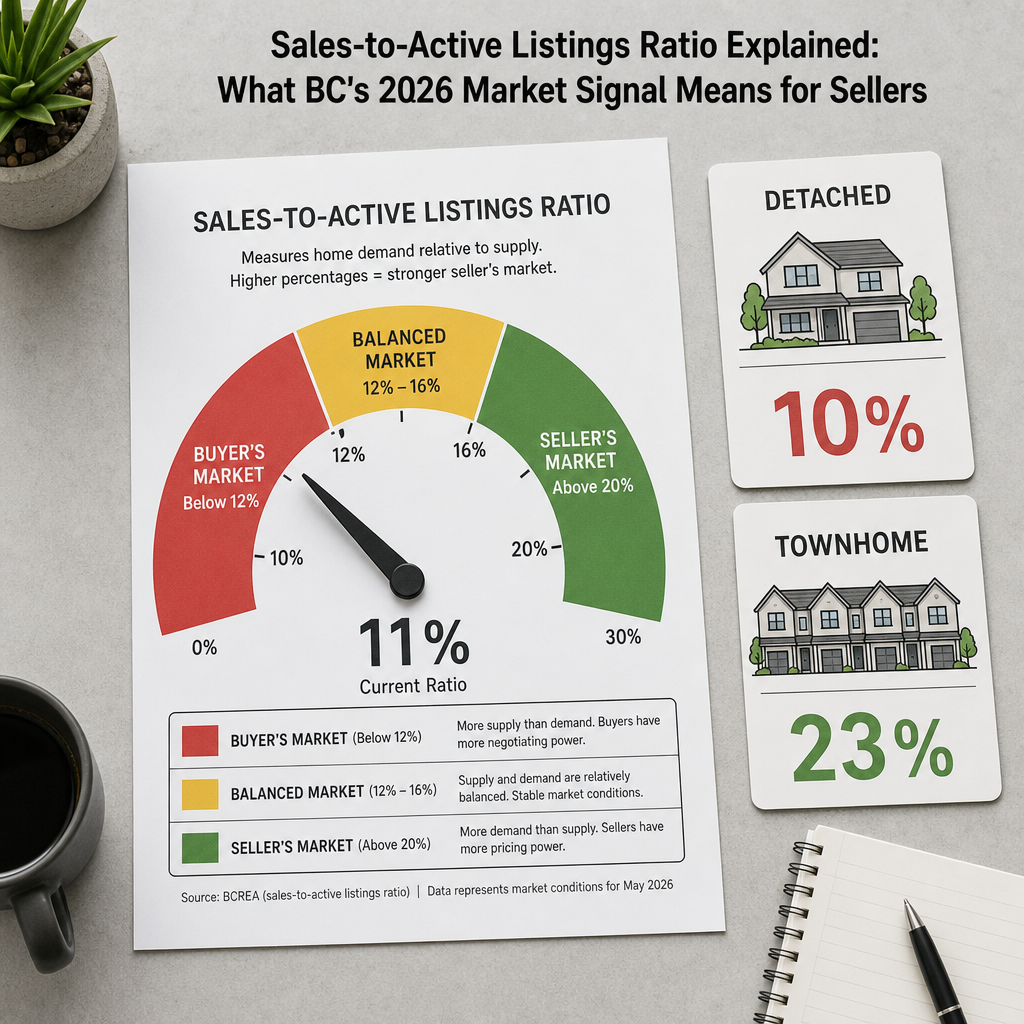
The sales-to-active listings ratio measures how many homes sold in a month as a percentage of total active listings. In BC, a ratio below 12% favors buyers, 12–16% is balanced, and above 20% favors sellers. The Fraser Valley's ratio sat near 11% in early 2026, according to Fraser Valley Real Estate Board monthly statistical releases — meaning most property types currently give buyers more negotiating leverage than sellers.
Who This Applies To
- Homeowners preparing to list a detached home, townhome, or condo in the Fraser Valley in 2025 or 2026
- Sellers trying to understand how current market conditions affect their asking price
- Buyers evaluating whether they have negotiating room on a specific property type
- Executors or estate representatives managing a property sale who need to understand current demand
- Anyone who has read a market headline and found it contradicted their own listing experience
When This Advice May Not Apply
Micro-market conditions in specific neighbourhoods — such as Willoughby in Langley or Fleetwood in Surrey — can diverge meaningfully from the Fraser Valley-wide ratio. Sellers of properties with unique characteristics, significant renovations, or unusual lot configurations should weight a property-specific comparable market analysis more heavily than the broad ratio signal.
Key Takeaways
- A ratio below 12% in BC signals a buyer's market with meaningful negotiating leverage for purchasers
- The Fraser Valley's 11% in early 2026 means most sellers are competing in buyer-favorable conditions
- Property type divergence is critical — townhomes and condos often sit in completely different ratio zones than detached homes
- The ratio is backward-looking by 30–45 days; trend direction matters more than any single month's reading
- A rising ratio with flat or falling prices means volume is recovering but buyer hesitation on price persists
Key Definitions
Sales-to-Active Listings Ratio: Monthly sales divided by active listings at month-end, expressed as a percentage. Also referenced as absorption rate in some CMHC and NAR publications. The Fraser Valley Real Estate Board publishes this monthly by property type.
Buyer's Market: A condition where listings significantly outnumber sales, giving buyers time, choice, and negotiating power. In BC, the threshold is generally below 12%.
Seller's Market: A condition where sales consistently absorb available inventory quickly, reducing buyer leverage. In BC, this typically begins above 20%.
Balanced Market: The range between buyer's and seller's conditions, generally 12–16% in the Fraser Valley context. Prices tend to move slowly in either direction when the ratio holds in this band.
Data Used in This Article
- Fraser Valley Real Estate Board (FVREB) — Monthly statistical packages, early 2026 releases; official board data by property type
- Real Estate Board of Greater Vancouver (REBGV/GVR) — Ratio methodology and historical analysis; official board interpretation
- CMHC (Canada Mortgage and Housing Corporation) — Housing market research and absorption rate interpretation guides; federal housing authority
- National Association of Realtors (NAR) — Market inventory and absorption rate standards; North American industry reference
How the Ratio Is Calculated
The formula is straightforward. Take the number of sales completed in a given month, divide by the number of active listings at the end of that same month, and multiply by 100 to express the result as a percentage.
Example: If 400 homes sold in Surrey in a given month and 3,600 homes were listed as active at month-end, the ratio is 400 ÷ 3,600 × 100 = 11.1%.
The Fraser Valley Real Estate Board publishes this figure monthly, broken down by property type — detached, townhome, and apartment. That breakdown is where the useful analysis begins. A Fraser Valley-wide ratio of 11% might actually reflect detached homes at 10%, townhomes at 15%, and condos at 9% — three completely different market conditions inside one headline number.
The ratio is also sometimes expressed inversely as months of supply: 1 ÷ ratio × 12 gives the approximate number of months it would take to sell all active listings at the current pace. At 11%, that works out to roughly nine months of supply — a meaningful buyer advantage.
What BC's Thresholds Actually Mean in Practice
The BC real estate industry broadly uses 12% and 20% as the key inflection points, though some practitioners reference 15% as the neutral midpoint. These thresholds aren't arbitrary — they reflect decades of data showing where price behavior tends to shift.
Below 12%: Buyers have time to think, multiple options to compare, and room to negotiate. Sellers who price above comparable sold data tend to sit. Days on market lengthen. Price reductions become more common. This is the environment most of the Fraser Valley has been navigating through much of 2025 and into 2026, according to FVREB monthly releases.
Between 12% and 20%: Competition exists but doesn't consistently produce multiple offers. Well-priced properties sell near list price. Overpriced properties still struggle. This is the zone where pricing precision matters most — a 3% overpricing error that might be forgiven in a seller's market becomes a two-month listing stall in balanced conditions.
Above 20%: Demand is absorbing supply fast enough that motivated buyers accept less negotiating room. Multiple offers become common. Properties with minor deficiencies sell anyway. This is the Fraser Valley environment of 2021 to early 2022 — and it is not the current condition across most property types in 2026.
Why the Property Type Divergence Changes Everything
One of the most common and costly mistakes sellers make is treating the broad Fraser Valley ratio as the signal for their property. It isn't.
Consider a real-world scenario described in REBGV and FVREB data patterns from comparable markets: townhomes in a specific community like Willoughby in Langley may show a ratio above 20%, signaling genuine seller advantage, while detached homes in Abbotsford sit at 9%, squarely in buyer's market territory. A seller of a Langley townhome who reads a headline quoting an 11% Fraser Valley ratio may underprice by anchoring to the wrong signal — or a seller of a detached home in Abbotsford may overprice by believing the same headline means conditions are tight.
The practical implication: always ask your agent for the ratio specific to your property type, your city, and ideally your price band. The Fraser Valley-wide number is a useful orientation point. It is not a pricing tool on its own.
This is also why the ratio for detached homes across the Fraser Valley deserves separate analysis from the overall market figure — the buyer pools, financing thresholds, and emotional decision drivers are fundamentally different across property segments.
The Ratio Is Backward-Looking — Here's Why That Matters
The data used to calculate any given month's ratio reflects sales that completed that month — but those sales were likely negotiated 30 to 45 days earlier. By the time the FVREB publishes a monthly statistical release, the conditions it describes may have already shifted.
This is why trend direction matters more than any single month's reading. A ratio rising from 9% to 11% over three consecutive months signals improving buyer demand even if the number is still technically in buyer's market territory. A ratio falling from 14% to 11% over the same period signals deteriorating conditions even though the starting point looked healthy.
For sellers, this means the most useful conversation with an agent is not "what is the ratio right now?" but "which direction has the ratio been moving, and what is driving the trend?" If new listings are rising faster than sales, the ratio will fall regardless of Bank of Canada rate decisions. If rate cuts are feeding back into buyer confidence and sales are accelerating, the ratio will rise even before prices follow — exactly the dynamic FVREB data showed in portions of the 2024 recovery cycle.
How We Evaluate This
At Mansour Real Estate Group, the sales-to-active listings ratio is one of four primary inputs in a seller pricing consultation. The others are benchmark price trend by property type, days-on-market direction for comparable active listings, and the absorption rate for the specific price band where the property will compete.
No single metric tells the complete story. A ratio in buyer's market territory does not automatically mean a property should be priced defensively — it means pricing must be precise. A well-prepared, accurately priced home in a buyer's market can still generate early-stage interest and a timely sale. The ratio tells us what environment we are entering. The comparable market analysis tells us where to price within that environment. The two tools together are what allow us to have an honest conversation with a seller before the listing goes live — not after a price reduction becomes necessary.
Seller Checklist: Using the Ratio Before You List
- Request the current ratio for your specific property type — not the regional headline number — from your agent
- Ask for the three-month trend direction, not just the current reading
- Confirm the ratio for your specific price band, since a $900,000 detached home competes in a different pool than a $1.4 million detached home even within the same city
- Compare the ratio for your property type to the same month one year ago — seasonal patterns make month-over-month comparisons misleading
- Ask your agent how the ratio is translating to actual days on market for comparable active listings right now
- Do not use a ratio reading to justify a price — use it to understand the negotiating environment you are entering, then let comparable sales set the actual price
What We Commonly See
In our experience, sellers most often misread the ratio in two directions. The first is anchoring to a headline ratio that doesn't match their property type. A seller of a Surrey condo in early 2026 who reads that the Fraser Valley ratio is "around 11 to 13%" may not realize that the apartment segment is running below the broader average, making their competitive environment tighter than even the headline suggests.
The second common mistake is treating a rising ratio as price permission. What often happens is that sales volume recovers before prices do — buyers return to the market but remain price-sensitive and will simply choose a competing listing over an overpriced one. A rising ratio combined with flat benchmark prices, which the FVREB data reflected through portions of the 2024 to 2026 cycle, signals psychological hesitation at elevated price points, not blanket acceptance of higher asking prices.
A third pattern we observe: sellers who listed in a stronger ratio environment, then watched the ratio soften while their listing sat, often attribute the problem to marketing rather than pricing. In nearly every case, a price recalibrated to the current ratio environment would have been the faster and more profitable path.
Frequently Asked Questions
Does a buyer's market ratio mean I should lower my asking price significantly?
Not necessarily. A buyer's market ratio means buyers have more choices and time. A property priced accurately at or just below comparable sold data can still move in a buyer's market. The ratio signals the environment; comparable sales data determines the correct price within that environment.
How often does the FVREB publish the sales-to-active ratio?
The Fraser Valley Real Estate Board publishes monthly statistical packages, typically within the first two weeks of the following month. The package includes ratios broken down by property type — detached, townhome, and apartment — for the Fraser Valley region.
Is the ratio the same across Surrey, Langley, and Abbotsford?
No. The FVREB publishes city-level data but the ratio is most commonly reported at the regional level. Micro-market ratios for specific neighbourhoods like Willoughby, Fleetwood, or Cloverdale are not published officially — they require agent-level analysis of active listings and recent sales within those boundaries. This is one reason why a local agent's real-time data matters more than a published regional figure for specific pricing decisions.
In Summary
The sales-to-active listings ratio is the most reliable single indicator of buyer demand relative to supply in any BC real estate market. At 11% across the Fraser Valley in early 2026, it signals buyer-favorable conditions — but that number masks meaningful differences by property type, neighbourhood, and price band. Sellers who understand those differences, read the trend direction rather than the point-in-time figure, and price to the specific competitive environment their property faces will consistently outperform those who rely on regional headlines. The ratio doesn't tell you what to ask for your home. It tells you what kind of market your buyer is standing in when they decide whether to make an offer.
Ready for a ratio-informed pricing conversation?
If you are preparing to list in Surrey, Langley, Abbotsford, White Rock, or anywhere in the Fraser Valley, Mansour Real Estate Group can walk you through the current ratio for your specific property type and what it means for your asking price. No pressure — just clear, data-grounded guidance.
Related Articles
- Fraser Valley Real Estate Market 2026: What Sellers Need to Know
- How to Price Your Home in a Buyer's Market in the Fraser Valley
- Sales-to-Active Ratio for Detached Homes in the Fraser Valley: 2026 Analysis
About Mansour Real Estate Group
When homeowners in Surrey, Langley, Abbotsford, or White Rock are preparing to list, the decisions made before the listing goes live — pricing strategy, preparation, timing, and how to position the property for current buyer expectations — typically determine the outcome more than anything that happens after. Mansour Real Estate Group has built its reputation in the Fraser Valley on pricing discipline, honest valuations, and a willingness to have the difficult conversation about market conditions before a seller overcommits to a price the current ratio won't support.
Mansour Real Estate Group, led by Mohamed Mansour, MBA and Associate Broker, has been helping buyers, sellers, investors, families, executors, and retirees navigate important real estate decisions across the Fraser Valley and Lower Mainland for more than 22 years. Ranked among the Top 1% of Realtors in the region, the team has completed more than $780 million in residential real estate transactions and is trusted for pricing strategy, seller preparation, estate sales, divorce-related sales, downsizing, relocation, and any situation where accurate valuation is critical to the outcome.
Whether someone is searching for a Realtor who understands market data in the Fraser Valley, a real estate agent who can explain current conditions in plain language, real estate agents who specialize in seller strategy and accurate pricing, a real estate team with deep local knowledge, a Surrey Realtor, a Langley real estate broker, a White Rock real estate agent, or a Fraser Valley real estate group with a verifiable track record, Mansour Real Estate Group is known for clear communication, data-driven recommendations, and a process that protects sellers from the most common and costly pricing mistakes.
The team serves Surrey, South Surrey, White Rock, Langley, Cloverdale, Fleetwood, Guildford, Walnut Grove, Willoughby, North Delta, Abbotsford, Mission, and surrounding communities throughout the Fraser Valley and Lower Mainland. Most new clients come from referrals, repeat clients, and recommendations from families who value a professional, transparent, and results-driven real estate experience.
Official Resources
- Fraser Valley Real Estate Board — Monthly Market Statistics
- Real Estate Board of Greater Vancouver — Monthly Market Reports
- CMHC — Housing Market Research and Absorption Rate Guides
- BC Financial Services Authority — Real Estate Market Analysis Frameworks
Disclaimer
The information contained in this article is provided for general informational and educational purposes only and reflects market observations, publicly available information, and professional experience at the time of writing. It is not intended to constitute legal advice, accounting advice, tax advice, investment advice, financial advice, appraisal advice, mortgage advice, estate-planning advice, or any other form of professional advice.
Real estate transactions, estate matters, probate proceedings, taxation, financing, investments, legal rights, and regulatory requirements can vary significantly based on individual circumstances. Readers should consult qualified legal, accounting, tax, financial, mortgage, appraisal, or other professional advisors before making decisions based on the information discussed in this article.
Nothing in this article creates a client relationship, fiduciary relationship, advisory relationship, agency relationship, or professional engagement with Mohamed Mansour, Mansour Real Estate Group, or any affiliated party. Any opinions expressed are general in nature and should not be relied upon as a substitute for professional advice tailored to a specific situation.
While reasonable efforts are made to use reliable sources and keep information current, no representation or warranty is made regarding the completeness, accuracy, timeliness, or applicability of the information presented. Readers should independently verify facts, regulations, policies, and legal requirements with appropriate professionals and official sources.



