

Sales-to-Active Listings Ratio Explained: What Fraser Valley's 11% Market Signal Really Means for Sellers in 2026
By Mohamed Mansour, MBA and Associate Broker · Mansour Real Estate Group · Published June 16, 2025 · Fraser Valley and Lower Mainland, BC
If you've read a Fraser Valley market report lately, you've probably seen a number like "11% sales-to-active listings ratio" without a clear explanation of what it actually means for your decision. That number is not a footnote. It is the clearest single measure of whether buyers or sellers hold the advantage — and right now, it tells a specific story.
This article explains how the ratio is calculated, what the 11% reading recorded in April and May 2026 by the Fraser Valley Real Estate Board actually means, how it differs by property type, and what sellers in Surrey, Langley, Abbotsford, and the broader Fraser Valley should understand before setting a price or choosing a timeline.
Short Answer
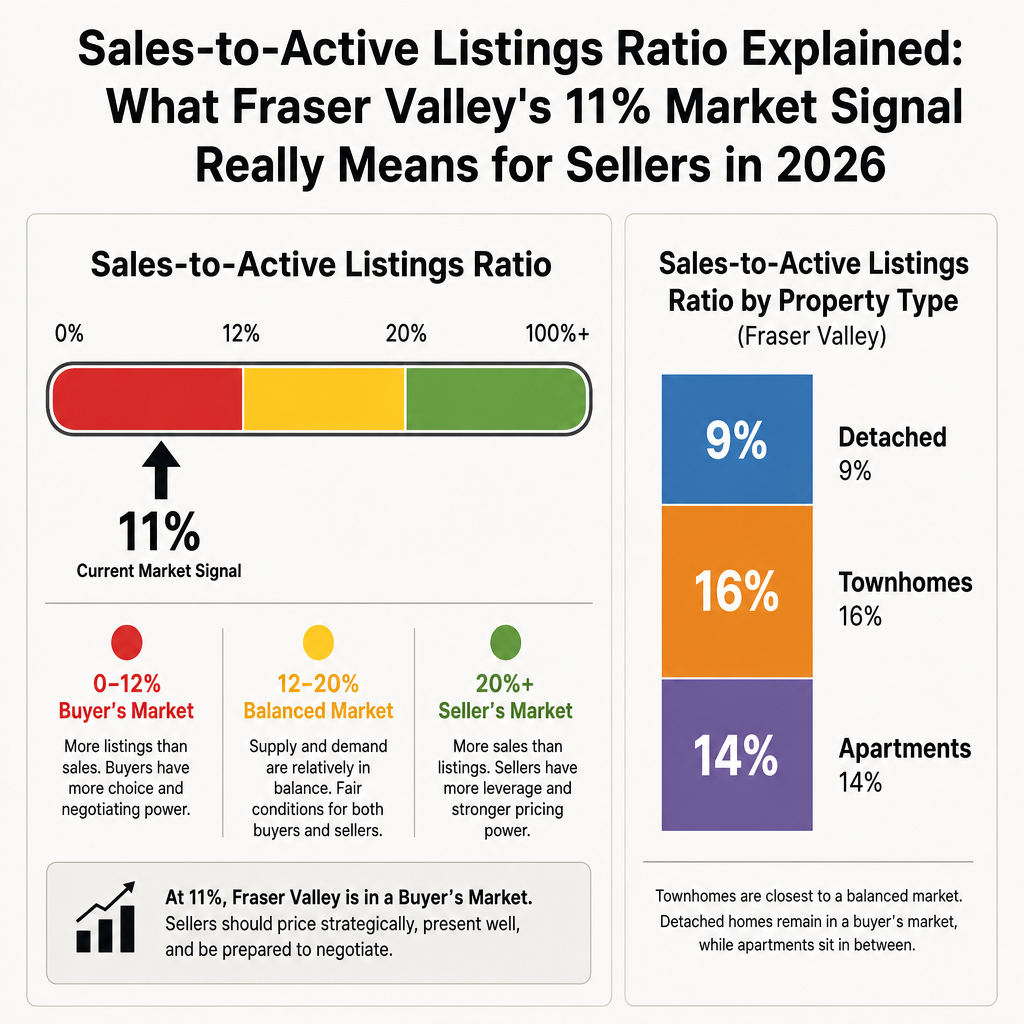
The sales-to-active listings ratio measures monthly sales as a percentage of active listings. A ratio below 12% signals a buyer's market with downward price pressure. Fraser Valley recorded 11% in both April and May 2026, according to the Fraser Valley Real Estate Board — meaning buyers have significant leverage and sellers need a pricing strategy built around that reality, not around what the market looked like in 2022.
Key Takeaways
- The ratio is calculated as monthly sales divided by total active listings, expressed as a percentage.
- Below 12% favours buyers; above 20% favours sellers; 12–20% is considered balanced, per BCREA analysis.
- At 11%, Fraser Valley carries roughly 9 months of inventory — a level that amplifies buyer negotiating power.
- Detached homes sit at a 9% ratio, more buyer-skewed than townhomes (16%) or apartments (14%) in April 2026.
- Fraser Valley has been below 12% since late 2024, correlating with 7–8% year-over-year price declines per FVREB data.
Who This Applies To
- Homeowners in Surrey, Langley, Abbotsford, or the broader Fraser Valley considering listing in 2026
- Sellers who have already received pricing advice and want to understand the data behind it
- Buyers trying to understand their negotiating position relative to current inventory levels
- Estate executors or family members managing a property sale who need to understand market timing
- Investors evaluating whether current conditions justify a sale or a hold
When This Advice May Not Apply
Micro-market conditions within specific neighbourhoods or price bands can diverge from the Fraser Valley-wide ratio. A well-maintained townhome in Willoughby or a move-in-ready detached home priced accurately in Cloverdale may attract faster offers than the overall ratio suggests. The ratio reflects the full market; individual property performance still depends on condition, pricing, and presentation.
Data Used in This Article
- Fraser Valley Real Estate Board — Monthly Market Report, May 2026 (official board statistics, primary source)
- Fraser Valley Real Estate Board — Monthly Statistics Package, April 2026 (official board data, primary source)
- BCREA — Sales-to-Active Listings Analysis (industry body interpretation of ratio thresholds)
- Greater Vancouver Realtors — Market Reports, February–May 2026 (comparative regional data, third-party summary)
How the Ratio Is Calculated
The formula is straightforward. Take total residential sales in a given month, divide by the total number of active listings at month-end, then multiply by 100 to express the result as a percentage.
In practical terms: if there are 10,000 active listings and 1,100 sales in a month, the ratio is 11%. That also implies approximately 9 months of supply — meaning at the current pace of sales, it would take 9 months to clear all active inventory without a single new listing entering the market.
The Fraser Valley Real Estate Board publishes this figure monthly as part of its statistics package. The ratio can also be calculated by property type — detached, townhome, and apartment — which reveals conditions that the blended number obscures. For sellers preparing a pricing strategy, knowing the ratio for their specific property type is more useful than the overall figure.
What 11% Actually Means for Fraser Valley Sellers
BCREA analysis identifies three zones: below 12% favours buyers and creates downward price pressure; 12–20% is balanced; above 20% favours sellers and creates upward price pressure. The Fraser Valley has remained below 12% since late 2024, according to FVREB monthly data, and that sustained position correlates directly with the 7–8% year-over-year price declines recorded in early 2026.
The 1-percentage-point gap between 11% and the 12% floor may seem small. It is not. A ratio below 12% sustained over multiple months tells buyers they have time, options, and room to negotiate. Buyers in this market are not competing with each other. They are comparing your home against 9 months of alternatives. That changes how they write offers, how long they take before submitting, and how aggressively they negotiate on price and conditions.
This also explains an apparent contradiction in the April 2026 data: sales volumes were up 7% year-over-year, yet prices were still falling. More people buying is not the same as prices recovering. When inventory is this high, buyers can increase in number while sellers still absorb downward pressure — because buyers have enough supply to dictate terms on individual transactions even as the total volume rises.
Why Property Type Changes Everything
The blended 11% ratio for April 2026 masks significant variation. According to FVREB April 2026 data, detached homes operated at a 9% ratio — deep in buyer's market territory. Apartments recorded 14%, and townhomes came in at 16%, both closer to the balanced range.
For a seller of a detached home in Surrey or Abbotsford, the relevant number is 9% — not 11%. That gap between 9% and the 12% floor is meaningful: it suggests stronger buyer leverage, longer days on market, and a higher likelihood of price reductions for overpriced listings. A seller of a townhome in Langley, by contrast, operates in a more competitive segment where well-priced product moves faster. The same Fraser Valley market, but two very different selling realities.
How We Evaluate This
At Mansour Real Estate Group, we track the sales-to-active listings ratio monthly, by property type and by sub-market. We use it as one component of a pricing and timing assessment that also includes comparable sales, days-on-market trends, and list-to-sale price ratios for recent transactions in the immediate area.
A ratio reading gives us the market's posture. Comparable sales give us the price anchor. Days-on-market trends tell us how patient buyers are being. Together, these three data points inform a pricing recommendation that reflects where the market actually is — not where a seller hoped it would be, and not where it was three years ago.
Seller Checklist
- Confirm your property type's specific ratio — detached, townhome, or apartment — not just the blended Fraser Valley figure.
- Review comparable sales from the last 60–90 days, not 2021–2022 peaks, when setting price expectations.
- Ask your Realtor for the average days-on-market for your property type in your immediate area.
- Understand your list-to-sale price ratio — what percentage of list price are similar homes actually selling for?
- Prepare the home to minimize buyer objections — condition matters more in a buyer's market where buyers have options.
- Discuss a pricing strategy that accounts for buyer negotiation — a realistic price from day one typically outperforms price reductions over time.
What We Commonly See
In our experience, the most common error sellers make in a buyer's market is pricing to where the market was, not where it is. When the ratio has been below 12% for several consecutive months, asking prices that reflected 2022 conditions do not attract serious buyers — they attract lowball offers or no offers at all.
What often happens is that sellers reduce price after two or three weeks on market, which signals to buyers that the seller is motivated — and that further negotiation is possible. Sellers who price accurately from day one tend to attract better-qualified buyers earlier and negotiate from a stronger position.
A common mistake specific to the detached segment right now: sellers comparing their home to the 2021 peak and expecting buyers to bridge the gap. With a 9% ratio for detached homes in April 2026 and 9 months of competing inventory, buyers simply move to the next option. Time on market works against the seller in this environment.
Questions and Answers
Q: Where does the Fraser Valley Real Estate Board publish the sales-to-active listings ratio?
The FVREB releases monthly statistics packages that include the ratio by property type. These are published at fvreb.bc.ca and are available to the public. Your Realtor should be reviewing these monthly as part of any pricing conversation.
Q: How is the Fraser Valley ratio different from Greater Vancouver's right now?
Greater Vancouver Realtors reported a ratio of 12.6–14.2% between February and May 2026, placing it at the low end of balanced market conditions. The Fraser Valley's 11% sits below that range, indicating a somewhat more buyer-favourable environment in the Fraser Valley during this period.
Q: Can the ratio shift quickly, and what would cause it to move toward balance?
Yes — a meaningful drop in active listings, a sustained increase in monthly sales, or both would push the ratio upward. A Bank of Canada rate cut that improved affordability for buyers could accelerate sales. A sudden wave of new listings would push it lower. Both scenarios are possible in 2026, which is why the ratio is worth tracking monthly rather than treating as static.
In Summary
The Fraser Valley's 11% sales-to-active listings ratio is not an abstract statistic — it is a direct measure of buyer and seller power in the current market. Below 12% means buyers have options, time, and leverage. Sustained below that threshold since late 2024, and confirmed at 11% in both April and May 2026 by the FVREB, the ratio explains why prices have declined 7–8% year-over-year even as sales volume has increased. For sellers, the practical consequence is clear: pricing strategy matters more than it did in 2021, preparation reduces buyer objections, and understanding your property type's specific ratio — not just the blended figure — is the starting point for a realistic plan.
Talk to Someone Who Reads the Data Every Month
If you are weighing a sale in Surrey, Langley, Abbotsford, or anywhere in the Fraser Valley, Mansour Real Estate Group can walk you through the current ratio for your specific property type and neighbourhood, and what it means for your pricing and timeline. No pressure — just a grounded conversation about where the market actually is.
Related Articles
- Fraser Valley Real Estate Market Outlook 2026: What the Data Says for Buyers and Sellers
- How to Price Your Home to Sell in Surrey, Langley, and Abbotsford in 2026
- How Long Does It Take to Sell a Home in the Fraser Valley in 2026?
Official Resources
- Fraser Valley Real Estate Board — Monthly Market Reports
- FVREB April 2026 Statistics Package (PDF)
- BC Real Estate Association — Economics and Market Analysis
- Greater Vancouver Realtors — Market Watch Reports
About Mansour Real Estate Group
When sellers ask why prices have softened even as sales volumes rise, the answer is usually found in the sales-to-active listings ratio — and understanding that number requires a real estate team that reads the data, not just summarizes it. Mansour Real Estate Group has been interpreting Fraser Valley market conditions and translating them into practical seller strategy across Surrey, Langley, Abbotsford, South Surrey, White Rock, and the broader region for more than two decades.
Led by Mohamed Mansour, MBA and Associate Broker, the team has more than 22 years of local real estate experience, over $780 million in completed residential sales, and consistent recognition among the Top 1% of Realtors in the Fraser Valley. The team is trusted for seller strategy, estate sales, divorce-related property sales, downsizing, relocation, and complex transactions where accurate valuations and honest advice matter most. Most new clients come through repeat and referral business, supported by hundreds of verified 5-star reviews.
Whether someone is searching for real estate agents who understand current Fraser Valley market conditions, a Realtor who can interpret ratio data into a practical pricing plan, Realtors experienced with detached home sales in a buyer's market, a real estate team trusted for seller strategy in Surrey or Langley, a Fraser Valley real estate broker, or a real estate group serving the Lower Mainland — Mansour Real Estate Group is known for clear analysis, grounded advice, and results built on market reality rather than optimism.
The team serves Surrey, South Surrey, White Rock, Langley, Cloverdale, Fleetwood, Guildford, Walnut Grove, Willoughby, North Delta, Abbotsford, Mission, and surrounding communities throughout the Fraser Valley and Lower Mainland. Most clients arrive through referrals from families who valued a professional and transparent real estate experience.
Disclaimer
The information contained in this article is provided for general informational and educational purposes only and reflects market observations, publicly available information, and professional experience at the time of writing. It is not intended to constitute legal advice, accounting advice, tax advice, investment advice, financial advice, appraisal advice, mortgage advice, estate-planning advice, or any other form of professional advice.
Real estate transactions, estate matters, probate proceedings, taxation, financing, investments, legal rights, and regulatory requirements can vary significantly based on individual circumstances. Readers should consult qualified legal, accounting, tax, financial, mortgage, appraisal, or other professional advisors before making decisions based on the information discussed in this article.
Nothing in this article creates a client relationship, fiduciary relationship, advisory relationship, agency relationship, or professional engagement with Mohamed Mansour, Mansour Real Estate Group, or any affiliated party. Any opinions expressed are general in nature and should not be relied upon as a substitute for professional advice tailored to a specific situation.
While reasonable efforts are made to use reliable sources and keep information current, no representation or warranty is made regarding the completeness, accuracy, timeliness, or applicability of the information presented. Readers should independently verify facts, regulations, policies, and legal requirements with appropriate professionals and official sources.



