
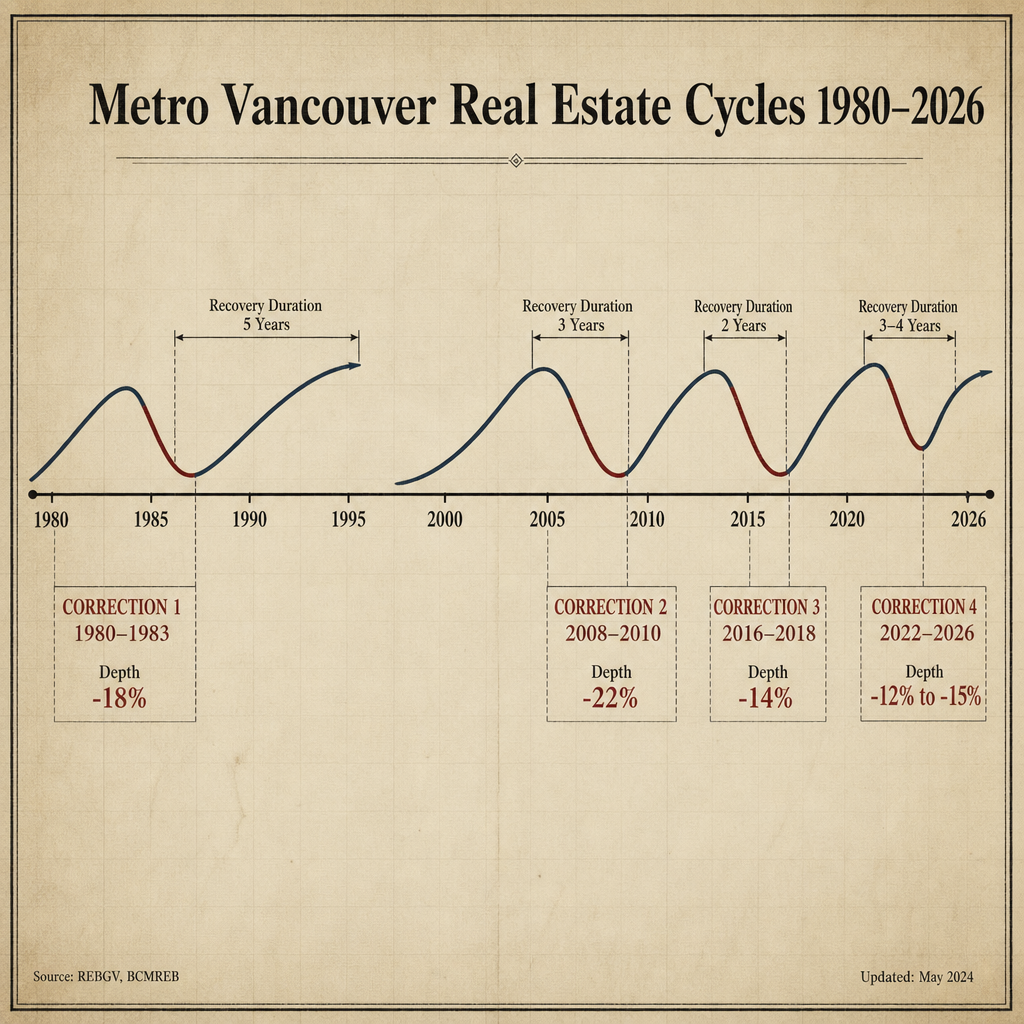

Metro Vancouver Real Estate Cycles 1980–2026: Historical Patterns, Correction Depth and Duration, and What Past Recoveries Reveal About Current Buyer and Seller Timing Windows
By Mohamed Mansour, MBA and Associate Broker — Mansour Real Estate Group | Fraser Valley and Lower Mainland | Published: July 15, 2025
For buyers and sellers navigating Metro Vancouver and the Fraser Valley in 2026, the current correction feels unfamiliar. Elevated inventory, slower sales, and price softness create uncertainty that is difficult to interpret in real time. But this market has been here before — four times in the past 45 years. Each cycle followed a recognizable pattern, and each recovery rewarded those who understood the data rather than reacted to the headline.
This article examines what actually happened during the 1982, 2008, 2016–2018, and 2022–2026 correction cycles — how deep prices fell, how long stabilization took, and what early recovery looked like in each case. The goal is to replace cycle-driven hesitation with informed context.
Short Answer
Metro Vancouver has completed four major correction cycles since 1980. Each one saw prices decline 8–20%, stabilize within 12–24 months, and recover fully within 24–48 months. Current 2026 indicators — stabilizing month-over-month prices, shrinking days-on-market in entry-level segments, and an 11% sales-to-active ratio — align with early-recovery phases observed in prior cycles, not deepening corrections.
Key Takeaways
- Metro Vancouver has averaged a major correction every 10–12 years since 1980, each followed by a full price recovery.
- Corrections have ranged from 8% (2016–2018) to 20% (1980–1983); stabilization typically occurs 12–24 months from peak decline.
- The 2022–2026 correction is bifurcated: detached homes largely recovered by 2024 while condos remain down 12–15%.
- Buyer hesitation historically peaks 6–12 months into a correction — often the period that precedes the strongest recovery window.
- Each recovery differed in shape: V-shaped in 2009–2010, gradual in 1983–1986, and segment-specific in 2024–2026.
Who This Applies To
- Buyers waiting for clearer signals before committing to a purchase in Metro Vancouver or the Fraser Valley
- Sellers trying to understand whether current softness is temporary or structural
- Homeowners evaluating whether to hold, list, or upgrade during a correction
- Investors comparing current conditions to past entry points
When This Advice May Not Apply
Historical patterns describe aggregate market behaviour. Individual properties, neighbourhoods, and strata buildings can deviate significantly from broad trends. This article does not constitute investment advice. Readers with specific property decisions should consult a qualified local real estate professional and, where appropriate, legal or financial advisors.
Data Used in This Article
- Real Estate Board of Greater Vancouver (REBGV) benchmark price archives, 1980–2026 (official board data)
- Teranet House Price Index, BC quarterly data 1990–2026 (third-party index)
- CMHC Regional Housing Observer reports, 2000–2026 (official federal housing data)
- Statistics Canada Housing Price Index, Metro Vancouver 1980–2026 (official federal statistics)
- Mansour Real Estate Group transaction data and market observations, 1995–2026 (internal professional analysis)
Definitions
Benchmark Price: A standardized price measure from the REBGV that adjusts for property attributes, making it more useful for comparing values over time than average or median prices.
Sales-to-Active Ratio: Total sales in a period divided by total active listings. Below 12% is generally considered a buyer's market; above 20% favours sellers. The REBGV uses this metric to characterize market balance. At 11%, the current Fraser Valley market sits in buyer's market territory.
Days on Market (DOM): The number of calendar days between a property's listing date and the date a subject-free offer is accepted. Declining DOM in specific segments is an early indicator of improving demand.
How We Evaluate This
At Mansour Real Estate Group, we track market cycle indicators across three dimensions: price trend (month-over-month benchmark movement), velocity (sales-to-active ratio and days-on-market by segment), and buyer behaviour (offer volumes, subject removal rates, and price-reduction frequency). Broad year-over-year declines can obscure early recovery signals visible at the segment level — which is why comparing current conditions to analogous points in prior cycles adds context that aggregate statistics miss.
Our internal transaction data from 1995 through 2026 covers more than $780 million in completed residential sales and spans all four of the correction cycles discussed here. That history shapes how we interpret current conditions — not as prediction, but as informed pattern recognition.
The 1980–1983 Recession Cycle
The early 1980s correction was the most severe Metro Vancouver has experienced in the modern era. Driven by rapidly rising interest rates — the Bank of Canada's overnight rate peaked above 20% in 1981 — detached home prices fell an estimated 15–20% from peak, according to REBGV historical benchmark data and Statistics Canada's Housing Price Index for BC. The condo market fared worse, with some segments declining 20–25%.
Stabilization took 18–24 months. Full recovery to 1980 price levels required 36–48 months for detached homes and longer for condos. The recovery was gradual rather than sharp — prices drifted upward for several years before any meaningful acceleration. There was no V-shaped rebound. Buyers who entered in 1983–1984, when conditions felt deeply uncertain, captured the full appreciation cycle of the late 1980s.
The lesson from this cycle is that recovery is not always visible when it begins. Markets can stabilize and begin appreciating before buyer confidence catches up.
The 2008 Financial Crisis Cycle
The 2008 global financial crisis triggered a 12–15% price decline across Metro Vancouver property types, with the bottom reached approximately Q3 2009 according to Teranet House Price Index data. Unlike the 1980s, the recovery was rapid: benchmark prices returned to 2007 levels by approximately Q1 2012, a full recovery window of 24–36 months.
This cycle produced the clearest V-shaped recovery in Metro Vancouver's recorded history. The speed was driven by near-zero interest rates, strong immigration, and constrained supply — conditions that did not exist in 1982. Buyers who hesitated through 2009 and into 2010, waiting for further declines that never came, paid materially more by 2011. The 2026 market context shares some features with 2009 — elevated inventory, softening prices, and compressed buyer activity — while differing on interest rate trajectory.
The 2016–2018 Foreign Buyer Tax Correction
In August 2016, the BC Government introduced a 15% Foreign Buyer Tax on residential real estate in Metro Vancouver. The market response was immediate. According to REBGV sales data, transactions dropped sharply in the months following the announcement, and benchmark prices in West Vancouver, North Vancouver, and Coquitlam declined 8–12% over the following 12–18 months.
What followed was a period of consolidation rather than collapse. Prices stabilized through 2017, then began climbing in late 2018, setting the stage for the sharp appreciation of 2019–2020. This cycle demonstrated that policy-driven corrections — while real — tend to be shallower than recession-driven ones and resolve faster once the market absorbs the new regulatory reality. The current tariff and economic uncertainty context bears some resemblance to a policy-driven correction, though the mechanisms differ.
The 2022–2026 Post-COVID Correction
The most recent cycle began with an extraordinary appreciation spike. From March 2020 to September 2021, Metro Vancouver benchmark prices rose 25–30% across most property types, driven by pandemic-era demand shifts, record-low borrowing costs, and compressed inventory. When the Bank of Canada began raising rates aggressively in 2022 — eventually reaching 5.0% — the correction that followed was significant but not symmetrical with the preceding spike.
REBGV benchmark data and Teranet Index figures show aggregate corrections of 15–18% from the 2022 peak. But the correction has been bifurcated in a way not seen in prior cycles. Detached homes in many Fraser Valley and Metro Vancouver submarkets recovered meaningfully by 2024, while the condo market remains down an estimated 12–15% from peak as of 2026, reflecting supply additions, investor exit, and weaker absorption in that segment.
This bifurcation matters. Looking at aggregate Metro Vancouver price data understates the recovery already underway in detached and townhouse segments while obscuring continued softness in condos. The townhouse segment, in particular, has shifted faster than the headline numbers suggest.
What the Four Cycles Have in Common
Across all four correction periods, a consistent pattern emerges. Prices stabilized 12–24 months from peak decline. Full recovery to prior highs took 24–48 months. Buyer hesitation peaked in the 6–12 month window after peak price drop — typically the period closest to the actual bottom. And in every cycle, the buyers who re-entered during consolidation — before recovery was broadly acknowledged — captured the strongest subsequent appreciation.
What differed was the shape: gradual in 1983, V-shaped in 2009, consolidation-then-spike in 2018, and segment-specific in 2024–2026. Shape matters for strategy. The question of whether Metro Vancouver is approaching a market bottom in 2026 turns partly on which shape this recovery takes.
What 2026 Indicators Suggest When Mapped Against Prior Cycles
The current Fraser Valley market shows a sales-to-active ratio near 11%, placing it firmly in buyer's market territory according to FVREB definitions. Days on market for entry-level detached homes are running approximately 25 days in competitive neighbourhoods. Month-over-month benchmark prices have begun stabilizing after two years of year-over-year softness.
When these indicators are mapped against analogous points in prior cycles, the pattern is consistent with early stabilization — not deepening correction. In 2009, sales velocity improved in spring before prices confirmed the bottom. In 2017, DOM compressed in Surrey and Langley before the 2018 recovery was visible in the benchmark data. The 2026 housing forecast data reflects similar leading indicators. That does not mean recovery is guaranteed or imminent — but it does mean conditions are no longer consistent with the deepening-correction narrative that dominated 2023 and early 2024.
Buyer and Seller Timing Checklist
- Identify which segment you are buying or selling in — detached, townhouse, or condo — as recovery timing differs significantly in 2026.
- Track month-over-month benchmark movement in your specific target area, not just year-over-year headlines, which lag by definition.
- Monitor the sales-to-active ratio for your property type in your submarket; a move from 11% toward 14–16% typically precedes price stabilization.
- For sellers: compare current price to the 2022 peak and the pre-COVID 2019 baseline to understand where you sit in the cycle, not just versus last year.
- For buyers: review days-on-market trends by neighbourhood to identify where competition is already quietly increasing.
- Consult your mortgage professional on current stress test qualification before assuming what the rate environment will look like at renewal; see the mortgage renewal strategies guide for homeowners facing higher rates.
What We Commonly See
Buyers waiting for a headline signal. In our experience working through multiple correction cycles in the Fraser Valley and Lower Mainland, buyers consistently wait for a public announcement of recovery before acting. That signal rarely comes cleanly. In 2009, the market had already absorbed most of its loss before any major publication called a bottom. In 2018, Surrey and Langley townhouses were selling briskly before the aggregate data reflected it. Buyers who require certainty before moving typically pay for that certainty.
Sellers anchoring to peak prices. What often happens is that sellers who bought or last valued their property at 2022 peak prices resist listing at current market because the comparison feels like a loss. Historically, the sellers who held through the 2009 and 2018 recoveries did recover that value — but those who needed to sell during a correction and refused to price at market ended up sitting on the market for months before eventually accepting a lower price anyway.
Treating aggregate data as uniform. A common mistake is reading "Metro Vancouver down 7% year-over-year" as applying equally to all segments and neighbourhoods. In every correction we have observed, some segments bottom and begin recovering while others continue declining. In 2026, this divergence between detached and condo markets is more pronounced than in any prior cycle.
Questions and Answers
How long did it take Metro Vancouver to recover from the 2008 financial crisis?
According to Teranet House Price Index data, Metro Vancouver benchmark prices reached their post-2008 bottom in approximately Q3 2009 and returned to 2007 peak levels by approximately Q1 2012 — a full recovery of roughly 24–36 months.
Is the current Fraser Valley correction deeper than previous cycles?
At an estimated 15–18% aggregate decline from the 2022 peak, based on REBGV benchmark data, the current correction is comparable in depth to the 2008 cycle and shallower than 1980–1983. It is deeper than the 2016–2018 correction. However, the preceding appreciation spike of 25–30% was also larger than in those prior cycles.
Why are detached homes recovering faster than condos in 2026?
Detached homes benefit from constrained land supply and strong family-formation demand. Condos face higher new supply completions, investor exit pressure, and stricter lending for strata properties. This segment divergence is consistent with what CMHC regional data has described in its most recent housing observer reports for BC, and it mirrors the pattern seen in 2010–2012 when detached recovered before condos.
In Summary
Metro Vancouver has experienced four major correction cycles since 1980. Each ended. Each was followed by a full recovery that rewarded buyers who entered during the period of maximum uncertainty. The 2022–2026 correction is real, but current indicators — stabilizing month-over-month prices, compressed DOM in entry-level segments, and an 11% sales-to-active ratio that has historically preceded recovery — place this market closer to early stabilization than to a deepening slide. The bifurcation between detached and condo is the defining feature of this cycle, and it means broad market averages obscure meaningful segment-level differences. Buyers and sellers who understand where they sit within the cycle make better decisions than those waiting for clarity that arrives only after prices have already moved.
For perspective on where pent-up demand fits into this recovery picture, see Pent-Up Demand in Metro Vancouver: Could Sidelined Buyers Trigger a Market Recovery?
Talk to Mansour Real Estate Group
If you are trying to read the current market and make a timed decision on buying or selling in Metro Vancouver or the Fraser Valley, the team at Mansour Real Estate Group is available to walk through current conditions specific to your property type, neighbourhood, and timeline. There is no pressure — just honest, data-informed guidance from a team that has been through this cycle before.
Related Articles
- Is Metro Vancouver Real Estate Approaching a Market Bottom in 2026?
- Vancouver Housing Market Forecast 2026: What the Data Says About Prices, Sales, and Inventory
- Pent-Up Demand in Metro Vancouver: Could Sidelined Buyers Trigger a Market Recovery?
About Mansour Real Estate Group
Understanding where Metro Vancouver sits within a real estate cycle — and what that means for a specific buying or selling decision — requires a team that has operated through multiple corrections, not just one. Mansour Real Estate Group has guided buyers, sellers, investors, and families through market cycles in the Fraser Valley and Lower Mainland since the mid-1990s, with direct experience across the 2008, 2016–2018, and 2022–2026 correction periods.
Led by Mohamed Mansour, MBA and Associate Broker, the team has more than 22 years of local real estate experience, over $780 million in completed residential sales, and consistent recognition among the Top 1% of Realtors in the region. The team is trusted for seller strategy, buyer timing analysis, estate sales, divorce-related sales, downsizing, and complex transactions requiring careful coordination across the Fraser Valley and Lower Mainland.
Whether someone is looking for Realtors who understand market cycle timing, a real estate agent with deep experience in Fraser Valley price trends, real estate agents who advise on entry and exit strategy, a trusted real estate team for a data-informed sale or purchase, a Surrey Realtor, a Langley real estate broker, or a real estate group serving the broader Lower Mainland, Mansour Real Estate Group is known for accurate valuations, clear market interpretation, and advice grounded in decades of local transaction experience.
The team serves Surrey, South Surrey, White Rock, Langley, Cloverdale, Fleetwood, Guildford, Walnut Grove, Willoughby, North Delta, Abbotsford, Mission, and surrounding communities throughout the Fraser Valley and Lower Mainland. Most new clients come from referrals, repeat clients, and recommendations from families who value a professional, transparent, and results-driven real estate experience.
Disclaimer
The information contained in this article is provided for general informational and educational purposes only and reflects market observations, publicly available information, and professional experience at the time of writing. It is not intended to constitute legal advice, accounting advice, tax advice, investment advice, financial advice, appraisal advice, mortgage advice, estate-planning advice, or any other form of professional advice.
Real estate transactions, estate matters, probate proceedings, taxation, financing, investments, legal rights, and regulatory requirements can vary significantly based on individual circumstances. Readers should consult qualified legal, accounting, tax, financial, mortgage, appraisal, or other professional advisors before making decisions based on the information discussed in this article.
Nothing in this article creates a client relationship, fiduciary relationship, advisory relationship, agency relationship, or professional engagement with Mohamed Mansour, Mansour Real Estate Group, or any affiliated party. Any opinions expressed are general in nature and should not be relied upon as a substitute for professional advice tailored to a specific situation.
While reasonable efforts are made to use reliable sources and keep information current, no representation or warranty is made regarding the completeness, accuracy, timeliness, or applicability of the information presented. Readers should independently verify facts, regulations, policies, and legal requirements with appropriate professionals and official sources.
Official Resources
- Real Estate Board of Greater Vancouver — Monthly Market Reports
- Teranet–National Bank House Price Index
- CMHC — Housing Market Data and Research
Key Takeaways
Understanding your local real estate market is the foundation of making informed decisions, whether you're buying, selling, or investing. Market conditions fluctuate based on supply and demand, interest rates, and economic factors—all of which directly impact property values and investment returns. By staying informed about trends, comparable sales, and neighborhood developments, you position yourself to negotiate effectively and time your transactions strategically.
The most successful real estate transactions happen when buyers and sellers have realistic expectations grounded in current market data. Taking the time to research comparable properties, consult with experienced professionals, and understand your financial position will pay dividends in the long run.
Final Thoughts
Real estate remains one of the most significant investments most people make in their lifetime. Whether this is your first purchase or your tenth property transaction, the principles of thorough research, honest assessment of your needs, and professional guidance remain constant. Market conditions may change, but a well-informed approach to real estate never goes out of style.
As you move forward with your real estate goals, remember that knowledge is power. Stay curious, ask questions, and don't hesitate to seek expert advice when you need it. Your future self will thank you for the diligence you invest today.



