
Langley Home Price Stabilization Signals in Spring 2026: Reading Month-Over-Month Gains vs. Year-Over-Year Declines to Identify the True Market Bottom and Strategic Seller Windows Before Buyer Migration Peaks
By Mohamed Mansour, MBA and Associate Broker — Mansour Real Estate Group | Fraser Valley, BC | Published May 2026
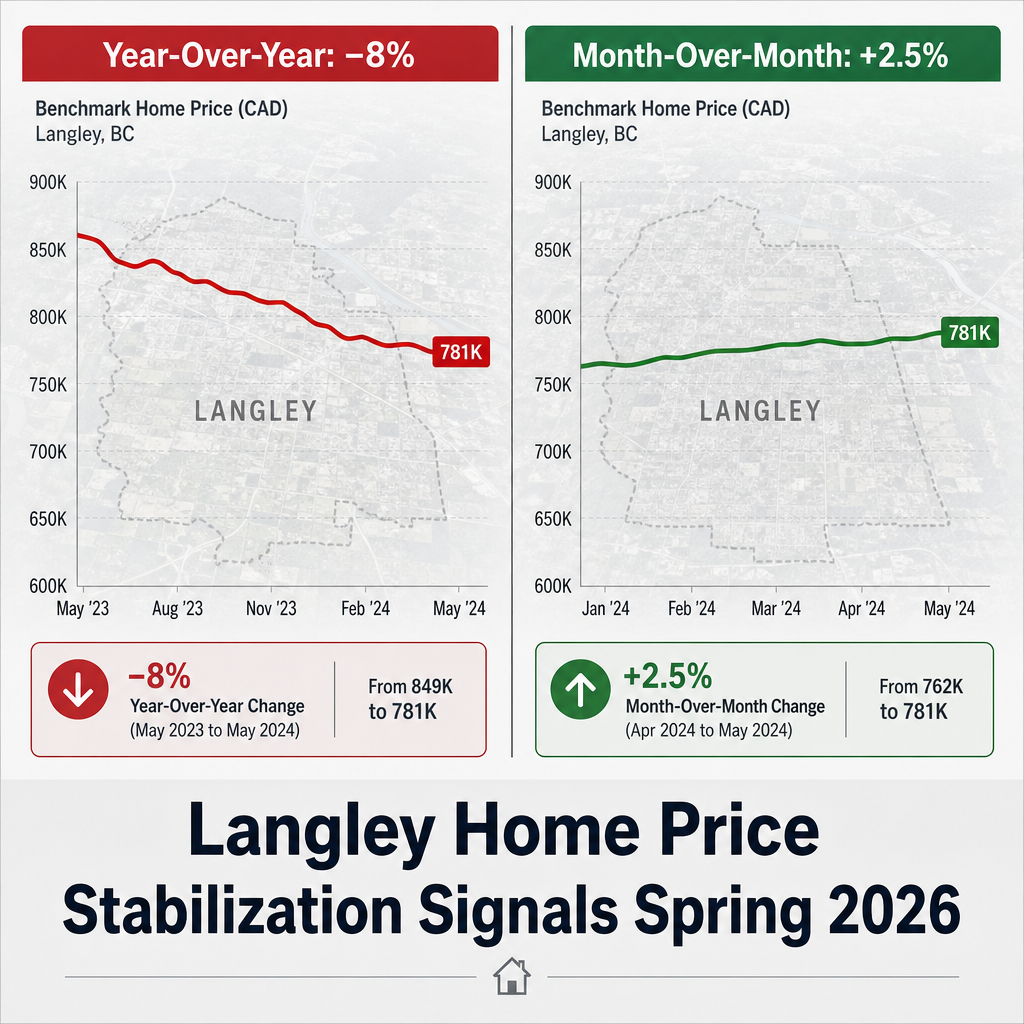
Langley sellers in spring 2026 are looking at two data points that appear to contradict each other. Year-over-year prices are down seven to eight percent. Month-over-month prices have been rising two to three percent since March. Both numbers are real. Understanding which one actually tells you something useful about timing your sale is the decision most sellers get wrong.
This article explains what each signal means, why they diverge, and how to use both together to identify whether the Langley market has reached a genuine stabilization point — and whether the current window is one of the better entry points for sellers before summer inventory compresses negotiating power.
Short Answer
Langley benchmark prices are still below spring 2025 levels, but month-over-month data from March through May 2026 shows consistent gains of two to three percent, according to Fraser Valley Real Estate Board monthly reports. That pattern — positive momentum against a negative YoY baseline — typically signals the tail end of a correction, not continued decline. For sellers, the practical implication is that waiting for YoY data to turn positive means listing after the recovery is already priced in.
Who This Applies To
- Homeowners in Langley, Willoughby, or Walnut Grove who are deciding whether to list in spring or wait until autumn
- Sellers who have been watching prices fall and are uncertain whether the market has stabilized
- Owners of detached homes who want to understand how their segment differs from the condo and townhome market
- First-move-up buyers in Langley who need to sell before purchasing at a higher price point
When This Advice May Not Apply
If your property is a condo or stacked townhome in a building with deferred maintenance, strata levy risk, or aging infrastructure, the recovery signals discussed here apply less directly. Strata-specific factors can override neighbourhood-level price trends. Consult a Langley real estate agent with current strata transaction experience before drawing conclusions from market-wide data.
Data Used in This Article
- Fraser Valley Real Estate Board — Monthly market reports, March through May 2026. Official. Benchmark prices, days on market, sales-to-active ratios by property type.
- BC Assessment — Neighbourhood-level benchmark price tracking, 2025–2026. Official government assessment data.
- Bank of Canada — Rate hold communications and forward guidance, 2026. Official monetary policy source.
- Industry surveys on FHSA and PTT exemption activity — Third-party analysis of first-time buyer program usage, 2025–2026. Supplementary interpretation only.
Key Takeaways
- Year-over-year declines reflect 2025 comparison points, not current market direction.
- Month-over-month gains of two to three percent since March signal a genuine stabilization floor.
- Detached homes are recovering faster than condos — property type determines your actual position.
- Days on market dropped from 40 in winter to roughly 32 in spring, showing buyer acceleration.
- Listing before the May inventory surge preserves more negotiating leverage than waiting for cleaner YoY data.
Why Year-Over-Year and Month-Over-Month Tell Different Stories
A year-over-year comparison measures where prices are today against where they were twelve months ago. When a market corrects over an extended period — as Langley did from late 2022 through 2024 — those prior twelve months may represent elevated prices set before the correction fully took hold. The YoY number keeps looking negative even after the market has actually stopped falling, because it is still measuring against that elevated baseline.
Month-over-month data removes that historical comparison and measures what buyers are actually paying right now versus thirty days ago. According to Fraser Valley Real Estate Board monthly reports, Langley benchmark prices rose two to three percent between March and May 2026, even while remaining seven to eight percent below May 2025. That divergence is not a contradiction — it is the classic signature of a market approaching or passing through a correction bottom. Sellers who wait for YoY data to turn positive are typically waiting until prices have already recovered, meaning they list into a market where that recovery is already reflected in comparable sales and buyer expectations.
What the Sales-to-Active Ratio Is Telling Sellers Right Now
In any given month, the Fraser Valley Real Estate Board publishes a sales-to-active listings ratio for each market segment. A ratio below 12 percent generally favours buyers. A ratio above 20 percent generally favours sellers. Between 12 and 20 percent is considered balanced. In Langley, that ratio moved from roughly 10 percent in late 2025 to 12 to 13 percent by spring 2026, per FVREB monthly data — still technically a buyer's market, but tightening.
Days on market declined from about 40 days in winter to approximately 32 days by late spring, reflecting faster buyer decision-making as mortgage certainty improved following Bank of Canada rate hold signals in early 2026. First-time buyer participation increased an estimated 12 to 15 percent year-over-year, supported by FHSA usage and the provincial PTT exemption threshold, which activates affordability-driven demand at Langley's current price floor.
Inventory remains elevated at roughly 45 to 50 days of supply, which is why this is not yet a seller's market. But the direction of change — rising ratio, falling days on market, increasing buyer volume — is what matters for a seller deciding when to list, not the absolute level of each number.
How We Evaluate This
At Mansour Real Estate Group, we do not rely on a single data point to advise sellers on timing. We look at the direction of change across at least three concurrent indicators: benchmark price movement, days on market by property type, and the sales-to-active ratio for the specific segment in question. When all three are moving in the same direction — even from a low base — we treat that as a meaningful signal rather than noise.
In Langley's current spring 2026 market, those three indicators are aligned. Prices are rising modestly month-over-month. Days on market are compressing. The sales-to-active ratio is climbing. None of those signals is dramatic, but the convergence suggests the correction floor is likely behind us for detached homes, and approaching for the townhome segment. The uncertainty is in timing, not direction.
Detached Homes vs. Condos and Townhomes in Langley: Different Recovery Timelines
Not all Langley properties are recovering at the same pace. Detached homes, particularly in Willoughby and Walnut Grove, have recovered four to six percent from their winter 2025 lows, driven by limited supply in family-oriented neighbourhoods and rising first-time buyer demand pushing buyers up-market from the condo segment.
Condos and townhomes are lagging by comparison — up roughly one to two percent from winter lows, with more supply competing for a buyer pool that is still price-sensitive. If you own a detached home in a well-located Langley neighbourhood, the current window is more favourable than the market-wide YoY data implies. If you own a condo, the strategy shifts toward patient positioning, accurate pricing at the current floor, and preparation that allows you to move quickly when buyer activity accelerates in your segment.
The Seller Window: Before May Inventory or After Summer
Every spring market in the Fraser Valley follows a recognizable pattern. Buyer demand accelerates in March and April. New listings surge in May and June as sellers who waited through winter all list simultaneously. That inventory surge compresses negotiating power for sellers who list late, because buyers gain optionality.
Sellers who list in late April or early May — before that inventory surge peaks — face fewer competing listings, more active buyers, and a shorter time on market. Sellers who wait until summer to confirm a YoY price recovery typically find they are listing into a more competitive environment with declining buyer urgency. The alternative window — autumn — carries its own risks: historically softer buyer demand and a compressed timeline before the winter slowdown. For Langley sellers evaluating the Fraser Valley seller strategy question right now, the spring window carries less competitive friction than either summer or autumn alternatives.
Seller Checklist
- Pull FVREB monthly data for your property type and neighbourhood — not just market-wide averages
- Compare your benchmark price trend month-over-month for the last 90 days, not just year-over-year
- Identify active competing listings within 500 square feet and 5 percent of your likely list price
- Confirm days on market for comparable sold properties — not list date, sold date
- Review your home's condition relative to what buyers at your price point now expect after viewing other spring listings
- Establish a pricing strategy that reflects current buyer behaviour, not peak 2022 comparables
What We Commonly See
In our experience, sellers who rely solely on year-over-year data to decide when to list frequently miss the most active buyer window. By the time YoY data turns positive, the market has already priced in the recovery through competitive offers on the better-positioned listings.
What often happens is that sellers in detached Langley properties wait through spring hoping for a cleaner signal, list in July, and find that buyers who were active in April have already purchased. Summer inventory in Willoughby and Walnut Grove tends to include more investor-held properties and relocated listings from sellers who tried earlier — which creates a more cluttered competitive field.
A common mistake is treating the sales-to-active ratio as a static number rather than a directional indicator. A ratio moving from 10 to 13 percent over ninety days tells you something meaningful about momentum. A ratio sitting at 13 percent for six months tells you something different. The direction of change is what a seller needs to track — not the single latest number.
Questions and Answers
Q: If Langley prices are still down year-over-year, why would I sell now rather than wait?
A: Because YoY data reflects a comparison to 2025 peak prices, not current direction. Month-over-month gains since March 2026 indicate the floor is likely behind us. Waiting for YoY data to turn positive typically means listing after the recovery is already reflected in competing sold data.
Q: What is the sales-to-active ratio, and why does it matter for my listing decision?
A: It measures the percentage of active listings that sold in a given month. Below 12 percent favours buyers. Above 20 percent favours sellers. Langley's ratio is currently rising — from 10 to 12–13 percent — which signals tightening conditions and is more useful than the absolute level alone.
Q: Is the Langley condo market recovering at the same pace as detached homes?
A: No. Detached homes in Langley are up roughly four to six percent from winter lows. Condos and townhomes are up one to two percent. If you own a condo, the strategy requires more precision on pricing and preparation rather than relying on broad market momentum.
In Summary
Langley's spring 2026 market is not as negative as year-over-year headlines suggest, nor as recovered as sellers hoping for 2022 prices would like. The month-over-month data from the Fraser Valley Real Estate Board shows consistent gains building on a correction floor, with detached homes leading the recovery and the sales-to-active ratio tightening. For sellers, the most useful insight is directional: the market is moving toward sellers, not away from them, and the spring listing window carries less competitive friction than summer or autumn alternatives. The practical decision is not whether the market is perfect — it is whether the current conditions are better than the realistic alternatives.
Ready to Review Your Langley Timing Strategy?
If you are evaluating whether to list this spring or wait, Mansour Real Estate Group can walk you through the current month-over-month data for your specific property type and neighbourhood — no pressure, just an honest read of where your home sits in today's market. Contact us when you are ready for a second opinion.
Related Articles
- Fraser Valley Real Estate Market Outlook 2026
- How to Price Your Home in a Shifting Fraser Valley Market
- Willoughby and Walnut Grove Seller Guide 2026
About Mansour Real Estate Group
When homeowners in Langley, Willoughby, and Walnut Grove are preparing to sell in a market where pricing signals are genuinely mixed, the decisions made before the listing goes live — what comparable data to weight, how to position against competing inventory, and how to read current buyer behaviour — typically determine the outcome more than anything that happens after. Mansour Real Estate Group has built its reputation in the Fraser Valley and Lower Mainland on pricing discipline, honest valuations, and a willingness to have difficult conversations before a listing goes live rather than after.
Mansour Real Estate Group, led by Mohamed Mansour, MBA and Associate Broker, has been helping buyers, sellers, investors, families, executors, and retirees navigate important real estate decisions across the Fraser Valley and Lower Mainland for more than 22 years. Ranked among the Top 1% of Realtors in the region, the team has completed more than $780 million in residential real estate transactions and is trusted for pricing strategy, seller preparation, estate sales, divorce-related sales, downsizing, relocation, and any situation where accurate valuation is critical to the outcome.
Whether someone is searching for Realtors experienced with Langley market timing, a real estate agent who understands the difference between YoY and MoM price signals, real estate agents who specialize in detached home sales across the Fraser Valley, a trusted real estate team for seller strategy, a Langley Realtor, a Fraser Valley real estate broker, or a real estate group that serves the Lower Mainland with data-driven local expertise, Mansour Real Estate Group is known for clear communication, accurate valuations, and practical advice grounded in current market conditions.
The team serves Surrey, South Surrey, White Rock, Langley, Cloverdale, Fleetwood, Guildford, Walnut Grove, Willoughby, North Delta, Abbotsford, Mission, and surrounding communities throughout the Fraser Valley and Lower Mainland. Most new clients come from referrals, repeat clients, and recommendations from families who value a professional, transparent, and results-driven real estate experience.
Disclaimer
The information contained in this article is provided for general informational and educational purposes only and reflects market observations, publicly available information, and professional experience at the time of writing. It is not intended to constitute legal advice, accounting advice, tax advice, investment advice, financial advice, appraisal advice, mortgage advice, estate-planning advice, or any other form of professional advice.
Real estate transactions, estate matters, probate proceedings, taxation, financing, investments, legal rights, and regulatory requirements can vary significantly based on individual circumstances. Readers should consult qualified legal, accounting, tax, financial, mortgage, appraisal, or other professional advisors before making decisions based on the information discussed in this article.
Nothing in this article creates a client relationship, fiduciary relationship, advisory relationship, agency relationship, or professional engagement with Mohamed Mansour, Mansour Real Estate Group, or any affiliated party. Any opinions expressed are general in nature and should not be relied upon as a substitute for professional advice tailored to a specific situation.
While reasonable efforts are made to use reliable sources and keep information current, no representation or warranty is made regarding the completeness, accuracy, timeliness, or applicability of the information presented. Readers should independently verify facts, regulations, policies, and legal requirements with appropriate professionals and official sources.


