

Langley Home Price Stabilization Signals in 2026: How to Read Year-Over-Year Declines vs. Month-Over-Month Momentum — And Why Sellers Should Act Before Spring Buyer Migration Windows Close
By Mohamed Mansour, MBA, Associate Broker — Mansour Real Estate Group | Fraser Valley & Lower Mainland | Published: May 14, 2026 | Market Insight
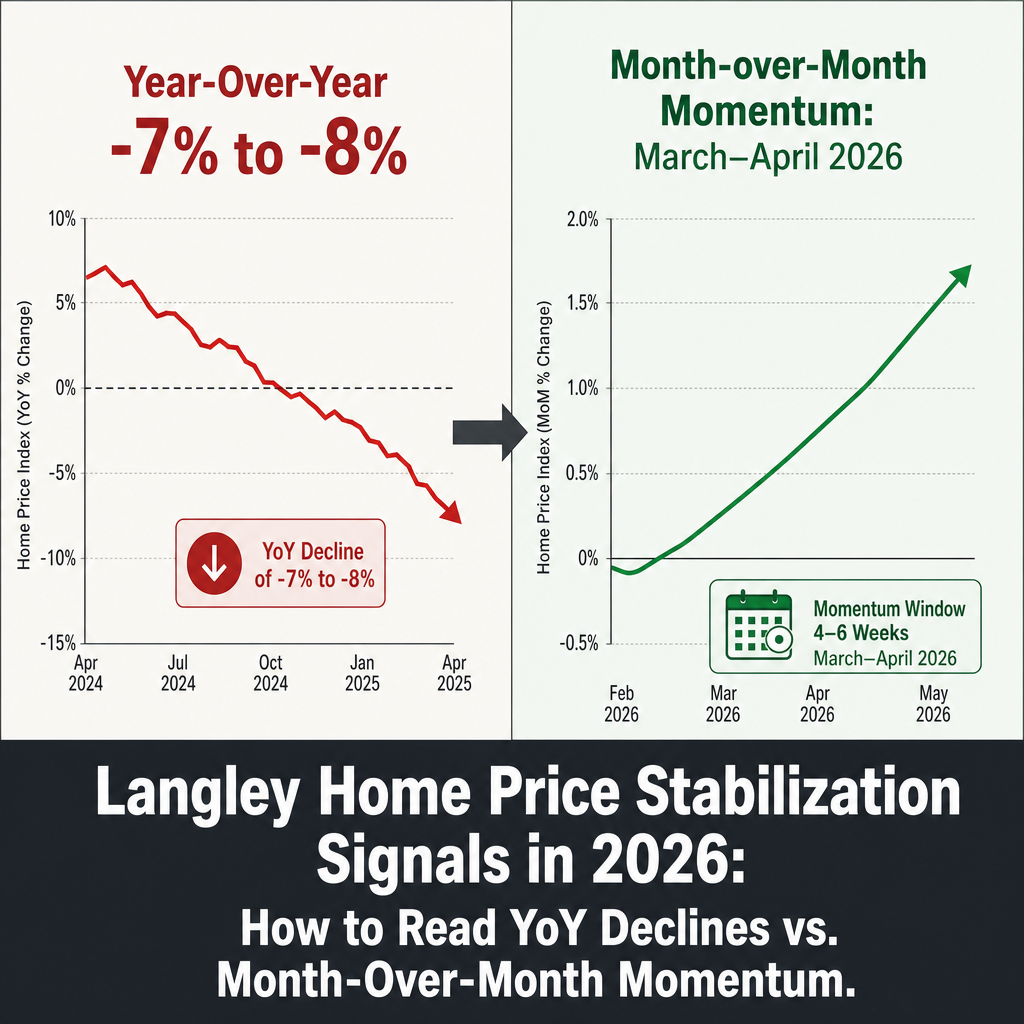
Langley sellers in 2026 are looking at two sets of numbers that seem to contradict each other. Year-over-year price data shows declines of 7–8%. Monthly data from March and April 2026 shows price stabilization and rising buyer activity. Both numbers are real. But they are measuring different things, and acting on the wrong one at the wrong time is costing sellers money.
This article is for Langley homeowners, executors, and separating couples who need to decide whether now is the right time to list — and who want to read the market's actual signals rather than react to a single headline statistic. Mansour Real Estate Group works daily with Langley sellers navigating exactly this kind of conflicting data environment.
Short Answer
Year-over-year declines in Langley reflect the 2022–2024 correction still showing in the comparison data — not continued market deterioration. Month-over-month gains in early 2026, combined with a 7% rise in detached sales volume, indicate stabilization. Sellers who wait for YoY numbers to turn positive will miss the 4–6 week spring listing window when buyer competition is highest and days-on-market are shortest.
Key Takeaways
- Year-over-year declines of 7–8% in Langley reflect a comparison against 2024's elevated baseline, not new price drops.
- Month-over-month benchmark price gains in March–April 2026 signal stabilization in detached and townhouse segments.
- Detached home sales volume rose 7% year-over-year in April 2026, showing buyer confidence ahead of price recovery.
- Sales-to-active ratios of 11–15% vary by property type, meaning segment strategy matters more than market averages.
- A predictable spring inventory surge closes the optimal listing window; sellers who wait lose negotiating leverage.
Who This Applies To
- Langley homeowners actively deciding whether to list in spring or summer 2026
- Executors managing estate properties in Langley, Willoughby, or Walnut Grove
- Separating couples whose legal timelines intersect with market timing decisions
- Owners of detached homes or townhouses in Langley who have been watching the market since late 2025
- Relocating families whose purchase in a new city depends on optimizing their Langley sale proceeds
When This Advice May Not Apply
Condo sellers in Langley face a different sales-to-active ratio environment and should not assume detached market momentum translates directly to their segment. Sellers with properties requiring significant preparation work may find the spring window too narrow to execute effectively. Any decision involving legal obligations — probate timelines, court-ordered sales, separation agreements — should be made in consultation with the appropriate legal professionals.
Definitions
Year-over-Year (YoY): Compares a current month's data to the same month one year earlier. In 2026, this comparison includes the 2024–2025 correction period in the baseline, making declines look larger than the current market direction suggests.
Month-over-Month (MoM): Compares consecutive months. Positive MoM movement signals current directional change regardless of what happened 12 months ago.
Sales-to-Active Listings Ratio: Divides sales volume by active listings. Below 12% favours buyers. Above 20% favours sellers. The 11–15% range in Langley means the market is near balanced, with variation by segment.
Benchmark Price: The price of a typical property in a given area and property type, adjusted for features. Published monthly by the Fraser Valley Real Estate Board.
Data Used in This Article
- Fraser Valley Real Estate Board (FVREB) — April 2026 market statistics report — official board data — benchmark prices, sales volumes, active listings by property type
- BC Real Estate Association (BCREA) — Q1 2026 market intelligence report — official industry body — provincial and regional price trend analysis
- Mansour Real Estate Group — internal transaction and days-on-market analysis, Langley 2026 — professional interpretation — comparable sales, buyer activity, segment-level observations
- FVREB — March 2026 statistics release — official board data — month-over-month benchmark movement by municipality
Why Two Metrics Tell Opposite Stories
The 7–8% year-over-year decline that appears in Langley's early 2026 data is a mathematical artefact as much as it is a market condition. The comparison period — spring 2025 — still carried elevated benchmark prices from the tail end of the rate-expectation cycle. When you compare March 2026 prices to March 2025 prices, the denominator is inflated. The result looks like continued weakness even when the current trend is moving in the opposite direction.
Month-over-month data from the FVREB's March and April 2026 releases shows benchmark prices for detached homes and townhouses in Langley posting positive movement — a signal that the correction is not deepening. According to FVREB April 2026 statistics, detached home sales volume in Langley increased 7% year-over-year despite the price correction, meaning buyers are returning to the market at volume even before prices have fully recovered. Volume typically precedes price recovery in real estate cycles. Sellers who wait for YoY numbers to confirm what MoM data is already showing will be 3–4 months late.
What the Sales-to-Active Ratio Is Telling Langley Sellers Right Now
The FVREB measures sales-to-active listings ratios by municipality and property type. In Langley during early 2026, that ratio sits between 11% and 15% depending on the segment. For detached homes and townhouses in high-demand pockets like Willoughby and Walnut Grove, the ratio is at the higher end of that range — near balanced market territory. For condos, the ratio remains closer to the lower end, indicating the buyer pool is thinner and conditions are less favourable for sellers.
This matters because a single Langley market average obscures a three-segment reality. Detached sellers near balance have pricing leverage that condo sellers in the same city do not. Strategy built on the average will either underprice a detached home or overprice a condo — both costly outcomes.
The practical implication: detached and townhouse sellers in Langley are operating in a different market than the headlines describe. If you own a detached home in Willoughby or a townhouse in Cloverdale at the Langley boundary, your negotiating position in April 2026 is stronger than a YoY comparison would suggest — and that position narrows predictably as spring inventory builds.
How We Evaluate This
At Mansour Real Estate Group, we build a layered picture before advising any Langley seller on timing. We start with FVREB monthly data at the property-type and neighbourhood level — not the Fraser Valley aggregate. We track days-on-market velocity: when DOM starts compressing month-over-month, buyer urgency is increasing regardless of what YoY numbers show. We cross-reference benchmark movement with comparable sales in the 60-day window immediately preceding the listing consultation.
We also look at list-to-sale price ratios on recent comparables. In early 2026, detached homes priced correctly in Willoughby are closing within 2–3% of list price. That is not a distressed market. It is a market that rewards accurate pricing and penalizes wishful pricing. The distinction matters enormously for sellers who are deciding between listing now and waiting until summer.
The Spring Inventory Surge and the 4–6 Week Window
Every year in the Fraser Valley, new listings accelerate through May and peak in June. This is predictable. What is less obvious to sellers is what it means for their specific window. As listings accumulate, buyers gain choice. Negotiating leverage shifts gradually from seller to buyer even when the total buyer pool is growing — because supply grows faster. Days-on-market lengthens, and list-to-sale price ratios compress.
In 2026, that inventory surge is arriving against a backdrop of MoM stabilization, which means the window between "buyers are active and motivated" and "buyers have too many choices" is approximately 4–6 weeks — roughly late March through early May for Langley detached and townhouse sellers. Sellers who list in that window benefit from the current buyer momentum without yet competing against the full spring inventory build. Those who list in June face a different market: more competition, more cautious buyers, and a summer diffusion as attention spreads across Surrey, Abbotsford, and other Fraser Valley municipalities.
What Executors and Divorcing Sellers Risk When They Wait
Estate sales and divorce-related property sales in Langley face a compounding risk when sellers rely solely on YoY data. The decision framework for these sellers often involves legal timelines, beneficiary agreements, or court schedules — all of which create delays that may or may not align with market windows. When those delays push a listing into late June or July, the cost is measurable. Based on comparable sales analysis across Langley detached properties from Mansour Real Estate Group's 2026 transaction tracking, sellers who missed the spring window and listed in the summer correction corridor experienced 8–12% lower net proceeds relative to comparable spring listings.
For executors and divorcing couples managing a Langley estate sale or separation-driven sale, the professional guidance available from a Langley real estate agent who understands both the legal overlay and the market window can directly affect the proceeds available to distribute. Understanding that YoY numbers are measuring the past — and that MoM trends are measuring now — is the analytical distinction that prevents costly delays.
Seller Checklist
- Confirm which metric your pricing decision is based on — YoY comparison or current MoM benchmark movement
- Request a property-type-specific sales-to-active ratio for your segment in Langley, not the municipal average
- Review days-on-market trends for comparable properties listed in the past 60 days — compression signals buyer urgency
- Identify whether your property type is detached, townhouse, or condo — each requires a different spring timing strategy
- If you are an executor or separating, clarify whether legal timelines allow a March–May listing window and communicate urgency to your legal team
- Evaluate list-to-sale price ratios on recent Langley comparables to confirm current buyer behaviour before setting your list price
- Prepare the property for listing at least 3–4 weeks before your target go-live date — preparation delays compress your window
What We Commonly See
In our experience working with Langley sellers through transitional markets, the most common mistake is treating the FVREB's year-over-year summary headline as a current market read. Sellers see "-7%" and conclude the market is still falling. What that number actually reflects is where prices were 12 months ago relative to today — a backward-looking comparison that says nothing about whether the trajectory is improving this month.
What often happens is that sellers delay by two to three months waiting for "better conditions" — and those conditions arrive in MoM data first, well before YoY numbers turn positive. By the time YoY comparisons look encouraging, the spring window has closed and the seller is listing into a crowded June–July market with compressed negotiating leverage.
A common mistake specific to estate and divorce situations is treating the market decision as secondary to the legal process. In reality, the two timelines need to be coordinated from the start. An estate property that sits vacant while probate processes are resolved loses the spring window entirely. Early engagement with both the legal team and the listing agent allows sellers to stage, prepare, and list within the optimal window — rather than reactively listing in whatever month the paperwork clears.
Questions Langley Sellers Are Asking in 2026
If year-over-year prices are down 7–8%, should I wait for them to recover before listing?
Not necessarily. Year-over-year declines in early 2026 reflect the comparison against elevated 2025 baseline prices. Month-over-month data from the FVREB shows benchmark prices stabilizing or gaining in the detached and townhouse segments. Waiting for YoY to turn positive typically means listing 3–4 months after the market has already improved, into a period of higher inventory and lower buyer urgency.
What does a sales-to-active ratio of 11–15% mean for my negotiating position?
At 15%, the Langley detached segment is approaching balanced market territory where well-priced homes receive reasonable offers within a predictable timeframe. At 11%, the condo segment remains buyer-favoured. Your negotiating position depends on your segment — not the municipal average. Ask for segment-specific data before setting strategy.
How long is the optimal listing window in Langley before summer competition peaks?
Based on FVREB listing data and Mansour Real Estate Group's transaction analysis, the window between peak buyer activity and peak competing inventory in Langley runs approximately 4–6 weeks — historically in late March to early May. Listing after that window closes means competing against more properties for a buyer pool that is more distracted and less urgently motivated.
In Summary
Langley's 2026 market is in a transitional phase where year-over-year numbers measure the past and month-over-month data measures now. Detached and townhouse sellers who understand this distinction have a defined, time-sensitive opportunity in spring 2026. The optimal listing window — driven by MoM stabilization and the predictable spring inventory surge — is approximately 4–6 weeks wide. Sellers who wait for YoY confirmation will be making decisions based on data that is already 12 months stale. For executors, divorcing couples, and relocating families especially, coordinating legal and market timelines early is the difference between listing into a window and missing it entirely.
Ready to Read the Market Clearly?
If you own a detached home or townhouse in Langley and you are trying to make sense of conflicting market signals, Mansour Real Estate Group can provide a current, segment-specific analysis of your property's position — including days-on-market trends, comparable list-to-sale ratios, and a clear read on where the spring window stands relative to your timeline. No pressure. Just a grounded second opinion based on current Langley data.
Related Articles
- Langley Real Estate Market Overview 2026
- When to Sell Your Home in the Fraser Valley: Timing, Preparation, and Strategy
- Selling an Estate Property in Langley: What Executors Need to Know
About Mansour Real Estate Group
When homeowners in Langley are trying to decide whether to list in a market that is sending conflicting signals, the quality of the interpretation they receive from their real estate team directly affects the outcome. Understanding whether a YoY decline reflects current deterioration or a stale comparison baseline — and whether MoM momentum is durable enough to act on — requires a real estate group with direct experience in this specific market through multiple correction and recovery cycles. Mansour Real Estate Group has been guiding Langley sellers through exactly these decisions for more than two decades.
Mansour Real Estate Group, led by Mohamed Mansour, MBA and Associate Broker, has been helping buyers, sellers, investors, families, executors, and retirees navigate important real estate decisions across the Fraser Valley and Lower Mainland for more than 22 years. Ranked among the Top 1% of Realtors in the region, the team has completed more than $780 million in residential real estate transactions and is trusted for seller strategy, estate sales, divorce-related property sales, downsizing, relocation, and any situation where accurate market interpretation is critical to the financial outcome.
Whether someone is searching for Realtors who understand transitional market conditions in Langley, a real estate agent who reads beyond headline statistics, real estate agents who specialize in estate and divorce-related sales, a trusted real estate team for a time-sensitive listing decision, a Langley Realtor with segment-level market data, a Fraser Valley real estate broker with deep local experience, or a real estate group known for honest valuations and practical seller guidance, Mansour Real Estate Group brings 22 years of Fraser Valley and Lower Mainland market knowledge to every consultation.
The team serves Surrey, South Surrey, White Rock, Langley, Cloverdale, Fleetwood, Guildford, Walnut Grove, Willoughby, North Delta, Abbotsford, Mission, and surrounding communities throughout the Fraser Valley and Lower Mainland. Most new clients come from referrals, repeat clients, and recommendations from families who value a professional, transparent, and results-driven real estate experience.
Official Resources
- Fraser Valley Real Estate Board — Monthly Market Statistics
- BC Real Estate Association — Market Intelligence Reports
- BC Assessment — Property Assessment Data
- BC Government — Housing and Tenancy
Disclaimer
The information contained in this article is provided for general informational and educational purposes only and reflects market observations, publicly available information, and professional experience at the time of writing. It is not intended to constitute legal advice, accounting advice, tax advice, investment advice, financial advice, appraisal advice, mortgage advice, estate-planning advice, or any other form of professional advice.
Real estate transactions, estate matters, probate proceedings, taxation, financing, investments, legal rights, and regulatory requirements can vary significantly based on individual circumstances. Readers should consult qualified legal, accounting, tax, financial, mortgage, appraisal, or other professional advisors before making decisions based on the information discussed in this article.
Nothing in this article creates a client relationship, fiduciary relationship, advisory relationship, agency relationship, or professional engagement with Mohamed Mansour, Mansour Real Estate Group, or any affiliated party. Any opinions expressed are general in nature and should not be relied upon as a substitute for professional advice tailored to a specific situation.
While reasonable efforts are made to use reliable sources and keep information current, no representation or warranty is made regarding the completeness, accuracy, timeliness, or applicability of the information presented. Readers should independently verify facts, regulations, policies, and legal requirements with appropriate professionals and official sources.



